CEI Advises CEQ to Withdraw Its NEPA Guidance on Greenhouse Gas Emissions and Climate Change

Photo Credit: Getty
Last week I submitted comments advising the Council on Environmental Quality (CEQ) to withdraw its proposed guidance on consideration of greenhouse gas (GHG) emissions and climate change in National Environmental Policy Act (NEPA) proceedings.
NEPA, enacted on January 1, 1970, is a procedural statute intended to ensure that federal agencies examine the potential environmental impacts of proposed actions—such as approving the construction of infrastructure projects—before finalizing their decisions.
CEQ’s guidance “encourages” (i.e. requires) agencies to align infrastructure project reviews with “national, science-based GHG reduction policies”—specifically, President Biden’s Paris Agreement pledge to cut U.S. GHG emissions in half by 2030 as part of a government-wide effort to achieve net-zero emissions by 2050.
My comments develop three main points:
- Advancing the President’s climate policy agenda is a purpose for which NEPA was not designed and which Congress has not subsequently authorized. CEQ’s proposal is unlawful.
- Contrary to CEQ, climate change is not a crisis. Thus, no bona fide emergency exists such as might justify the Council’s overreach as a ‘desperate measure for desperate times.’
- Even if climate change were a crisis, attempting to save the planet one infrastructure project at a time is like trying to drain a swimming pool one thimbleful at a time. It is a fool’s errand.
NEPA reviews are concerned with “major” federal actions “significantly affecting the quality of the human environment.” The GHG emissions of even the largest infrastructure project are several orders of magnitude smaller than any quantity capable of having detectable effects on global temperatures. Climatically-inconsequential GHG emissions are not “significant” effects for NEPA purposes.
The only discernible benefits of CEQ’s proposal are political. A consciousness-raising exercise, it will compel project managers and agency reviewers to continually recite the litany of climate doom. It will also facilitate naming and shaming, activist mobilization, and litigation against fossil-fuel infrastructure. The proposal is pretextual (motivated by reasons other than those expressly stated), which likely compounds its legal vulnerability.
Let’s turn now to CEQ’s core policy rationale.
Climate Change Is Not a Crisis
CEQ explains the proposal’s policy rationale as follows:
The United States faces a profound climate crisis and there is little time left to avoid a dangerous—potentially catastrophic—climate trajectory.
Improving State of the World
That assessment is incorrect. If climate change were a global ecological and economic crisis, we would expect to find evidence of declining health, welfare, and environmental quality over the past 50 years. Instead, from 1970 to 2019, we find dramatic improvements in global life expectancy, per capita income, food security, crop yields, and global burden of disease. In the United States, we also find dramatic reductions in air pollutant emissions and concentrations.
During 2020-2022, the COVID-19 pandemic killed millions and lockdown policies had their own deleterious impacts on public health and welfare. However, none of that is attributable to climate change.
Increasing Climate Safety
Of particular relevance, the average annual number of weather-related deaths per decade has declined by 96 percent since the 1920s, as Danish economist Bjorn Lomborg documents. That spectacular decrease in aggregate weather-related mortality occurred despite a fourfold increase in global population. That means the individual risk of dying from extreme weather events declined by 99.4 percent over the past 100 years. Far from being an impediment to such progress, fossil fuels were its chief energy source, as Alex Epstein chronicles in detail in Chapter 4 of his book Fossil Future.
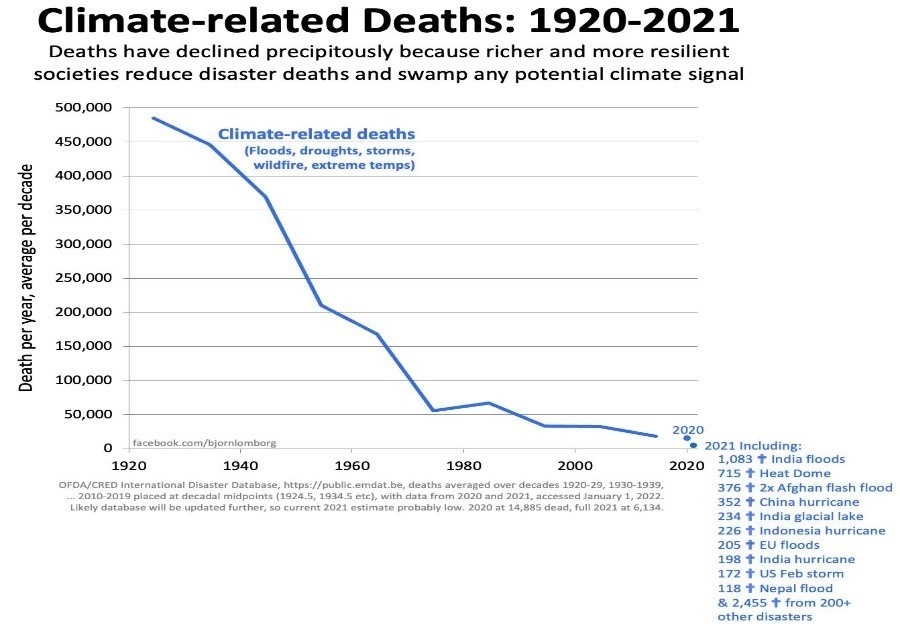
If annual climate related deaths had increased by 96 percent since the 1920s, or the individual risk of dying from extreme weather had increased by 99.4 percent, we would definitely have a climate crisis. But that is not what happened. Instead, the opposite occurred.
Increasing Climate Sustainability
The National Oceanic and Atmospheric Administration (NOAA) and other agencies flog the increasing number of billion-dollar U.S. weather disasters as evidence of a climate crisis. Here is the Financial Stability Oversight Council’s rendering of NOAA’s data.
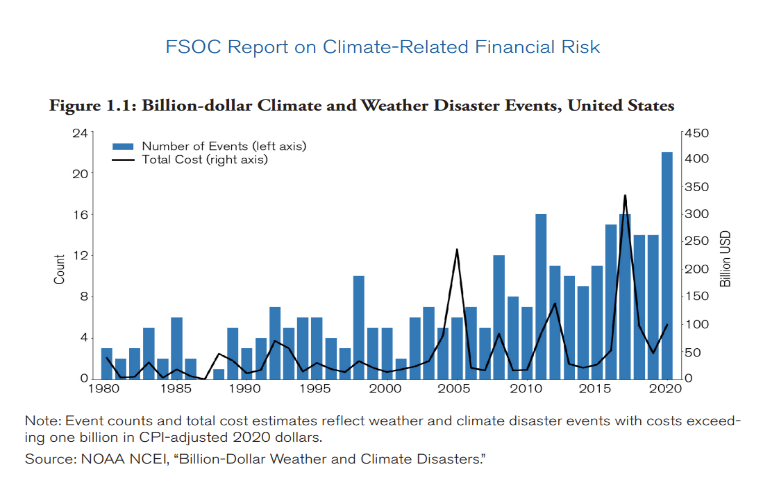
However, such charts ignore what Lomborg, in his book False Alarm, calls the “expanding bull’s eye.” More people + more stuff in harm’s way = bigger climate-related damages even if there is no change in the weather.
Since 1900, Lomborg notes, Florida’s coastal population has “increased a phenomenal 67 times.” In fact, just two Florida counties, Dade and Broward, have a larger population today than lived along the entire coast from Texas to Virginia in 1940. Consequently, “For a hurricane in 1940 to hit the same number of people as a modern hurricane ripping through Dade and Broward today, it would have had to tear through the entire Gulf of Mexico and Atlantic coastline.”
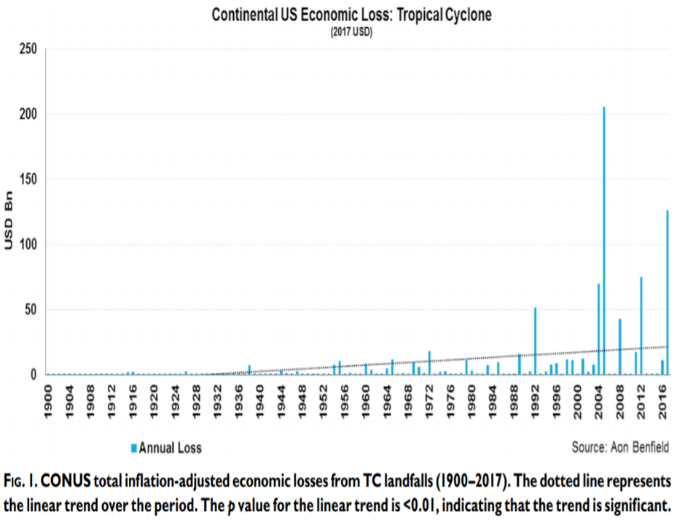
“Normalizing” the damages—estimating the economic losses from an historic extreme weather event if the same event were to occur under present societal conditions—creates a very different picture from that propagated by federal agencies. Consider hurricane damages, which constitute the largest portion of U.S. weather-related damages.
Here’s what hurricane damages look like if only adjusted for inflation, as NOAA does in its billion-dollar disaster reports.
Here are the same damages normalized for changes in population and exposed wealth. The trend line is flat. The apparent climate signal vanishes.
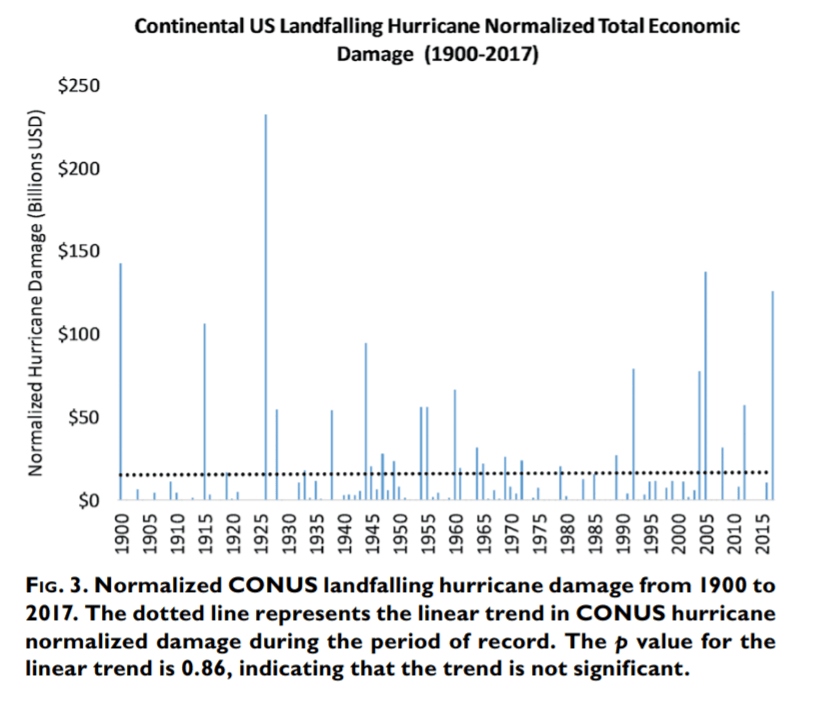
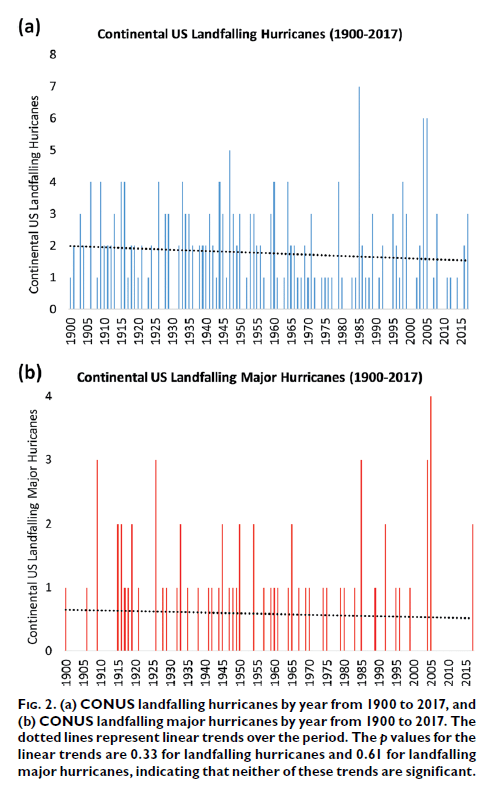
Consistent with the chart above, meteorological data show no long-term trend in the frequency or severity of U.S. landfalling hurricanes since 1900.
From a sustainability perspective, what matters is not total damages but relative economic impact—extreme weather damages as a share of GDP. Globally, weather-related losses per exposed GDP declined nearly five-fold from 1980-1989 to 2007-2016.
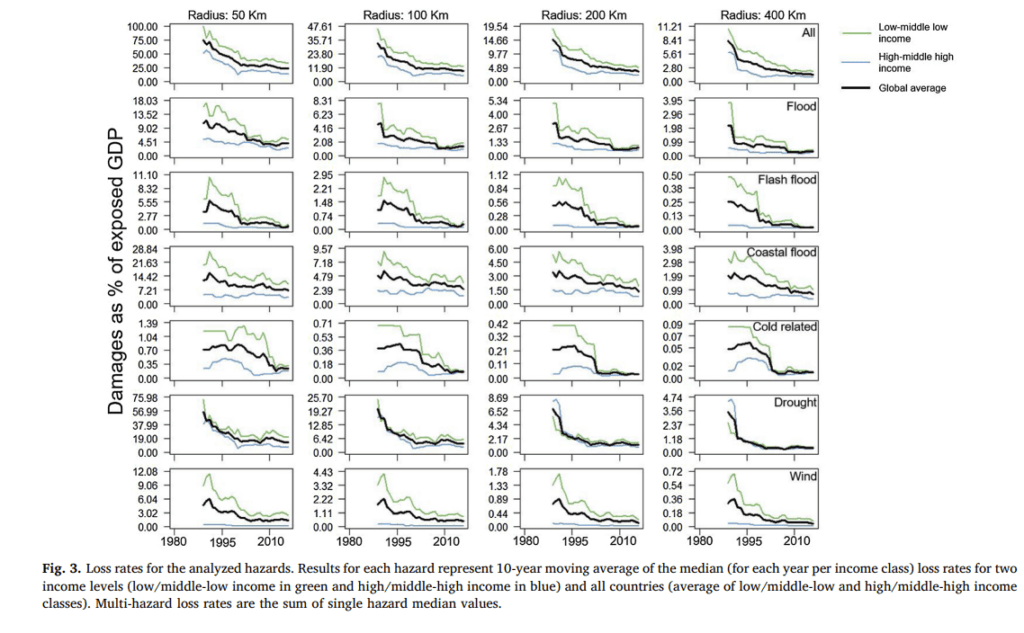
If damaging weather today were destroying almost five times the share of GDP as it did in the 1980s, we would definitely have a climate crisis. But that’s not what happened. Instead, the opposite occurred.
Improving Global Ecology
Climate crisis advocates seldom mention the immense agricultural and ecological benefits of carbon dioxide (CO2) emissions. By increasing plants’ water-use efficiency and photosynthetic activity, rising CO2 concentration boosts crop yields and greens the planet.
Using Food and Agricultural Organization economic data on 45 major food crops and an extensive database on CO2-growth response factors, climate researcher Craig Idso estimates that the ongoing rise in the air’s CO2 content added $3.2 trillion to global agricultural output during the 50-year period 1961-2011.
A satellite data study by Donohue et al. (2013) found that green foliage cover increased in arid environments by 11 percent during 1982-2010, due to the 14 percent rise in atmospheric CO2 over the same period. A satellite data study by Zhu et al. (2016) found a global increase in plant and tree leaf cover during 1982-2015 “equivalent in area to two times the continental United States.” A study by Campbell et al. (2017) of the long-term decrease in atmospheric concentrations of carbonyl sulfide, a molecule destroyed by photosynthetic activity, estimates that terrestrial plants are converting 31 percent more CO2 into organic matter than they did before the industrial revolution.
If empirical data revealed that rising CO2 concentration had depressed crop production by $3.2 trillion since 1961, diminished green foliage cover in arid regions by 11 percent since 1982, reduced global green foliage cover by an amount equal to twice U.S. land area, and decreased plant biomass from photosynthesis by 31 percent compared to preindustrial times, we would definitely have a climate crisis. But that is not what happened. Instead, the opposite occurred.
Methodological Bias: Inflated Emission Scenarios
CEQ claims “there is little time left to avoid a dangerous—potentially catastrophic—climate trajectory.” That assessment clashes with the positive trends discussed above. Three other considerations weigh heavily against the alleged urgency for “climate action.”
First, the rate of warming in the lower-troposphere, as measured by satellites and weather balloons, has not accelerated over the past 44 years. In the University of Alabama in Huntsville satellite record, the warming rate is a slow and steady 0.13°C per decade.
Second, the so-called business-as-usual emission baselines long used to project global warming and sea-level rise are highly inflated. RCP8.5 and SSP5-8.5—the dominant scenarios in the Intergovernmental Panel on Climate Change’s (IPCC’s) Fifth (AR5) and Sixth (AR6) assessment reports, respectively—are no longer plausible (if they ever were).
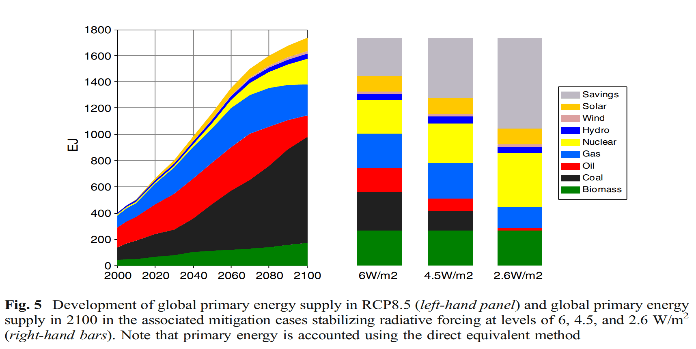
In those scenarios, the rise in GHG concentration during 2000-2100 boosts the preindustrial greenhouse effect by 8.5 watts per square meter (hence the number 8.5 in the titles of both scenarios). That increase in “radiative forcing” (warming pressure) happens only if the world “returns to coal.” RCP8.5, for example, assumes global coal consumption increases almost tenfold during 2000-2100.
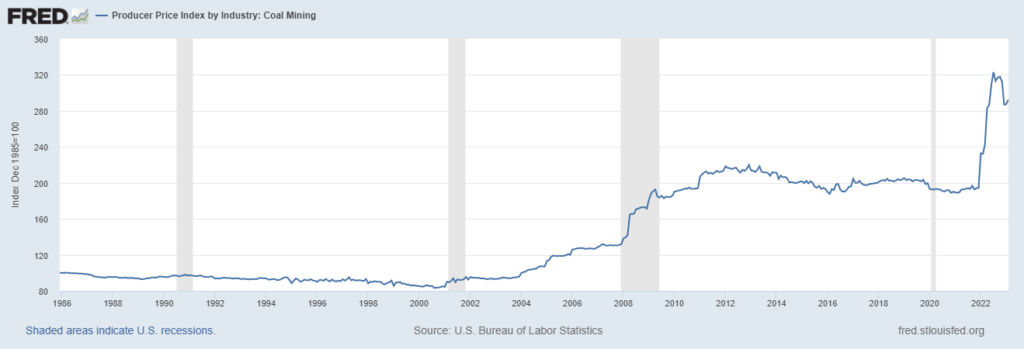
The scenarists assumed coal was destined to be the increasingly affordable backstop energy for the global economy. Things did not turn out that way.
It is difficult to exaggerate the extent to which RCP8.5 and SSP5-8.5 have distorted climate science, needlessly scared the public, and misled policymakers. According to Google Scholar, since 2019, researchers published 17,400 papers featuring RCP8.5 and 3,800 papers featuring SSP5-8.5. At its zenith, the academic “consensus” in favor of using those scenarios to estimate climate change impacts may have reached the fabled 97 percent. It is now crumbling.
As shown in the chart below by climate researchers Zeke Hausfather and Glenn Peters, midcentury CO2 emissions in the International Energy Agency’s (IEA’s) baseline scenarios (“current policies” and “pledged policies”) are less than half those projected by SSP5-8.5.
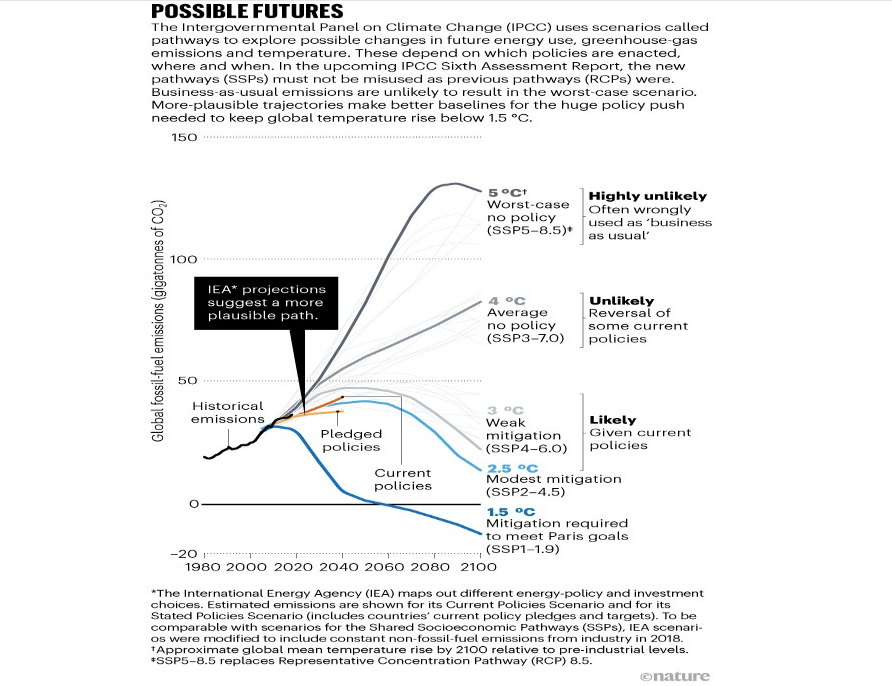
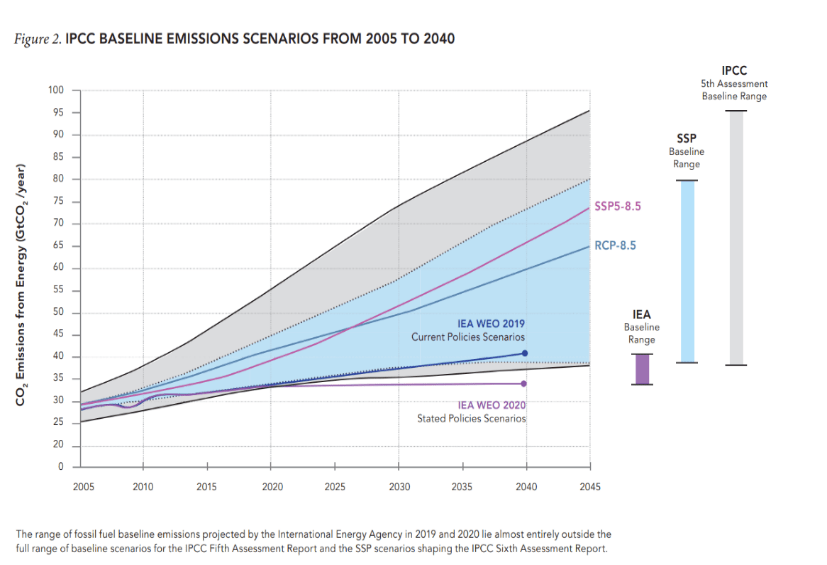
To put this another way, by 2040, the potential range of emissions in SSP5-8.5 and RCP8.5 lie almost entirely outside the range of the IEA’s emission baselines.
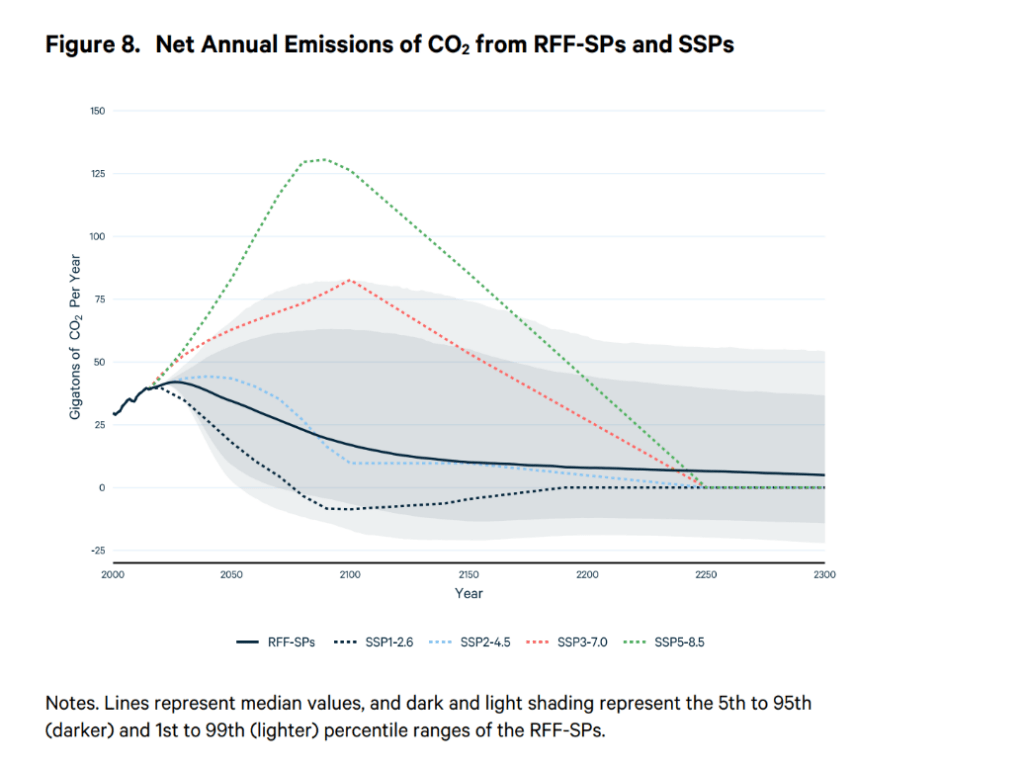
The next chart is by Kevin Rennert and his team at Resources for the Future (RFF). Annual CO2 emissions in the new RFF baselines are less than half those projected by SSP5-8.5 in 2050 and less than one-fifth those projected by SSP5-8.5 in 2100.
CEQ proposes that agencies use the social cost of greenhouse gases (SC-GHG) to “translate climate impacts into the more accessible metric of dollars.” In other words, agencies can weigh the SC-GHG-estimated “climate benefits” of blocking a proposed project against the economic returns expected from the project. That is sophistry. Effects that are too small to detect or experience are “benefits” in name only. Illusory benefits should not be weighed in the same scale with compliance costs that verifiably impose measurable costs on identifiable firms or individuals.
In any event, the SC-GHG estimates of the U.S. Government’s Interagency Working Group (IWG) have their own inflated emissions baseline problem. The IWG published technical support documents (TSD) estimating the social cost of carbon dioxide (SC-CO2) in 2010, 2013, 2016, and 2021. Each TSD uses the average of five emission scenarios as the baseline for estimating the incremental damage of an additional ton of CO2. The five scenarios average out to a baseline projection of 17,195 GtCO2 from 2000 to 2300—2.4 to 4.6 times estimated fossil fuel reserves.
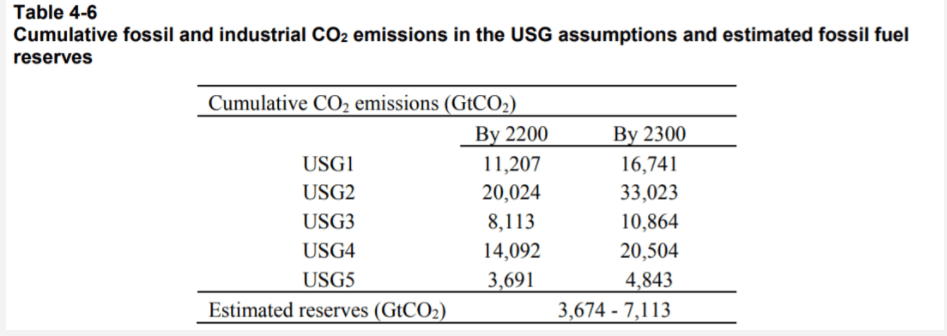
For CO2 emissions to reach 17,195 gigatons, the same countries that eagerly joined the Paris Agreement would have to collude to make burning coal a top global priority. That is beyond ridiculous.
The mean RFF baseline projection for 2000-2300 is 5,000 GtCO2—less than one-third of the IWG mean projection.
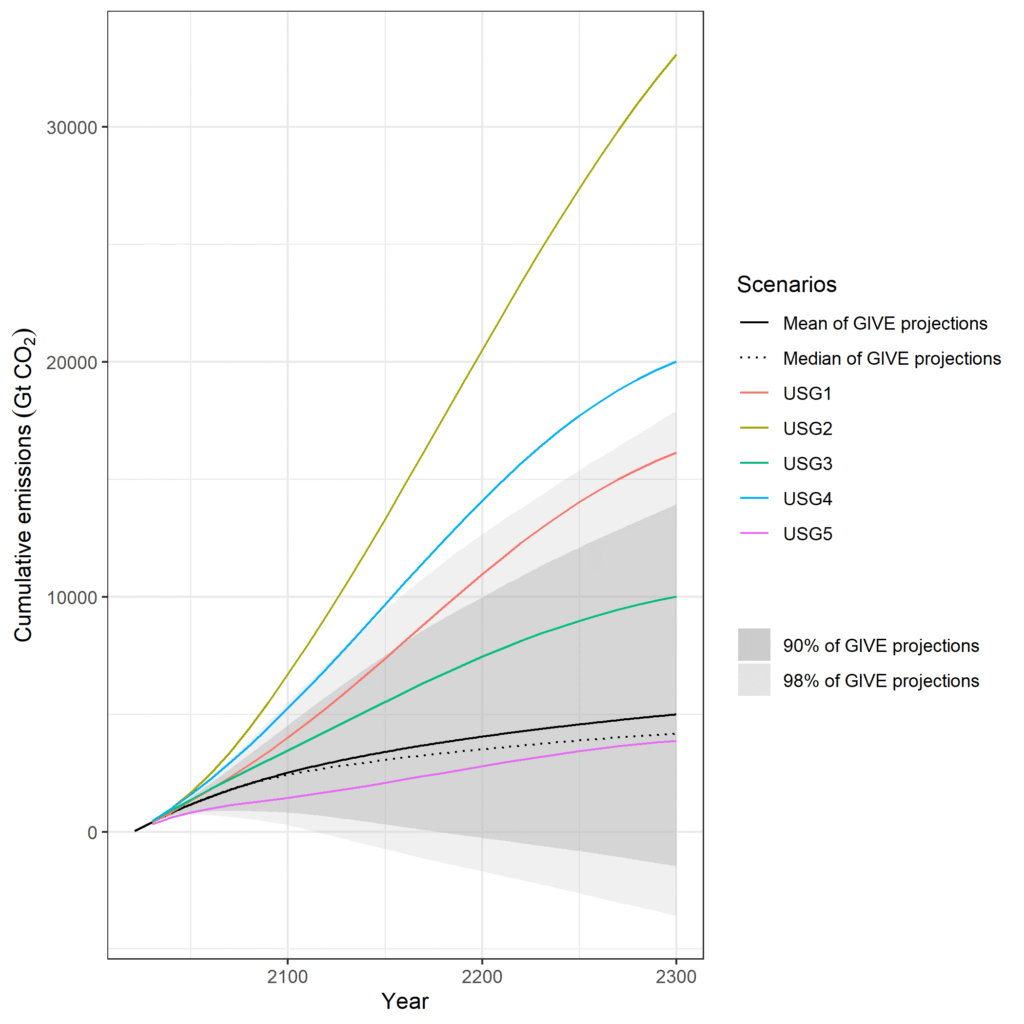
In short, CEQ’s claim that there is “little time left” to avert catastrophe is not credible. That might be the case if researchers suddenly realized emissions will be more than double the level previously projected for 2050, more than five times the level previously projected for 2100, and more than three times the level previously projected for 2000-2300. However, that is not what happened. Instead, the best available information suggests emissions in 2050, 2100, and 2300 will be much lower than “consensus” climatology assumed.
Methodological Bias: Overheated Climate Models
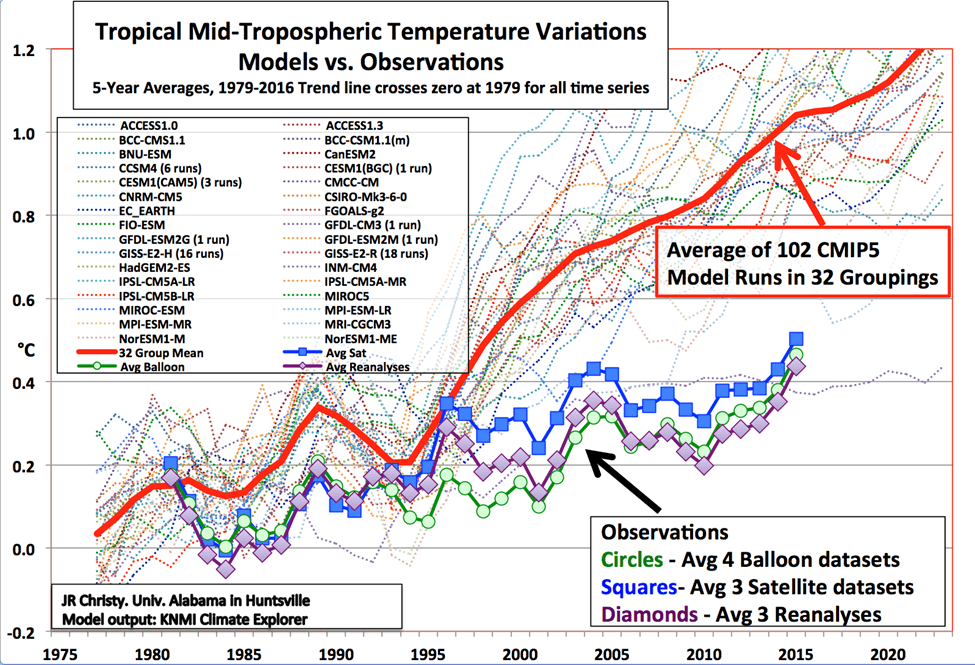
Another major reason to doubt the reality of a climate crisis is the persistent mismatch between modeled and observed warming in the troposphere, the atmospheric layer where most of the greenhouse effect occurs. The IPCC used the CMIP5 generation of climate models in AR5 and the CMIP6 generation in AR6. The CMIP5 models hindcast twice the observed warming in the tropical troposphere since 1979.
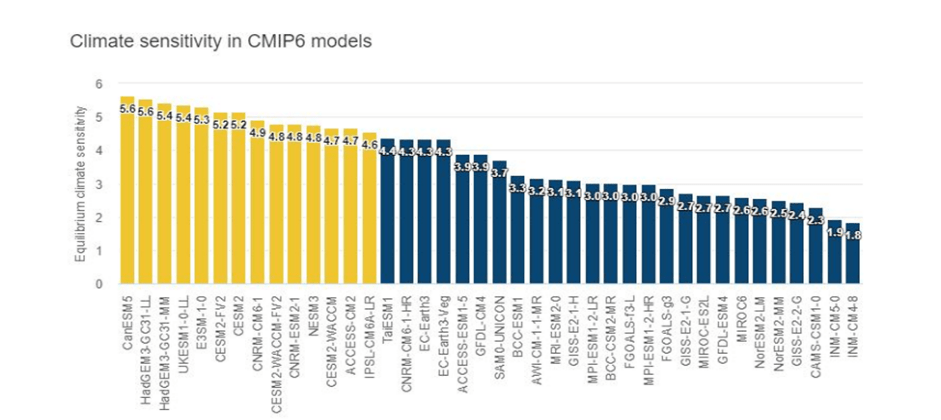
About one-third of the AR6 models have higher equilibrium climate sensitivities (ECS) than any model in the AR5 ensemble. ECS is the term used to describe how much warming will occur after the climate system fully adjusts to a doubling of atmospheric CO2 concentrations.
The tropics at altitude 300-200 hPa is the region best suited to test the validity of climate models. As explained by McKitrick and Christy (2018):
- All models predict a strong warming signal at 300-200 hPa in the tropical atmosphere.
- The region is well-monitored by satellites and weather balloons.
- The region is too high in altitude to be influenced by urban heat islands.
- Climate models are not “tuned” to match temperature trends in the tropical troposphere, so model simulations are genuinely independent of the data used to test them.
The CMIP6 models on average overshoot observed warming in the tropics at 300-200 hPa by more than a factor of two. Moreover, no CMIP6 model gets it right. All project too much warming.
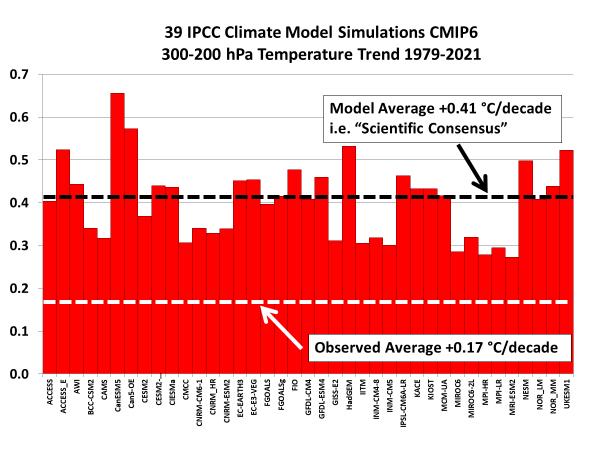
To sum up, the “science” underpinning the crisis narrative is a doubly-biased methodology in which overheated models are run with inflated emission scenarios. Absent those biases, climate change assessments would project less warming, smaller climate impacts, and lower tipping point risks. That means the urgency for “climate action” is much reduced even if one disregards the strong positive trends in global health and welfare, the 99.4 percent reduction in climate-related mortality risk over the past century, the almost fivefold reduction in the relative economic impact of damaging weather in recent decades, and the immense agricultural and ecological benefits of atmospheric CO2 enrichment.