The Cost of Regulation and Intervention
Ten Thousand Commandments 2018 - Chapter 3
Regulation and spending are related; both are implements by which governments act or compel individuals. Therefore, policy makers should disclose regulatory costs the same way they disclose spending, to give voters the opportunity to give full consideration as to what to regulate and how. Yet, they fail to do this despite being required by law to present an aggregate estimate for regulatory costs.
Legal scholar Phillip Hamburger has described the rise of a monarchical-style administrative state characterized by overdelegation of lawmaking power by Congress to executive branch agencies, in defiance of the Constitution, which “expressly bars the delegation of legislative power.” This overdelegation makes the administrative state attractive to progressive advocates of government regulation. Within the administrative state’s framework, regulations cannot be gotten rid of; they can generally, at best, be replaced with other regulations, and the state only grows.
The vastness of the regulatory enterprise remains unknown, as there are numerous categories of untabulated costs. The only official reckoning citizens get today is an OMB annual survey of a subset of regulatory costs and benefits. The OMB’s 2017 Draft Report to Congress on the Benefits and Costs of Federal Regulations and Agency Compliance with the Unfunded Mandates Reform Act, the most recent edition, only covers through FY 2015, despite being required annually by law. The report includes only a 10-year aggregate cost tabulation, when an aggregate one is required.
In any event, this report pegs the annual costs of 137 selected “major” regulations from 2006 to 2016 at between $78 billion and $115 billion (all figures here are in 2015 dollars).78The estimated range for benefits in the report was $287 billion to $911 billion.79 According to OMB, the 16 rules subjected to both benefit and cost analyses during FY 2016 added annual costs of $4.3 to $6.4 billion.
The OMB cost-benefit breakdown omits independent agencies and incorporates only those rules for which agencies have expressed both benefits and costs in quantitative and monetary terms—amounting to a couple dozen at best, when several thousand rules appear each year. Several billion dollars more in annual rule costs generally appear in these reports for rules with cost-only estimates, but they are not tallied and highlighted by OMB.
The Small Business Administration (SBA) in the past published a comprehensive assessment of the federal regulatory apparatus, but that was discontinued in 2010. The final edition of the report estimated regulatory compliance costs of $1.75 trillion for 2008.
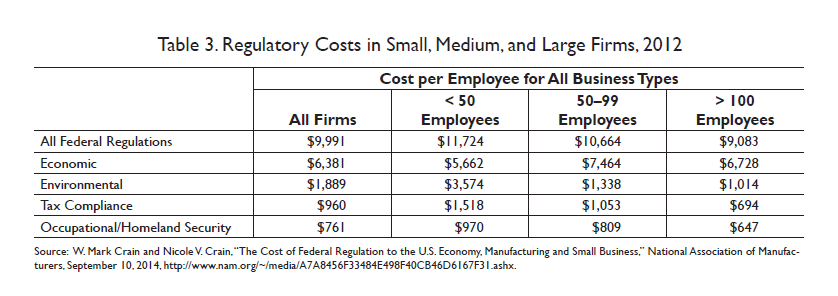
The primary purpose of the SBA report series was not an aggregate cost estimate but rather to examine the extent to which regulatory costs impose burdens on small firms, which have higher per-employee regulatory costs than larger ones. Earlier governmental assessments around the turn of the 20th century from the OMB, Government Accountability Office (GAO), and SBA have also found aggregate annual costs in the hundreds of billions of dollars, some in excess of $1 trillion in today’s dollars (see Table 2).
More recently in a 2014 report, the National Association of Manufacturers (NAM) estimated 2012 total annual regulatory costs in the economy of $2.028 trillion (in 2014 dollars). Still another report, by economists John W. Dawson of Appalachian State University and John J. Seater of North Carolina State University, pushes regulatory costs into the stratosphere by counting the longterm growth reduction caused by decades of increased opportunity costs imposed by economic regulation. Their report counts dozens of trillions of dollars in lost gross domestic product (GDP) annually.
A 2016 report by the Mercatus Center at George Mason University employs a microeconomic model to attempt to determine “how much regulation distorts the investment decisions of firms and thus hampers long-run economic growth.” According to this analysis, had regulatory burdens remained constant since 1980, the 2012 U.S. economy would have been 25 percent larger.
Put another way, during that time, the economy grew by at least $4 trillion less each year than it could have.
With respect to regulations’ unequal effects on different kinds of firms, the NAM’s model finds overall annual per-employee regulatory costs to firms of $9,991 on average, but the effects by firm size vary. Table 3 shows that per-employee regulatory costs for firms of fewer than 50 workers can be 29 percent greater than those for larger firms—$11,724 for smaller firms, compared with $9,083 for larger ones.
To allow for incremental updates to an aggregate baseline, estimates of compliance and economic costs for the federal regulatory apparatus, this report compiles legacy sources such as the annual OMB Report to Congress on costs and benefits over the years, data such as paperwork burdens described in OMB’s annual Information Collection Budget, the few independent agency cost estimates available, and other publicly available material and third-party assessments. The SBA and earlier OMB surveys had traditionally conveyed regulatory costs in the following categories:
- Economic regulatory costs (for example, market entry restrictions and transfer payments such as price supports that shift money from one pocket to another);
- Workplace regulatory costs;
- Environmental regulatory costs; and
- Paperwork costs.
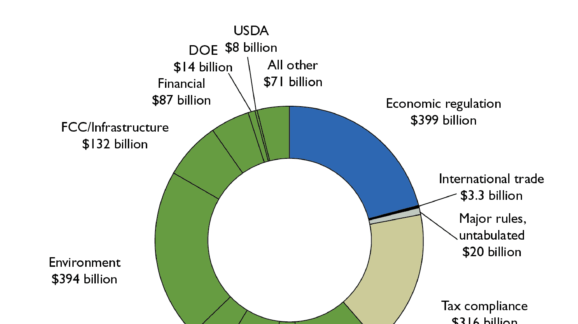
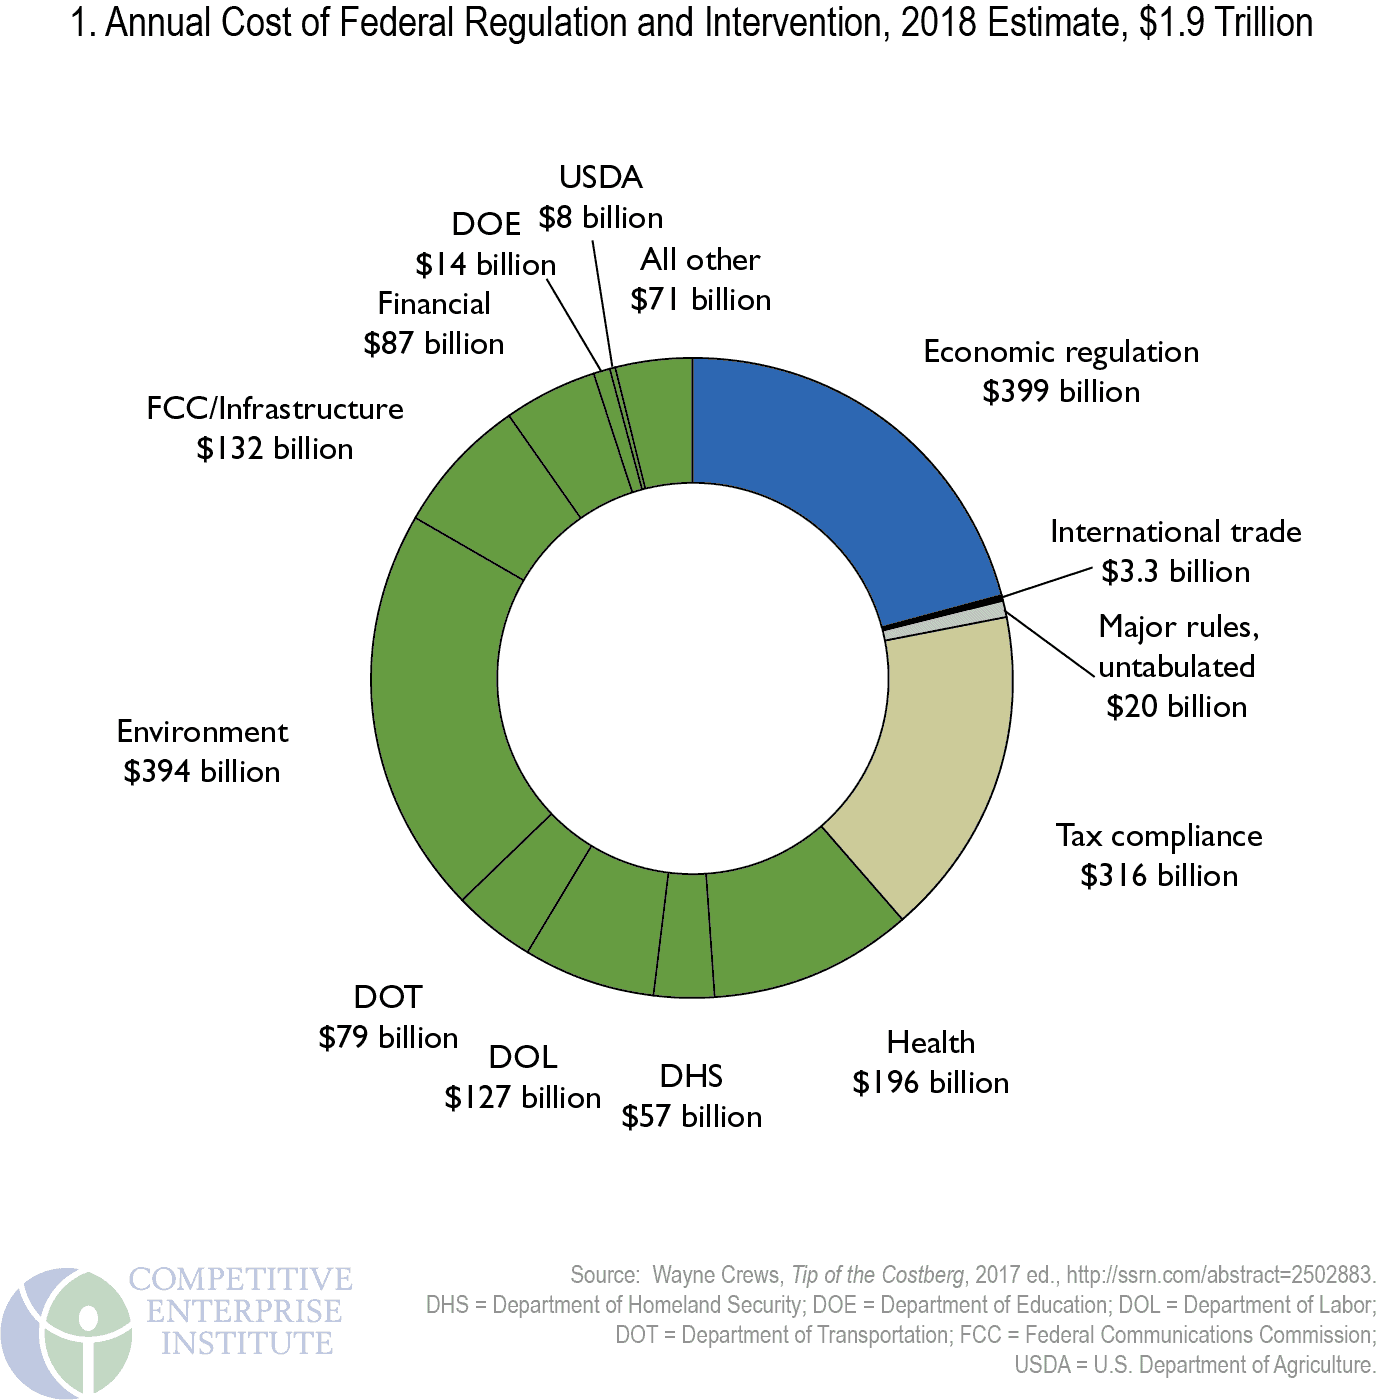
Costs of regulation and intervention can never be fully known, but using these sources, this report employs a baseline estimate for acrossthe-board federal regulatory costs of $1.9 trillion annually (see Figure 1).
Costs of regulation and intervention can never be fully known, but using these sources, this report employs a baseline estimate for across-theboard federal regulatory costs of $1.9 trillion annually.
Regulatory Costs Compared to Federal Spending and the Deficit
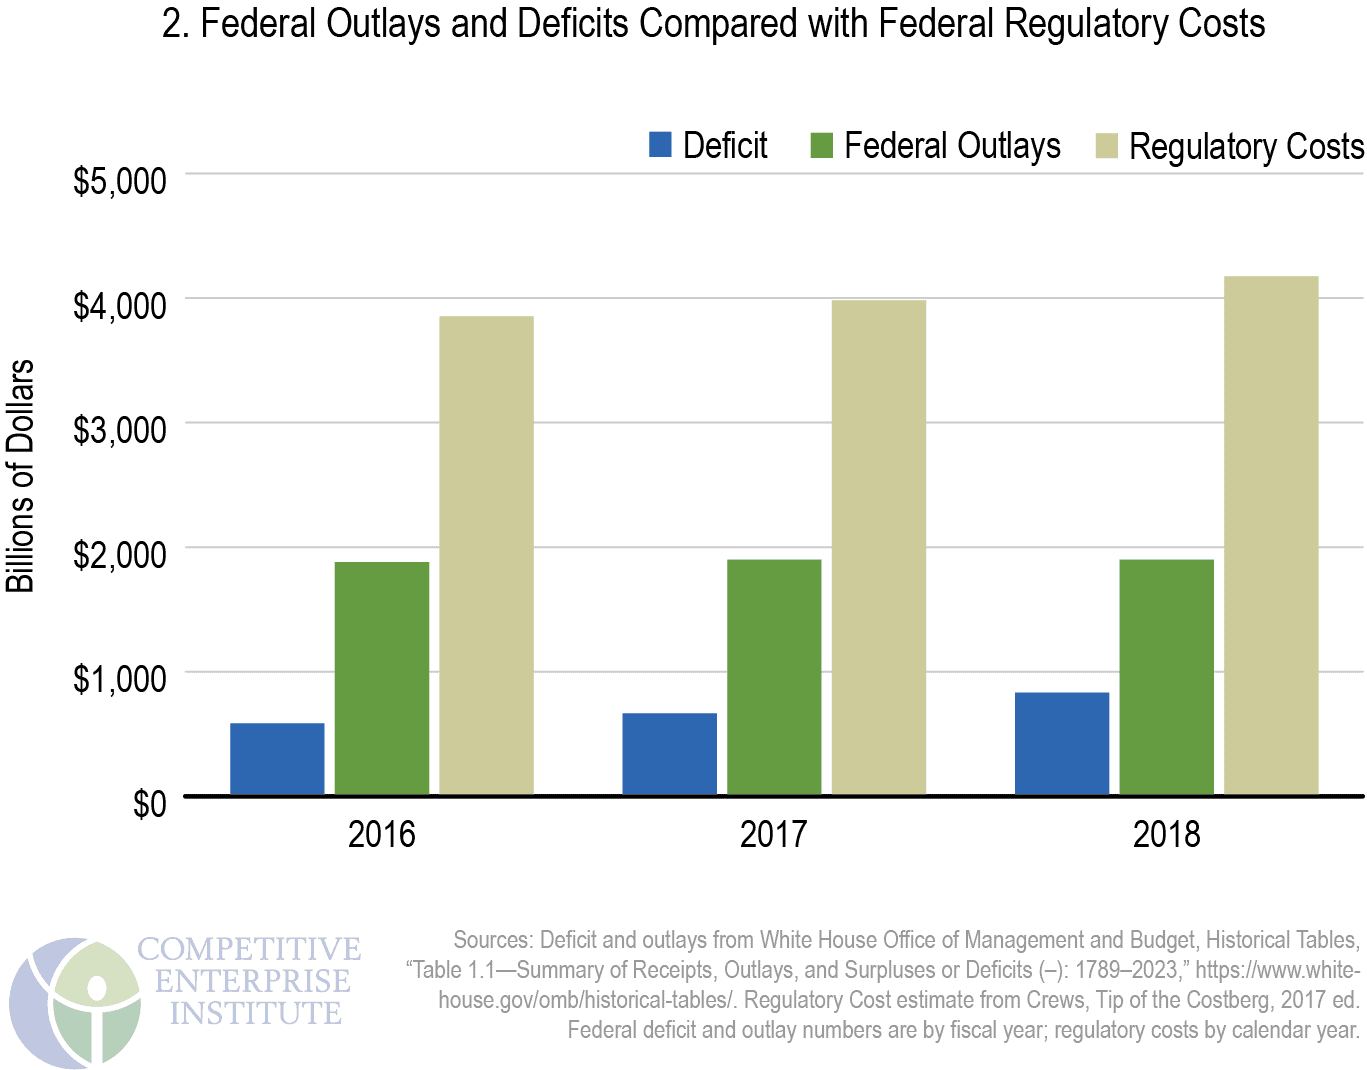
Comparisons of regulation with the costs of federal taxation and spending help place the magnitudes in perspective. The U.S. government reached $3.982 trillion in federal outlays and a deficit of $665 billion in FY 2017. Figure 2 compares deficits and outlays for 2016–2017 and projected amounts for 2018 with our regulatory and intervention burden figure of $1.9 trillion. For 2018, estimated costs of regulatory compliance and intervention are equivalent to nearly half the projected level of fiscal budget outlays of $4.1 trillion, and over twice the anticipated deficit, expected to soar to $804 billion. (Regulation had been almost triple the more “modest” earlier deficits in the $600-billion range.)
Regulatory Costs Compared to Income Taxes and Corporate Profits
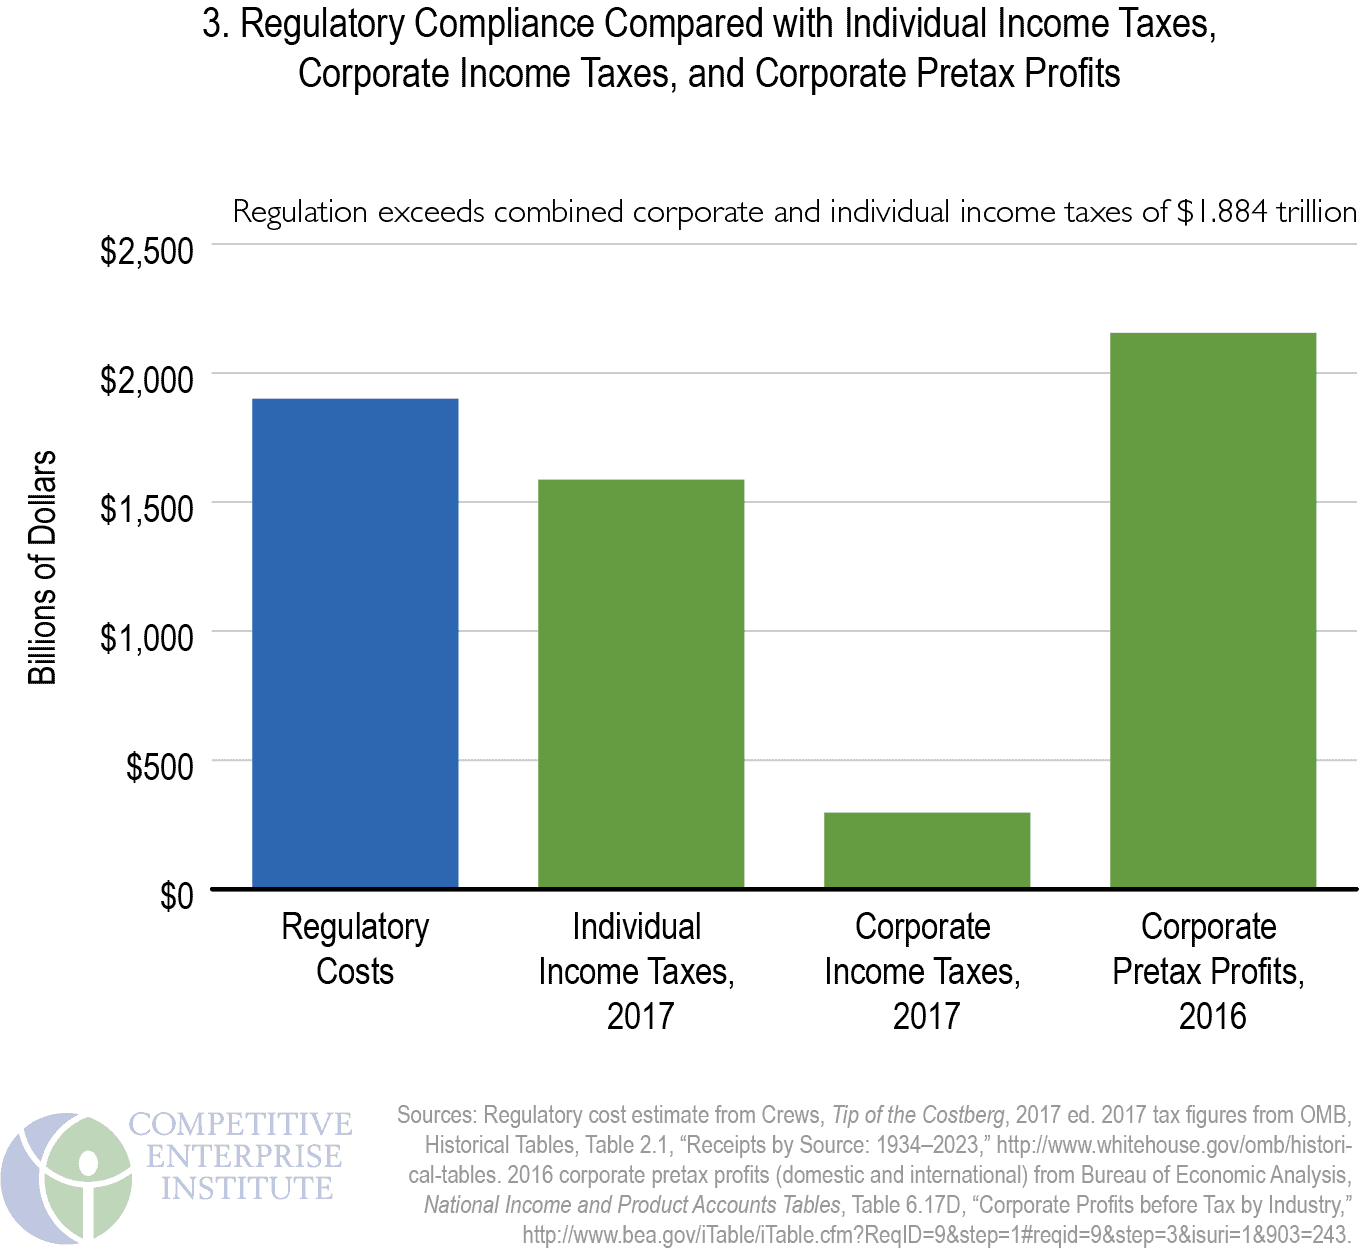
Regulatory costs easily rival revenues from individual income taxes and corporate taxes combined. As Figure 3 shows, regulatory costs stand well above 2017 individual income tax revenues of $1.587 trillion (individual income tax receipts fell substantially during the 2009 economic downturn but are rising again and have reached record levels). Corporate income taxes collected by the U.S. government—$297 billion for 2017—are dwarfed by regulatory costs (corporate tax receipts had declined more than half in 2009 during the downturn).90 The
combination of the two, $1.88 trillion, is roughly equivalent to our regulatory cost estimate of $1.9 trillion. Regulatory costs even approach the level of pretax corporate profits, which were $2.156 trillion in 2016.
Regulatory Costs Compared to GDP
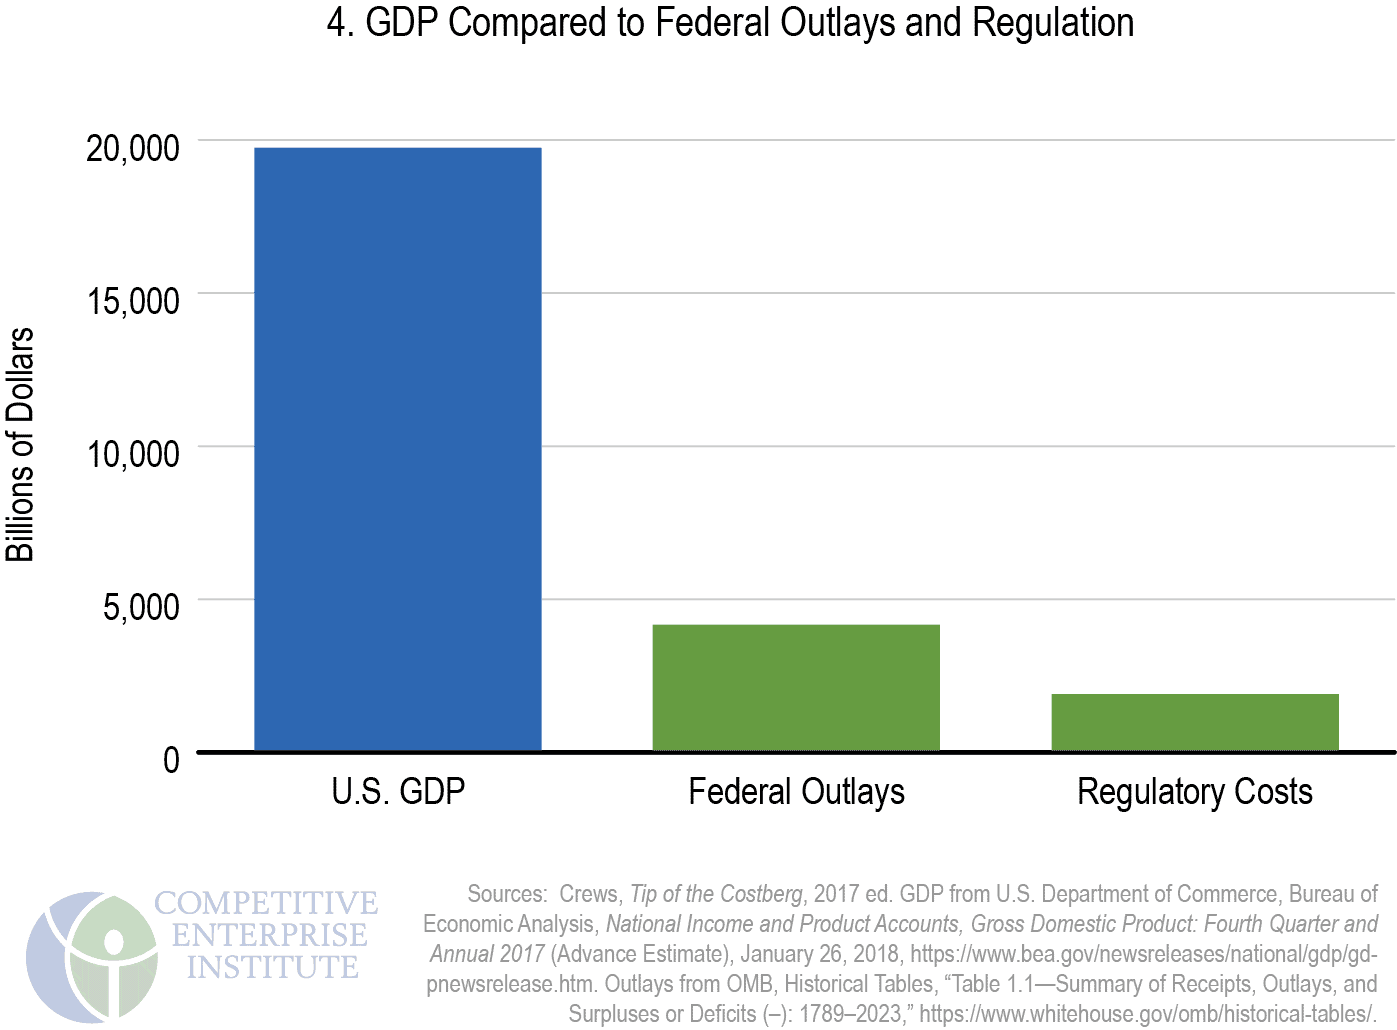
In January 2018, the Commerce Department’s Bureau of Economic Analysis estimated U.S. GDP for 2017 at $19.738 trillion.92 The total regulatory cost figure of $1.9 trillion annually is equivalent to approximately 10 percent of that amount.
Combining regulatory costs with federal FY 2018 projected outlays of $4.1 trillion (see Figure 2), the federal government’s share of the economy reaches $6.07 trillion, or 31 percent of GDP (see Figure 4). That does not include state and local spending and regulation.
The percentage has been 30 percent for some time.
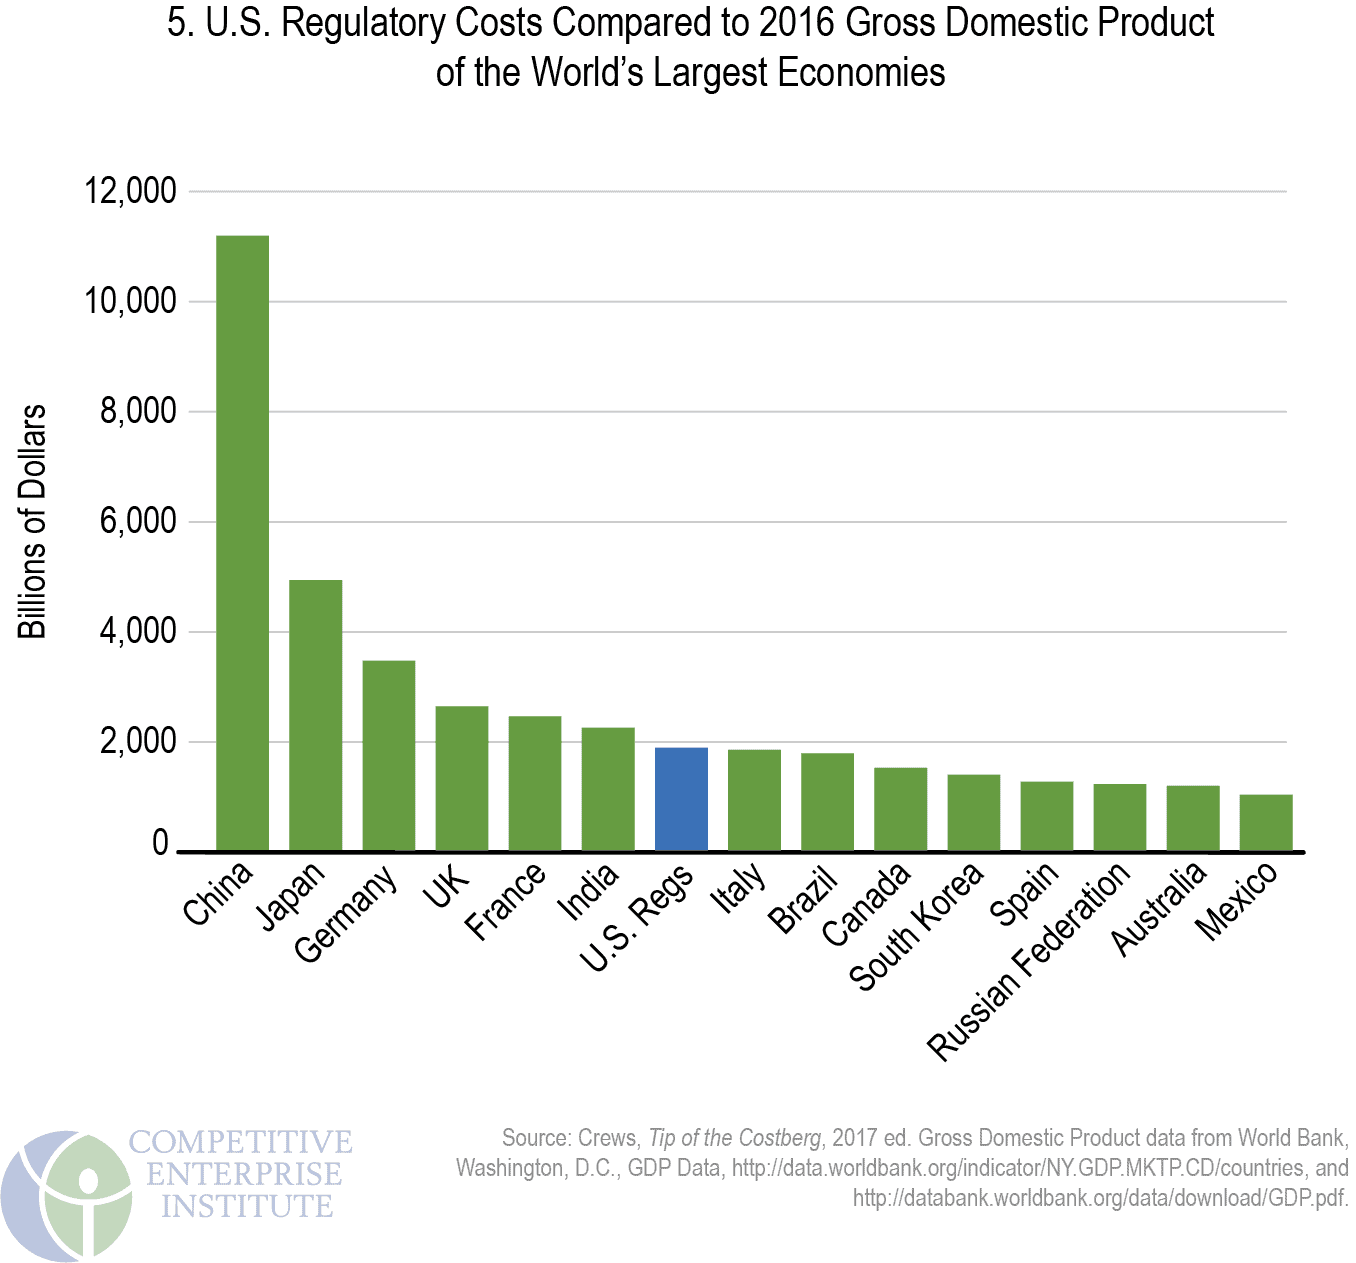
Not counting the United States, only six countries have GDPs that exceed the cost burden of U.S. regulation. U.S. regulatory costs surpass the 2016 GDP of neighbors Canada, at $1.53 trillion, and Mexico, at $1.047 trillion.
If U.S. regulatory costs of $1.9 trillion were a country, it would be the world’s eighthlargest economy, ranking behind India and ahead of Italy (see Figure 5).
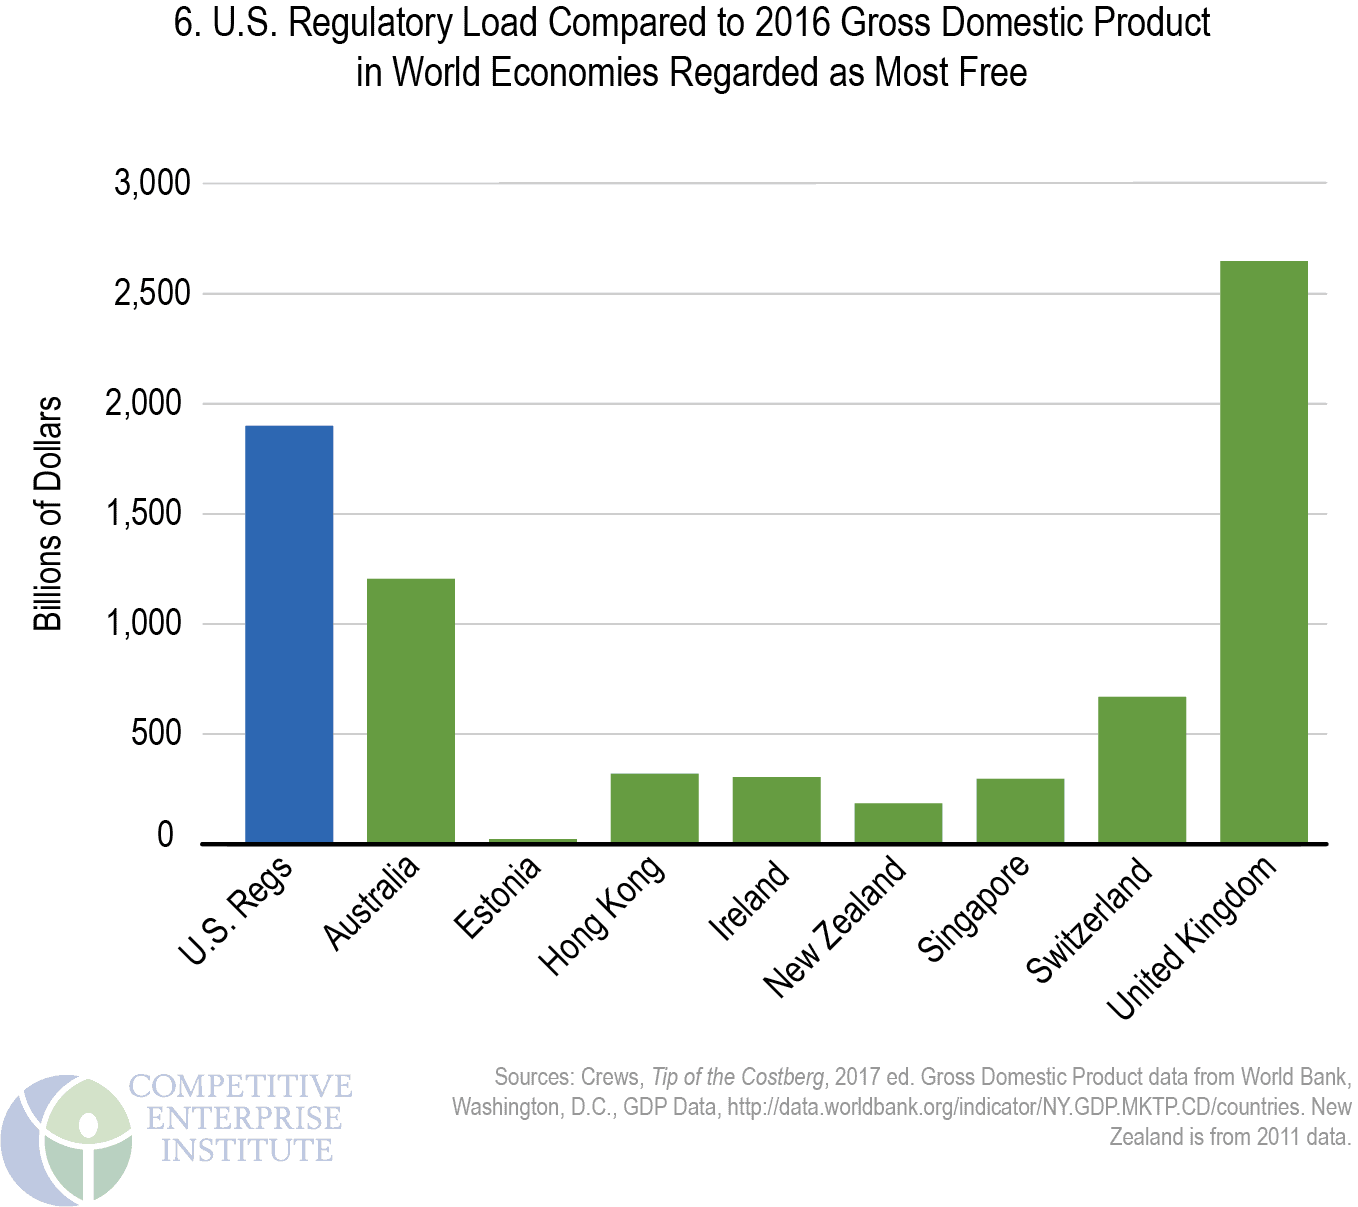
U.S. regulatory costs of $1.9 trillion easily exceed the output of many of the world’s major economies, including those (with the exception of the United Kingdom) ranked as the freest economically by two prominent annual surveys of global economic freedom.
Figure 6 depicts the GDP’s of the countries common to the top 10 in both the Heritage Foundation/Wall Street Journal Index of Economic Freedom, and the Fraser Institute/Cato Institute Economic Freedom of the World report. The U.S. ranks 18th and 11th on these reports, respectively.
If it were an “economy,” U.S. regulations would be the seventh largest. U.S. 2016 GDP of $18.624 trillion per World Bank is not shown.
Regulation: A Hidden Tax on the Family Budget
Like the taxes they are required to pay, businesses will pass some regulatory costs on to consumers. Other costs will find their way to workers and investors in regulated companies.
By assuming a full pass-through of all such costs to consumers—many consumers are also workers and owners through stock and mutual fund holdings—we can look at the share of each household’s regulatory costs and compare it with total annual expenditures as compiled by the Department of Labor’s Bureau of Labor Statistics (BLS).95
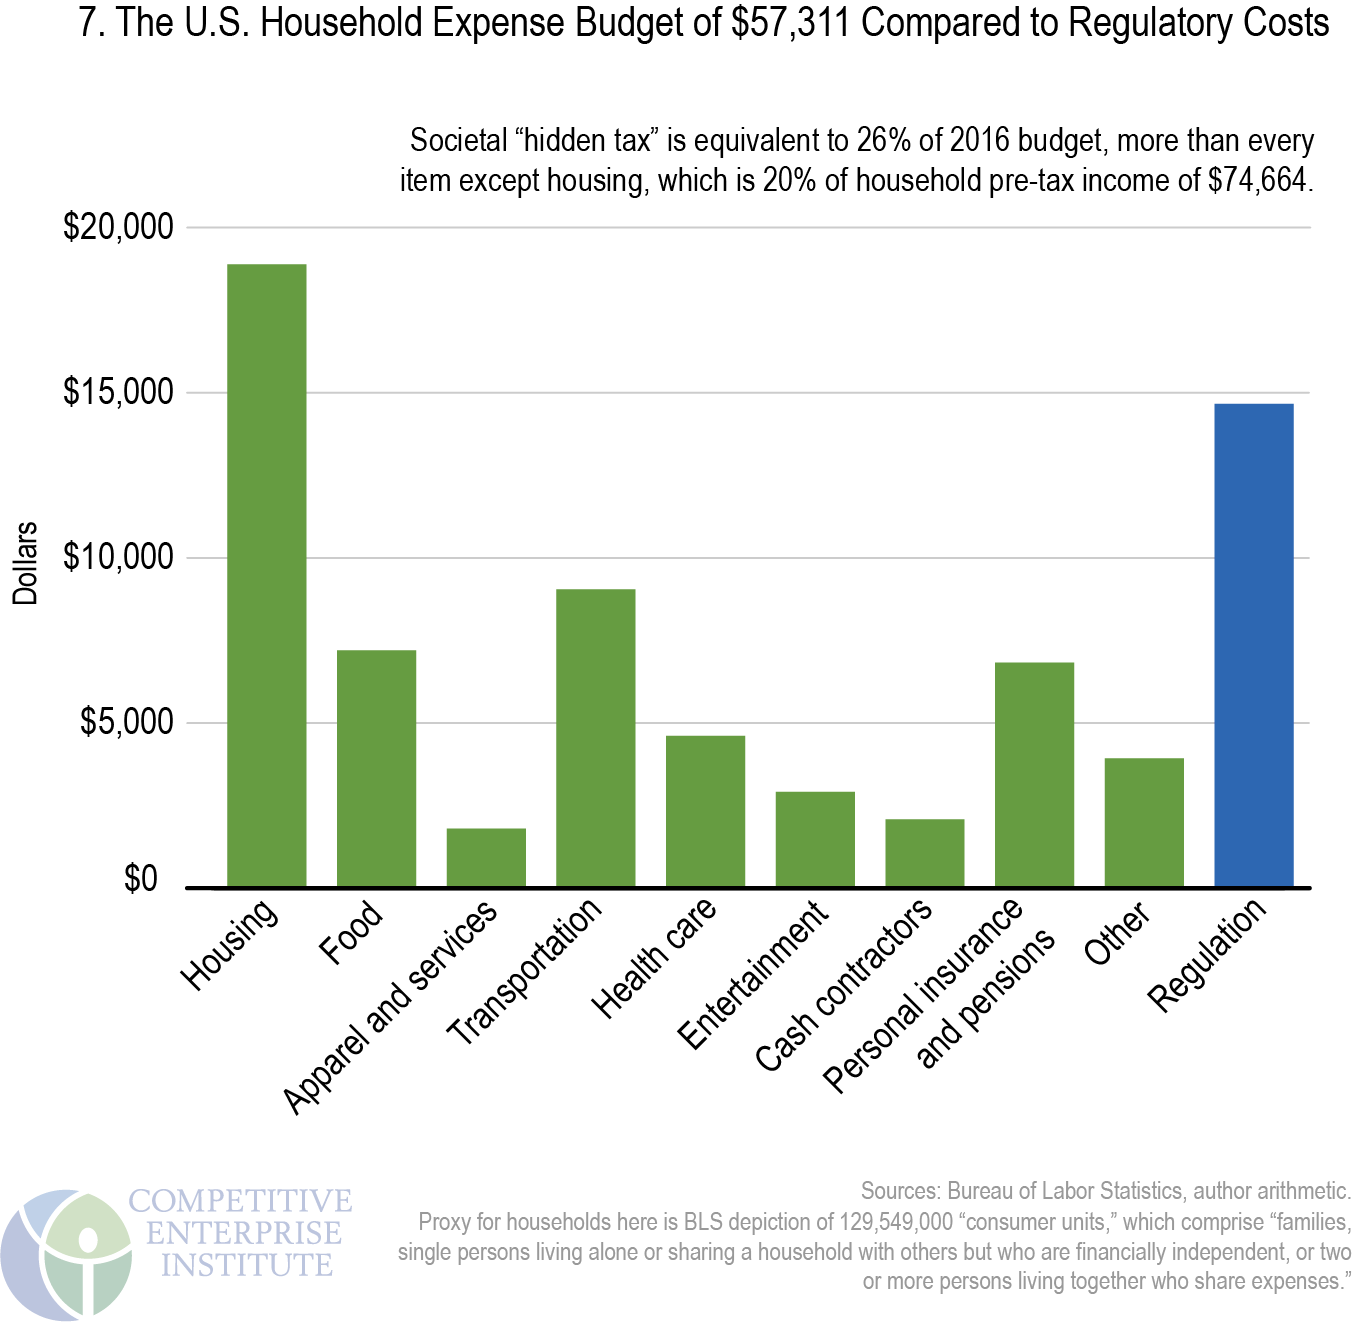
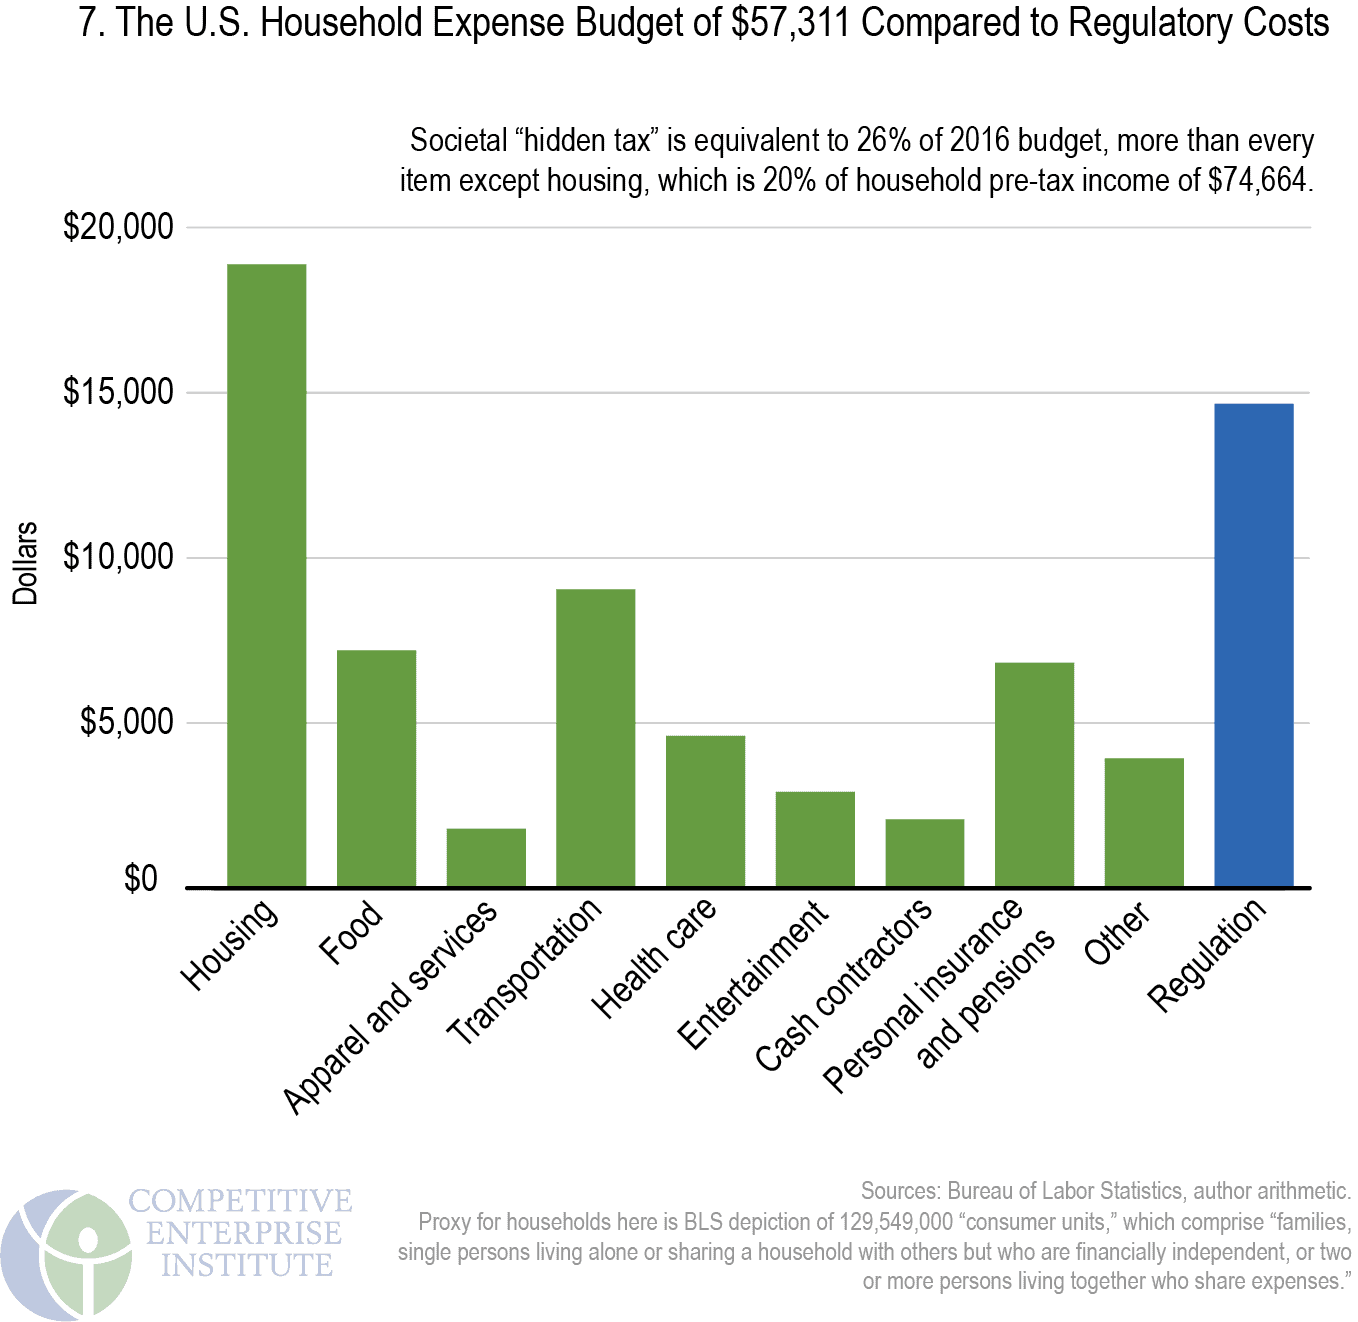
For America’s 129.5 million households, or “consumer units” in BLS parlance, the average 2016 pretax income was $74,664.96 If one were to allocate annual regulatory costs, assuming for simplicity’s sake a full passthrough of costs to consumers, U.S. households “pay” $14,666 annually in embedded regulatory or intervention costs ($1.9 trillion in regulation divided by 129.5 million “consumer units”), or 20 percent of average income before taxes. The percentage is higher as a share of after-tax income. As Figure 7 shows, the regulatory “hidden tax” is higher than every annual household budgetary expenditure item except housing. Regulatory costs amount to up to 26 percent of the typical household’s expenditure budget of $57,311. More is “spent” on embedded or hidden regulation in society than on items like health care, food, transportation, entertainment, apparel, services, and savings (see Figure 7).
Of course, some costs of regulation are not hidden. Consumers pay for regulatory agencies more directly through taxes.
The Administrative and Enforcement Costs of Regulation
Regulatory cost estimates attempt to capture costs experienced by the public, but those estimates do not include administrative costs—the on-budget amounts spent by federal agencies to produce and enforce rules. The Weidenbaum Center at Washington University in St. Louis and the George Washington University Regulatory Studies Center regularly examine the president’s annual budget proposal to compile the administrative costs of developing and enforcing rules. These amounts—as funds that taxpayers contribute to support agencies’ administrative operations—are disclosed in the federal budget.
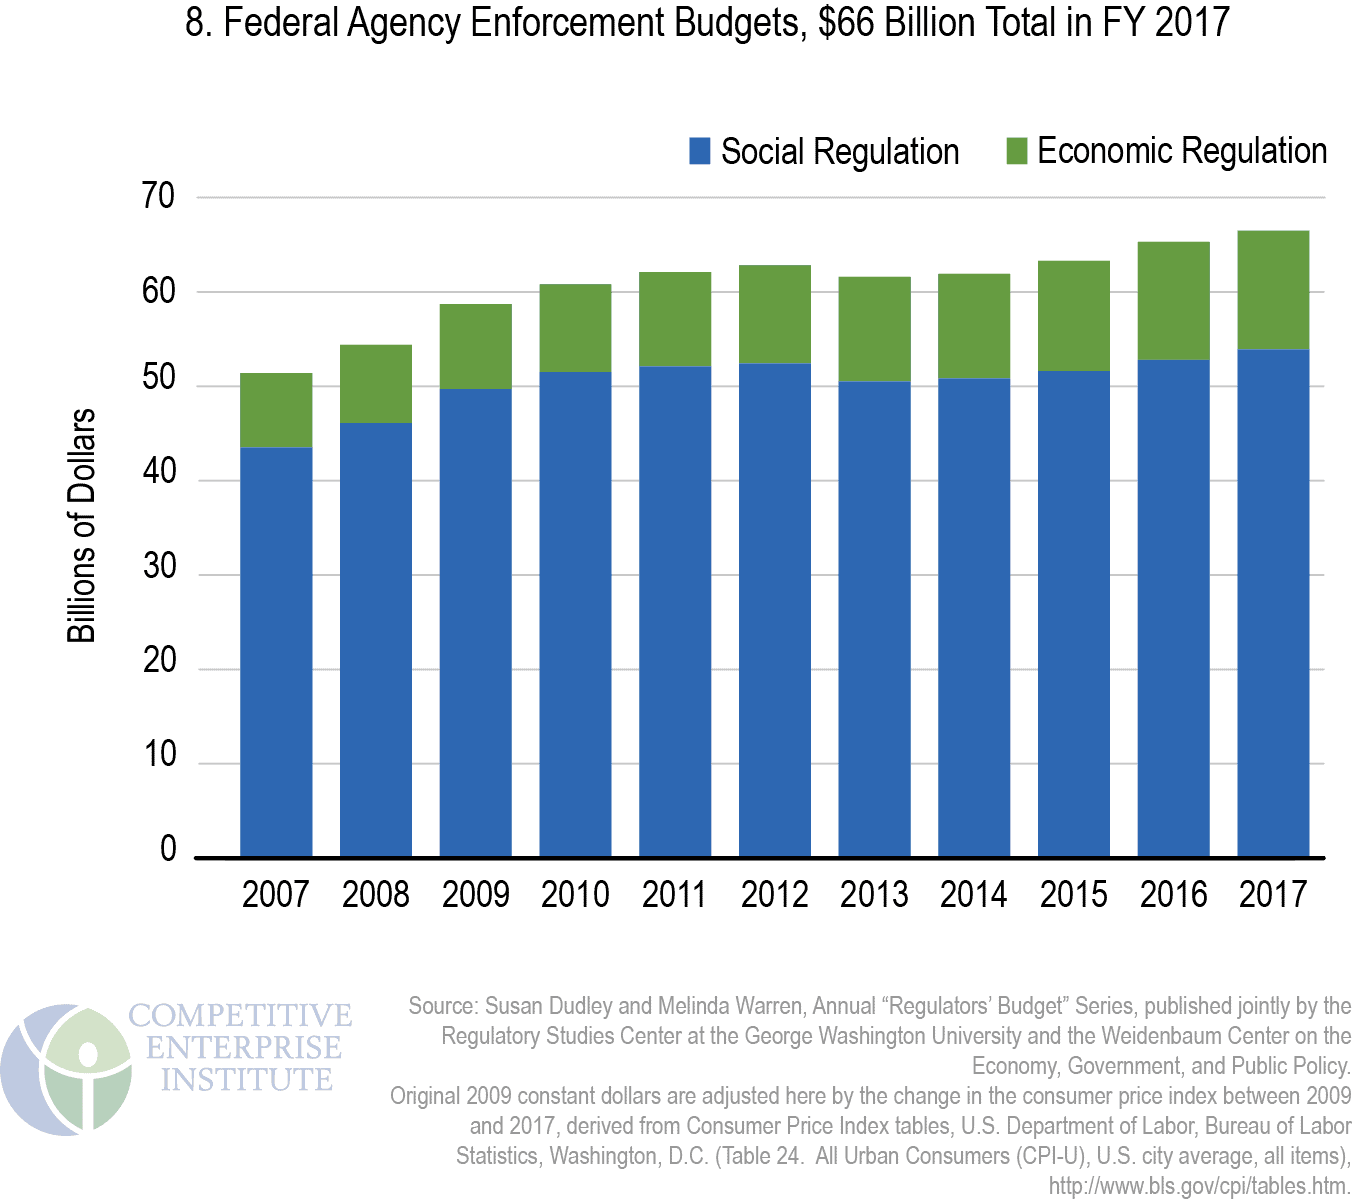
According to these estimates, FY 2017 enforcement costs incurred by federal departments and agencies stood at $66.5 billion (in constant 2017 dollars, adjusted from original 2009 dollars) (Figure 8). Of that amount, $12.6 billion was incurred administering economic regulations. The larger amount, spent on writing and enforcing social and environmental regulations, was $53.9 billion.
The $66 billion in regulatory agency enforcement costs helps complete a picture of the federal regulatory apparatus, as these come on top of other estimates of regulatory compliance and economic burdens.
In current dollars, the EPA alone spent an estimated $5.465 billion in this category in 2017, accounting for 8 percent of the total expected to be spent by all regulatory
agencies. The EPA formerly accounted for the lion’s share of governmental administration and enforcement costs, but the Department of Homeland Security (DHS), at an estimated $29.6 billion, now makes up 45 percent.
The Weidenbaum Center and the Regulatory Studies Center also estimate the number of full-time-equivalent administrative and enforcement staff at 281,300 in FY 2017, up from 277,099 in 2016.
The number of federal employees has increased well over 100,000 since the 2001 staffing level of 173,057.99 Much of the post-2001 surge may be attributable to the then newly created Transportation Security Administration’s hiring of thousands of airport screening personnel.
Costs are one way to attempt to capture the size and scope of the federal regulatory enterprise, which is indeed massive. Another is to assess the paper production—the regulatory material that agencies issue each year in publications like the Federal Register.
Read Chapter 4 – Thousands of Pages and Rules in the Federal Register