Federally Commissioned Climate Report Defies Reality

Photo Credit: Getty
Earlier this month, The New York Times reported at length about an ominous report on climate change that was commissioned by the Commodities Futures Trading Commission (CFTC), titled “Managing Climate Risks in the Financial System.”
While it has not been endorsed by the full Commission, it is remarkable in its scope and detail, and any innocent reader would conclude that climate change is horrible and already wreaking havoc. In fact, it concludes:
This report has argued that the physical impacts of climate change are already affecting the United States, and over time, will likely touch virtually every sector and region of the country.
The operative, testable words are that “the physical impacts of climate change are already affecting the United States.” As Einstein said, “a single experiment can prove me wrong.” Is that experiment out there already?
Long-term records (the accuracy of which may be debatable) indicate that the surface temperature of the planet has risen about one degree (C) since 1900 as a result of two periods of warming, one beginning around 1910 and ending around 1945, and a second one that began around 1976.
Dr. Roger Pielke, Jr. of the University of Colorado has run the single experiment. He used North American GDP figures supplied by the United Nations (U.N.) and local data from the Office of Management and Budget, along with annual weather-related damages reported by the insurance industry groups that pay attention to weather catastrophes. Those would be the big reinsurance firms of Munich Re and AON. Here’s a plot of annual damages in North America, beginning in 1990, when Munich Re says data becomes reliable:
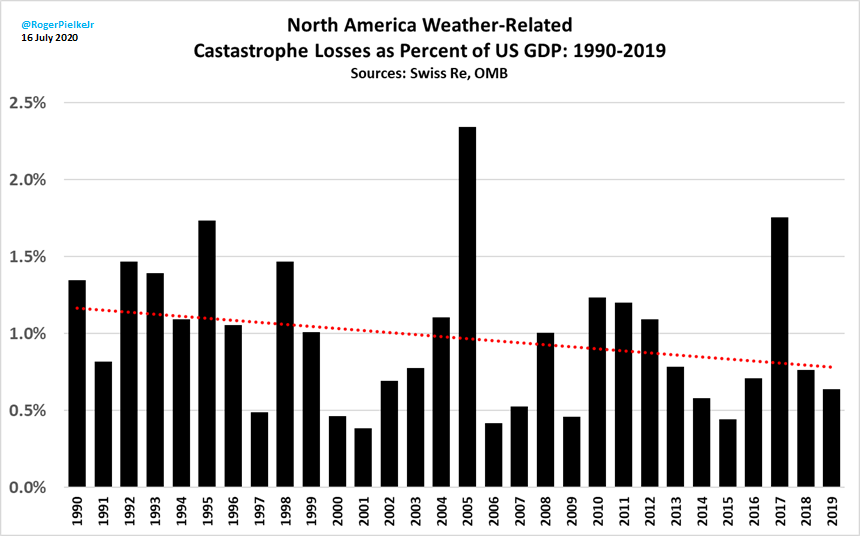
Figure 1. Weather-related catastrophe losses as percent of GDP in North America, 1990-present. Courtesy of Roger Pielke, Jr., University of Colorado
There is a non-significant downward trend in damages over time. But a search of the entire 166-page CFTC document, including the references, doesn’t uncover the word “Pielke” even once.
The CFTC team can cite all the minutiae they want (the references take up dozens of pages), but they ignore the critical big picture, which is that in an era of warming, weather-related damages as a percent of GDP in the U.S. show no global temperature-related signal whatsoever. In a serparate study (not shown here) Pielke also found global behavior to be very similar to what is happening in North America.
The CFTC report repeats the tired old saw that warming is reducing food production. The CFTC committee apparently believes in the “dumb farmer” concept: The notion that as climate changes—which it always does—farmers will just sit around and go bankrupt, or that seed companies have no incentive to select and genetically engineer heat-tolerant varieties.
Obviously, none of the committee members are on Burpee’s catalog list, where you can purchase the tomato variety Heatwave II, designed to set more fruit as temperatures rise.
They also seem oblivious to the fact that there are crops that would prefer it to be quite a bit hotter than it is now. Grain sorghum is nutritionally similar to corn, but it thrives in hotter agricultural regions, as does sugar cane. As things warm up, why wouldn’t farmers substitute sorghum for corn, and why wouldn’t industry—including big millers like Cargill, which was represented on the committee—process sorghum into the same range of products that they now derive from corn?
Here is a typical outtake from the CFTC report that is just as testable as the notion of increasing overall weather-related damages:
One study projects that each degree-Celsius increase in global mean temperature could, on average, reduce global yields of wheat by 6 percent; rice by 3.2 percent; maize [corn] by 7.4 percent; and, soybeans by 3.1 percent (Zhao, et al., 2017).
The CFTC is stating “facts” that are indeed testable hypotheses. The crop that takes the biggest hit per degree Celsius of warming is corn, at 7.4 percent. The 0.6⁰C rise in global temperature in recent decades should therefore have depressed yields by 4.4 percent. There is simply no evidence for this, as shown in Figure 2.
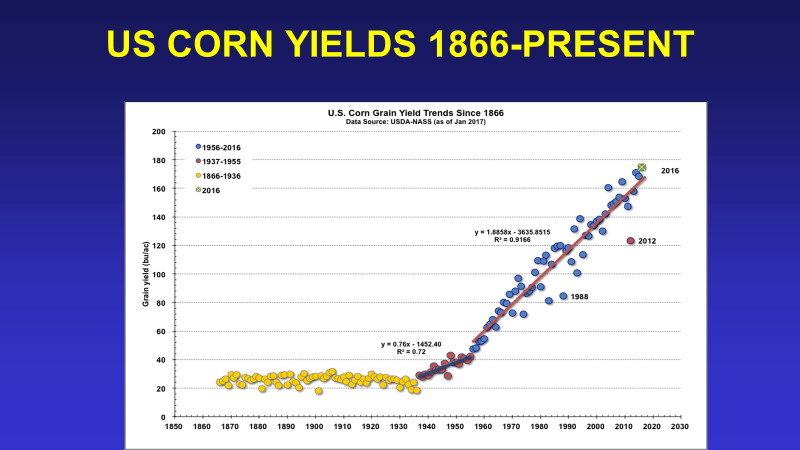
Figure 2. U.S. Corn yields since 1866. The rise since World War II has been at a constant rate, as it has for other major crops.
There are two periods of warming since 1900, both at similar rates. In the first, from 1910 to 1945, there is no effect on yields, as they remained constant until the late 1930s. The second warming begins in 1976 and there is no evidence that the linear increase in yields that was initiated at the end of World War II was at all affected.
The principal determinant of increasing crop yields is technological input. The rise that starts in 1937 on this graph is due in large part to the adoption of double-cross hybrid corn, and the great linear increase after 1945 is largely related to the increased application of nitrogen fertilizer, which was manufactured as a direct spinoff of the TNT (tri nitro toluene) industry that fueled the conventional weapons of World War II.
Along with the increase in fertilizer application, yields have been increased by mechanical improvements as well as changes in tillage practices, such as no-till agriculture, and genetic modification, such as the development of the herbicide glyphosate (Roundup) resistant cultivars, and varieties that manufacture their own insecticides.
Why the increases in yield have been at such a constant rate since 1945 is unclear, but linear yield increases occur in all the major crops, as shown in the figures below. The mystery is why the adoption of the transgenic hybrids didn’t change the ongoing linear changes in yields. A brief, informative essay on the history of corn yields from the 19th century to the present has recently been updated by Bob Nielsen of the Agronomy department at Purdue.
(I have consulted with several mathematical and economic experts as to why the various factors that would increase yields invariably sum up to a constant rate of increase and have yet to find a satisfactory answer.)
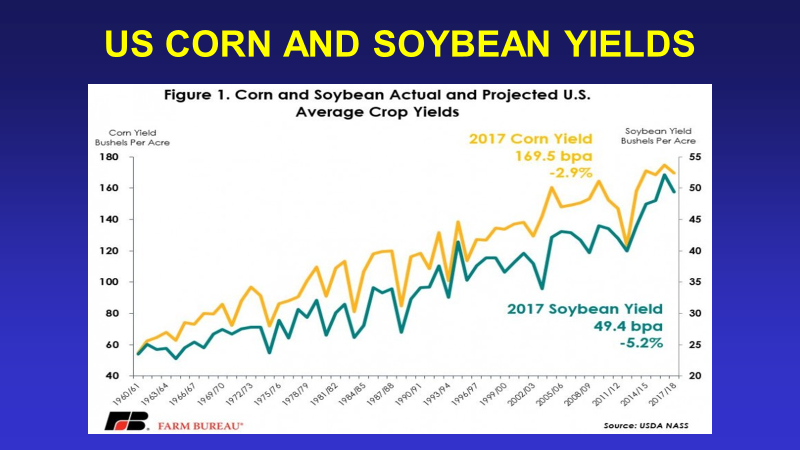
Figure 3. Corn and Soybean yields since 1960 (top) and wheat yield since 1866 (bottom) All the major crops show constant (linear) increases since 1945. Why wheat and corn behave so similarly over time is a mystery, as the development of high-yielding wheat varieties lagged the corn improvements by approximately 40 years.
It is apparent that yields continue their constant linear increases across them major crops. What about production? Yield is the amount harvested per acre or hectare, and production is simply the amount. It’s worth looking at worldwide production of the four major crops since 1980 as reported by the U.N.’s Food and Agriculture Organization.
Note that the second warming of the 20th century began in the late 1970s, so the period shown is one in which there should be negative pressure on yields that just doesn’t seem to appear. What happened to production?
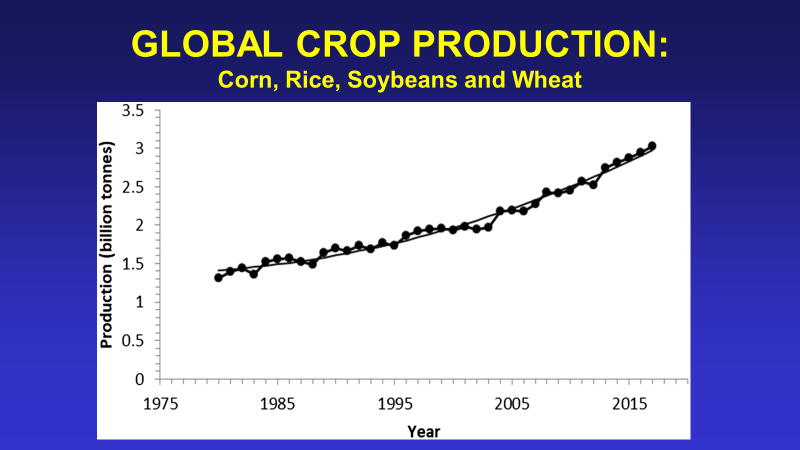
Figure 4. Despite linear increases in yields, production of the world’s major crops is increasing in an exponential fashion. The parabolic fit explains 99 percent of the year-to-year variation in production.
The increase in production is exponential. And the deviations from the smooth exponent are vanishingly small. Given the worldwide linear increases in yield, this can only mean that, on net, growing areas must be expanding (despite the fact that they have contracted in the U.S. as eastern lands have largely reverted from agriculture to forests).
In summary, when it comes to the hot-button issue of climate change, agriculture, and food, the CFTC report is bunkum, just as it is for weather-related disaster costs.
The alarmist nature of the report may owe to its 35 authors, most of whom seem have some vested interest in pushing the issue. The most represented groups are big investment firms, including Morgan Stanley, Allianz, and JP Morgan Chase, as well as academic and think-tank scientists and economists, all of whom are labeled as “special government employee[s].” (How that could possibly apply to a policy director at the Brookings Institution, Adele Morris, seems like art imitating life.)
Perhaps this is just another questionable forecast of the upcoming election. According to the September 9 New York Times article by global warming beat writer Coral Davenport and economic writer Jeanna Smialek:
Some of the authors of the report acknowledged that if Mr. Trump is re-elected, his administration is all but certain to ignore the report and its recommendations.
Instead they saw the document as a policy road map for a Joseph R. Biden administration.
This seems rather obvious. While the report makes dozens of explicit policy recommendations, first and foremost is this one:
Recommendation 1: The United States should establish a price on carbon. It must be fair, economy-wide, and effective in reducing emissions consistent with the Paris Agreement. This is the single most important step to manage climate risk and drive the appropriate allocation of capital.
It could have been stated a bit more succinctly: “We want a carbon tax.”