The Endangerment Finding’s disqualifying systemic biases, part 1

Photo Credit: Getty
On August 1, 2025, the Environmental Protection Agency (EPA) proposed to repeal its December 2009 Greenhouse Gas Endangerment Finding. In the Endangerment Finding, the Obama-era EPA determined that greenhouse gas (GHG) emissions from new cars and light trucks “cause or contribute to air pollution which may reasonably be anticipated to endanger public health or welfare.” That conclusion triggered the first-ever GHG emission standards for new motor vehicles, finalized in May 2010.
More importantly, the Endangerment Finding launched an era of climate-centric regulations culminating in President Biden’s “whole-of-government approach to the climate crisis.” The Biden White House pressured all agencies to implement GHG emission reduction policies, even those with no discernible authority over energy or environmental policy, such as the Securities and Exhange Commission. It even tried to transform the Council on Environmental Quality (CEQ) into a national industrial policy czar for climate and infrastructure. Fortunately, the DC Circuit Court of Appeals ruled that CEQ lacks statutory authority to issue binding regulations.
Litigation over the EPA’s final Endangerment Finding repeal rule will undoubtedly be fierce, for various reasons:
- Repealing the Endangerment Finding will scrap the foundational legal and scientific justifications for the entire climate regulatory complex put in place by the Obama and Biden administrations.
- The repeal rule will also expressly rescind the EPA’s April 2024 de facto electric vehicle mandates, which effectively implements about 70 percent of the California gas-car ban that Congress overturned in June.
- A future progressive administration would have to reinstate the Endangerment Finding before it can make credible emission-reduction pledges under the Paris Climate Accords.
Legal arguments occupy most of the 78-page repeal rule. A brief section also provides a “climate science discussion.” That section frequently cites A Critical Review of Impacts of Greenhouse Gas Emissions on the U.S. Climate, a July 2025 draft report commissioned by the Department of Energy (DOE).
In a two–part essay on Watts Up With That, I rebut two Politico articles that attempt to undermine the repeal proposal by discrediting the DOE climate science report it references. I conclude that Politico’s criticisms either misfire or backfire, and none invalidate any of the DOE report’s conclusions. More critically, the Politico articles ignore—or hide—the Endangerment Finding’s disqualifying methodological biases.
For decades, official climate impact assessments, from the UN Intergovernmental Panel on Climate Change (IPCC) to the US Global Change Research Program (USGCRP), have run overheated models with inflated emission scenarios and downplayed humanity’s capacity for adaptation. This biased methodology exaggerates both the physical effects of GHG emissions and their harmfulness.
These biases compromise the major assessment reports informing the 2009 Endangerment Finding as well as later updates. However, studies exposing the reliance on warm-biased models and emission scenarios mostly examined these later assessments. Accordingly, the following sections proceed in somewhat reverse chronological order.
Warm-biased models
To project the physical effects of climate change, the IPCC and USGCRP use climate models—computer simulations of the global climate system—“forced” with various GHG emission scenarios. The IPCC works with climate modeling groups worldwide through the Coupled Model Intercomparison Project (CMIP). There have been six CMIPs, the first one in 1996.
CMIP models project global annual temperature trends (and related climate metrics) through 2100 and beyond. While the accuracy of these projections can’t be tested, temperature changes over recent decades can be hindcasted and compared to observations. Atmospheric scientist John Christy and colleagues have conducted such analyses since the early 2000s.
The IPCC’s 2013 Fifth Assessment Report (AR5) and USGCRP’s 2017 Fourth National Climate Assessment (NCA4) relied on the CMIP5 model ensemble. The chart below shows that the CMIP5 models on average projected over twice the observed warming in the tropical mid-troposphere from 1979-2016, based on data from satellites, balloons, and re-analyses.
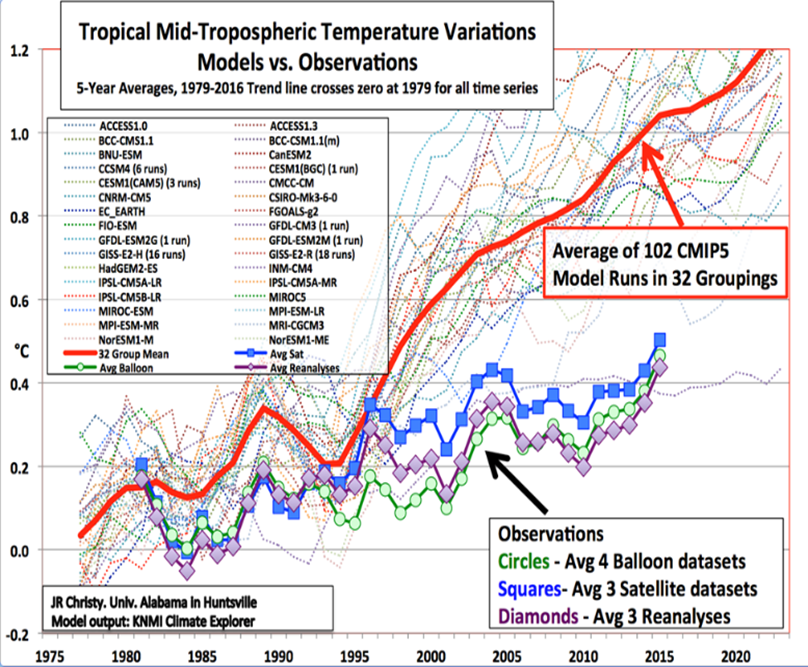
The next chart compares the projections of 25 CMIP5 models to weather balloon observations in the tropical troposphere during 1979-2018.
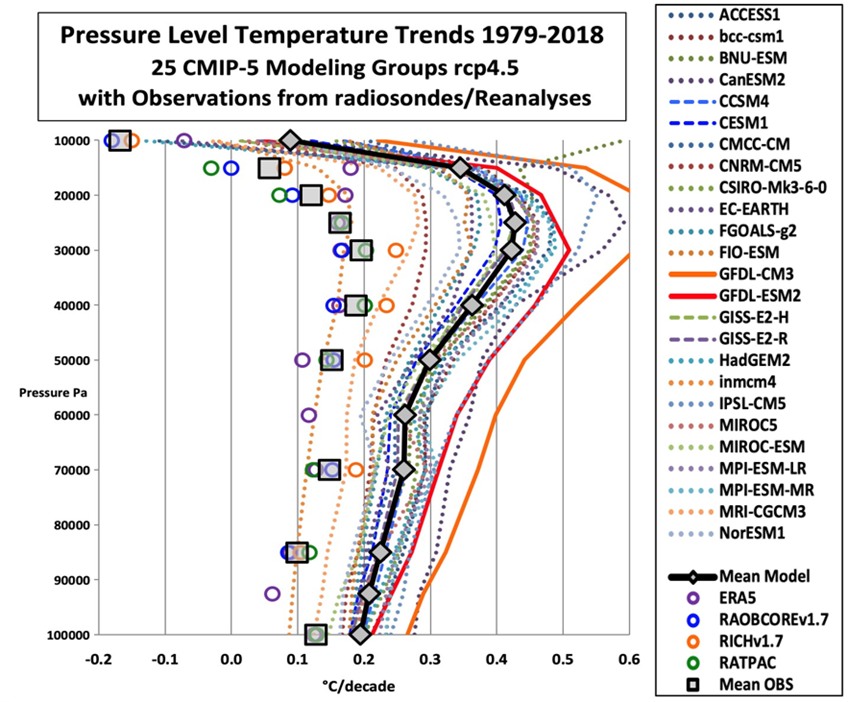
Only one model, the Russian INMCM4 (left-most dotted line), accurately tracked temperature change through the depth of the tropical atmosphere. NOAA’s GFDL-CM3 (right-most solid line) is literally off the chart. The superior accuracy of INMCM4 and extreme inaccuracy of GFDL-CM3 likely reflects their respective equilibrium climate sensitivity (ECS) estimates, or the amount of warming that occurs after the climate system fully adjusts to a doubling of carbon dioxide-equivalent greenhouse gas concentration. INMCM4 has an ECS of 1.8°C versus 4.0°C (or higher) for GFDL-CM3.
Why focus on the tropical troposphere? After all, nobody lives there!
As DOE report authors Christy and environmental economist Ross McKitrick explain in a peer-reviewed study published in Earth and Space Science, the tropical mid-troposphere is uniquely suited for scientific testing of model validity. That is because: 1) nearly all models predict strong positive feedbacks (accelerated warming) in the tropical mid-troposphere; 2) it is well-monitored by satellites and weather balloons; 3) it is unaffected by land-use changes; and 4) the models were not previously “tuned” to match tropospheric temperatures, hence are independent of the data used to test them.
The last factor is key: models are “trained” to reproduce 20th century land and sea surface temperature records, so hindcasting surface data is almost like “peeking at the answers” before a quiz. Christy instead tests models on “out of sample” data not used to adjust model parameters. The results are clear: the CMIP5 models run too hot.
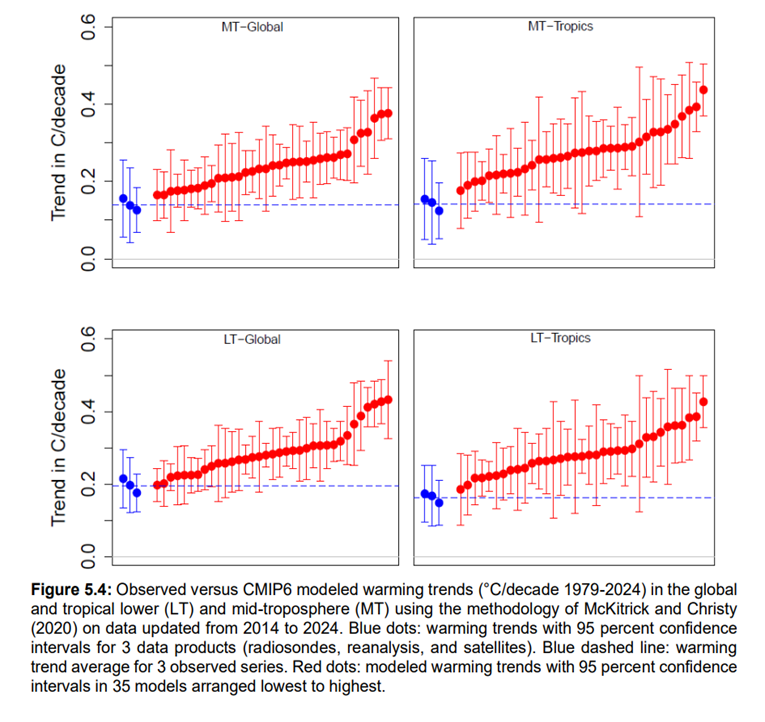
Are the CMIP6 models used in IPCC’s 2021 Sixth Assessment Report (AR6) more accurate? No. In the tropical mid-troposphere, all CMIP6 models run hotter than observations. Further, they overestimate warming worldwide, with projections running 1.49 times faster than observations in the lower troposphere and 1.74 times faster in the mid-troposphere.
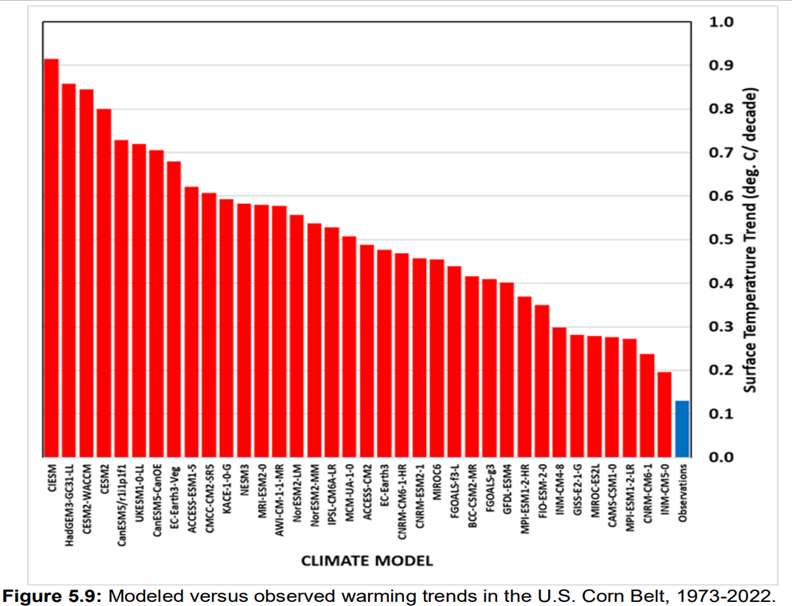
CMIP6 models also fail at another regional scale. The chart below compares 36 CMIP6 model hindcasts to observations during 1973-2022 for the US corn belt. All 36 models project significantly more warming than observed, with 30 models projecting two to eight times the observed warming rate.
The problem isn’t new. CMIP3 models informing the IPCC’s 2007 Fourth Assessment Report (AR4) and the 2009 Endangerment Finding also run too hot.
In the 2000s, modelers did not publish hindcasts of tropospheric data, but Christy compared the models’ surface temperature projections to the UK Hadley Center Climate Research Unit (HadCRUT) surface record and satellite troposphere data adjusted to match the surface record warming rate. The chart below shows observations (squares) all fall much below the AR4 model average (diamonds), usually about half the magnitude of the modeled trend.
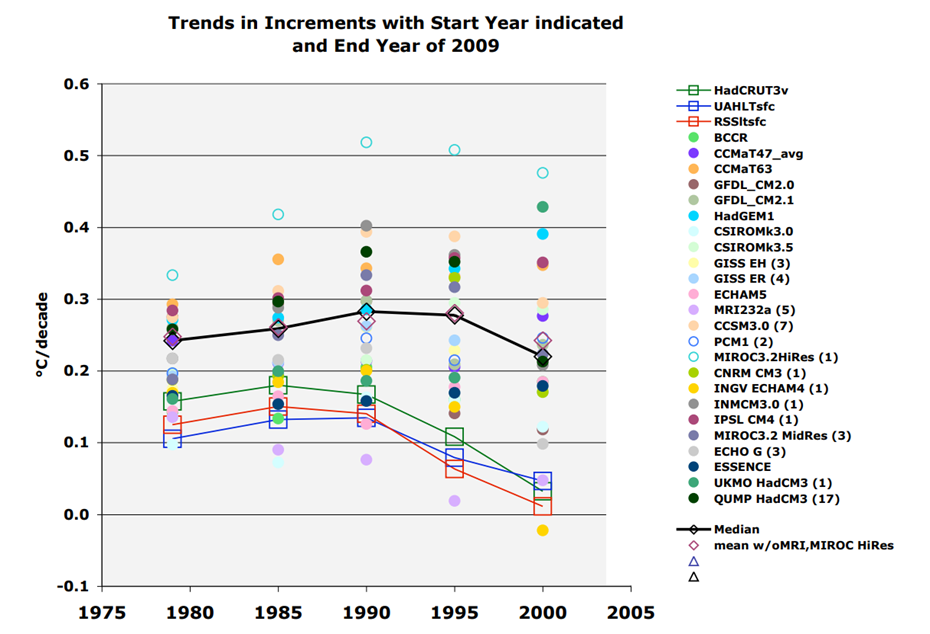
The Endangerment Finding’s Technical Support Document (TSD) evinces no awareness of the hot model problem. However, it made a case for the models’ realism based on their ability to reproduce 20th century land and sea-surface temperature changes when the models are run with both natural variability and anthropogenic GHG emissions. The chart below, reproduced in the TSD, comes from AR4.
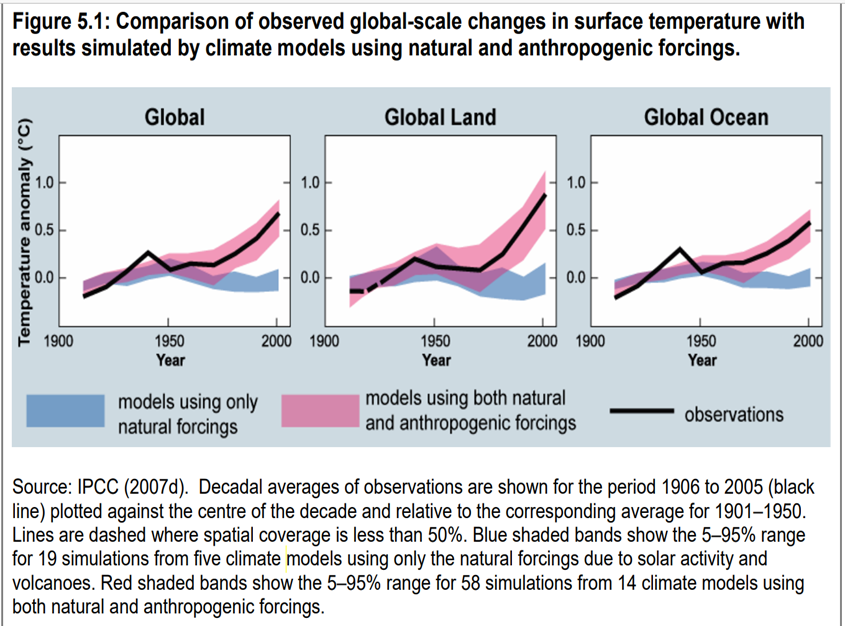
Again, climate models reproducing temperature histories on which they were trained is no guarantee of predictive skill.
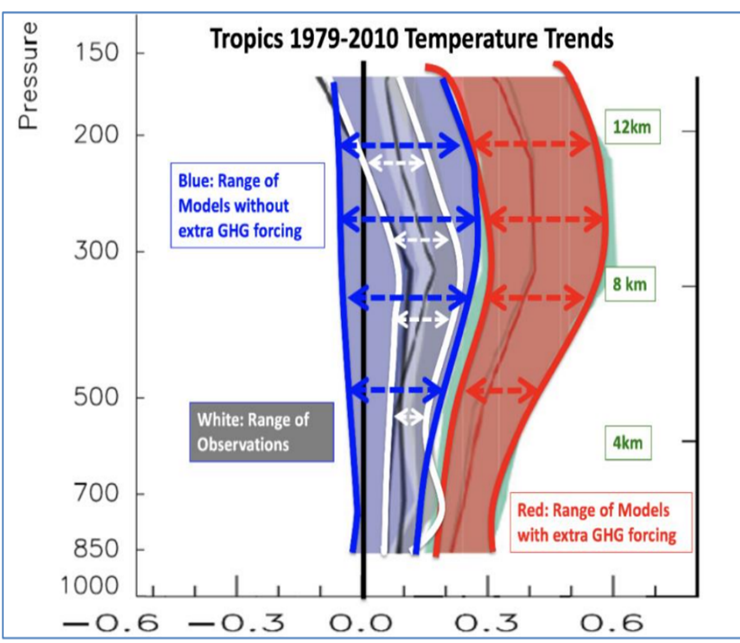
More importantly, Christy spotted a chart in an online supplement to AR5 that implicitly contradicts AR4’s realism narrative. It shows that, in the tropical troposphere, the range of model projections falls almost entirely outside the range of observations unless the models are run with natural variability alone.
Warm-biased emission scenarios
The IPCC and USGCRP run the CMIP models with multiple emission scenarios. However, the extreme scenarios—RCP8.5 in AR5 and the USGCRP’s 2017 Fourth National Climate Assessment (NCA4), and SSP5-8.5 in AR6 and the USGCRP’s 2023 Fifth National Climate Assessment (NCA5)—have dominated recent professional literature. Google Scholar lists 51,000 papers on RCP8.5 and 15,500 on SSP5-8.5. Those scenarios generate the scary warming and sea-level rise projections popularized by climate campaigners and major media.
Although neither RCP8.5 nor SSP5-8.5 was designed to be the baseline or business-as-usual emissions forecast, both scenarios have been widely misrepresented—including by the IPCC and USGCRP—as official estimates of where 21st century emissions are headed absent strong measures to transform the US and other major economies.
A quick note on terminology may be useful here. An RCP (“Representative Concentration Pathway”) is an estimate of future GHG emissions and concentrations required to achieve a specific “radiative forcing” by 2100. An SSP (“Shared Socioeconomic Pathway”) is a baseline economic development scenario that achieves a specific forcing by 2100. Radiative forcing is an imbalance, measured in watts per square meter (W/m2), between incoming shortwave solar radiation and outgoing longwave infrared radiation. Thus, in RCP8.5 and SSP5-8.5, the 21st century rise in GHG concentration produces a positive forcing (warming pressure) of 8.5 W/m2 compared to the preindustrial climate.
RCP8.5 and SSP5-8.5 envision a global return to a coal-centric energy system. In RCP8.5, for example, coal consumption increases almost 10-fold during the 21st century.
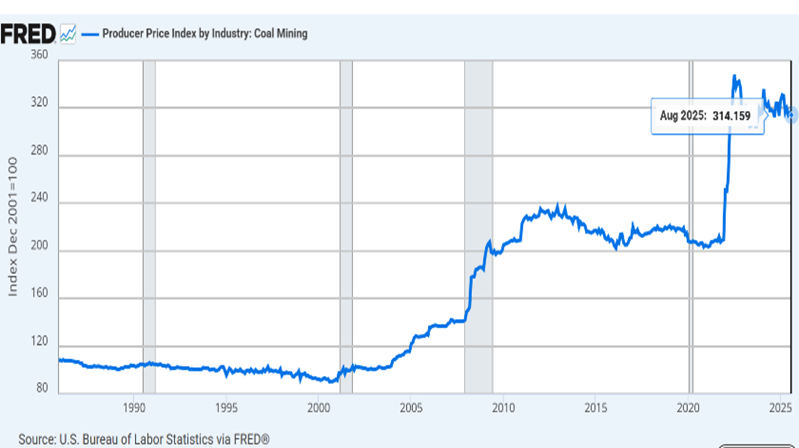
Those scenarios were never realistic and are now widely considered implausible due to the increasing abundance and affordability of natural gas, the proliferation of climate policies, and sharply rising coal producer prices.
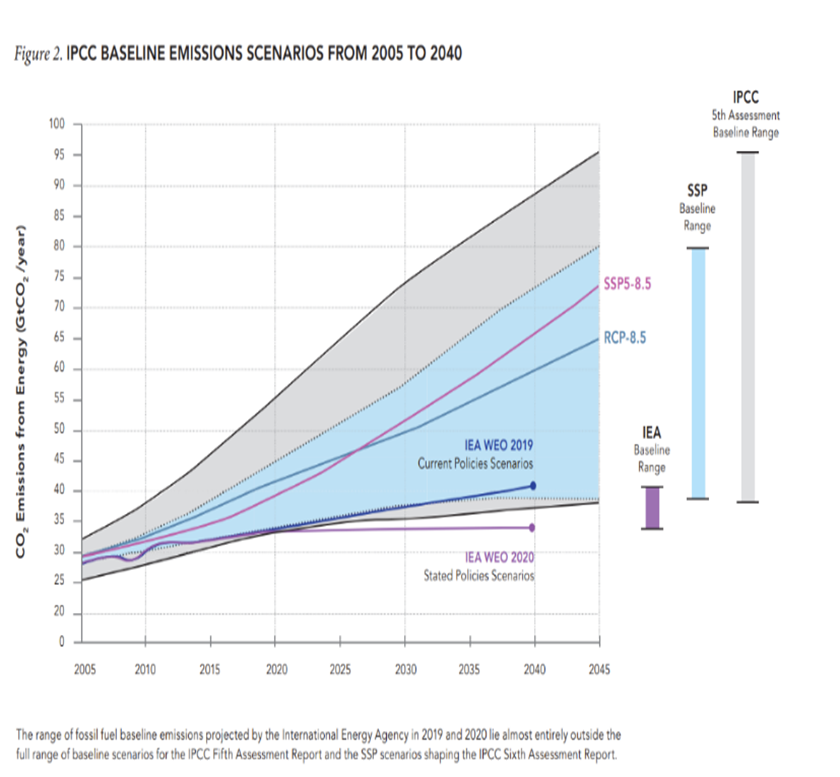
As explained in the chart below by environmental analysts Roger Pielke, Jr. and Justin Ritchie, “The range of fossil fuel baseline emissions projected by the International Energy Agency [IEA] in 2019 and 2020 lies almost entirely outside the full range of baseline scenarios for the IPCC Fifth Assessment Report and the SSP scenarios shaping the IPCC Sixth Assessment Report.”
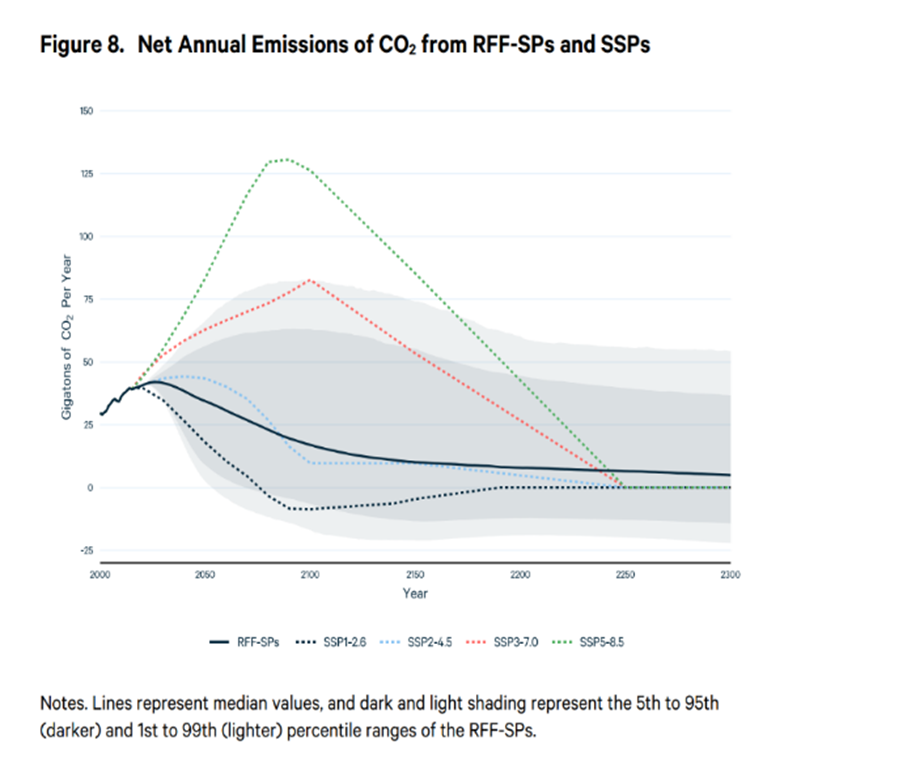
In 2022, Resources for the Future (RFF) published updated baseline emission scenarios, informed by IEA and other market forecasts. In RFF’s baseline projection, global CO2 emissions are about half those projected in SSP5-8.5 in 2050 and less than one-fifth of those projected in 2100. The RFF baseline closely tracks SSP2-4.5, the AR6 middle-of-the-road emissions scenario. The Biden administration EPA adopted RFF’s baselines as the best available for its November 2023 report on the social cost of greenhouse gases.
More recent research by Pielke, Jr. and colleagues concludes that the most realistic baseline is an even cooler scenario: SSP2-3.4. Assuming an ECS of 3°C—the IPCC’s “best estimate”—SSP2-3.4 results in a warming of 2.0-2.4°C by 2100. That is a far cry from the 4.0-8.0°C warming estimates that generate scary headlines. UK researcher Nicholas Lewis’s evidence that ECS values of 1.5-2.0°C “are quite plausible” further undermines high-end warming projections.
What about the Endangerment Finding? Were the associated emission scenarios it relied on more realistic than those used in recent IPCC and USGCRP assessment reports? No. Pielke, Jr. recently shared the relevant information on his blog.
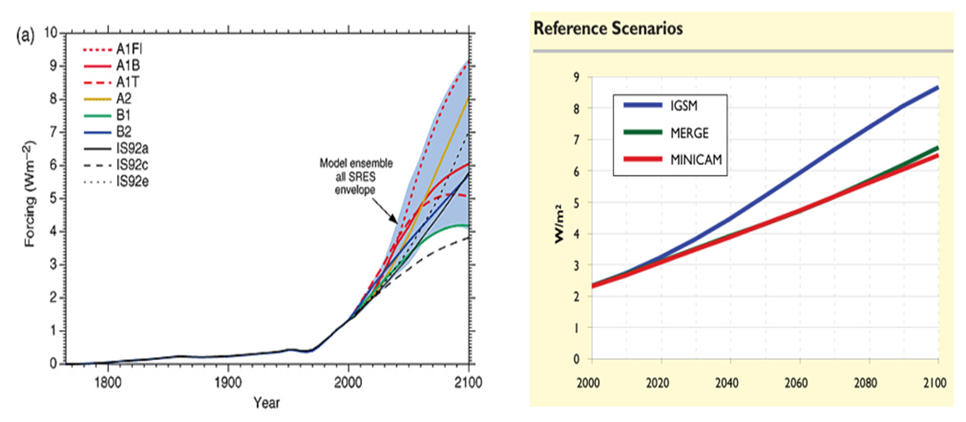
Nine emission scenarios informed the Endangerment Finding TSD—six emission scenarios from AR4 and three from the US Climate Change Science Program (CCSP), which incorporated the USGCRP during 2002-2008. The left panel shows the six AR4 scenarios (plus three earlier IPCC scenarios, labeled “IS92”). The right panel shows the three CCSP scenarios. The AR4 scenarios are also labeled “SRES” because they were originally published in the IPCC’s Special Report on Emission Scenarios.
Pielke, Jr. arranged the scenarios from highest to lowest radiative forcing:
1. A1FI-9.2 (SRES)
2. IGSM-8.6 (CCSP)
3. A2-8.1 (SRES)
4. MERGE-6.6 (CCSP)
5. MiniCAM-6.4 (CCSP)
6. A1B-6.1 (SRES)
7. B2-5.7 (SRES)
8. A1T-5.1 (SRES)
9. B1-4.2 (SRES)
The average forcing of the nine scenarios is 6.7 W/m2. That is well above the IEA and RFF baseline scenarios and nearly double SSP2-3.4. Notably, two of the nine scenarios are hotter than RCP8.5.
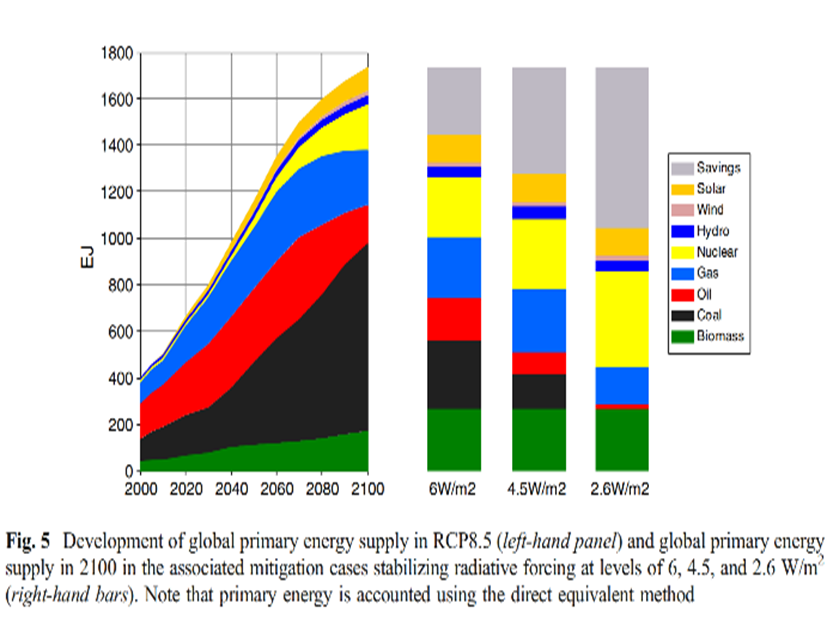
Pielke, Jr. also reproduces a chart showing the US and global energy market projections driving the CCSP emission scenarios. Purple segments depict unabated coal’s energy market share.
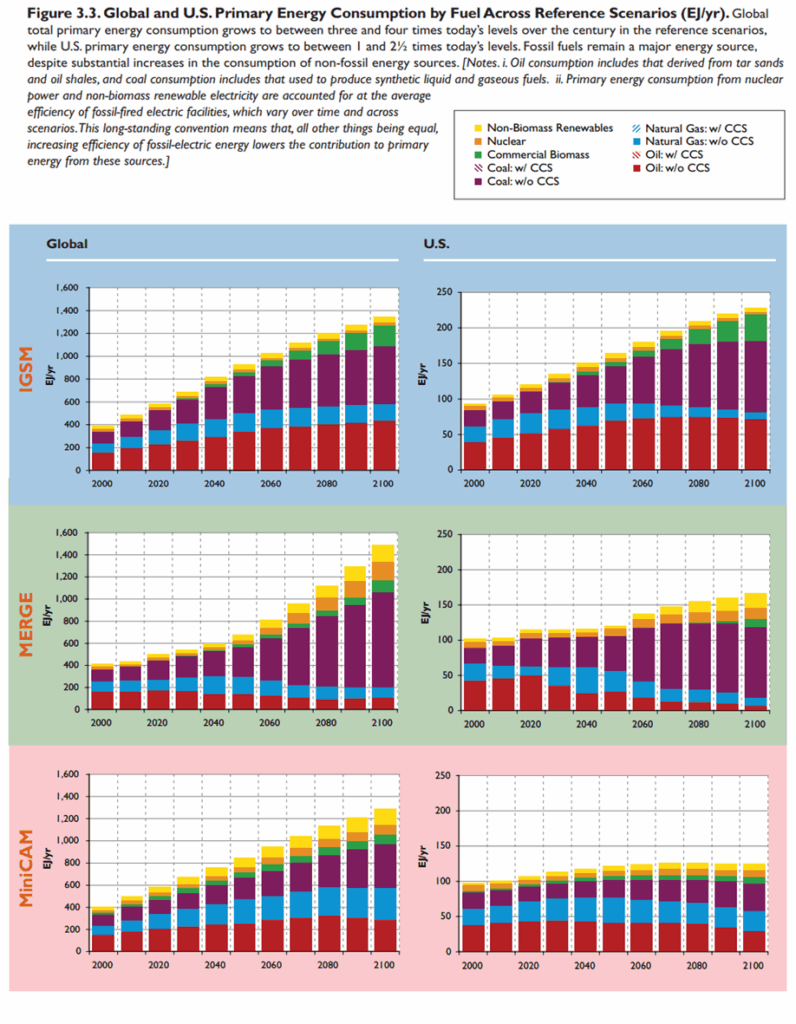
The CCSP emission baselines assume that by 2100, coal becomes either the dominant fuel source of US and global energy (MERGE) or the largest single fuel source (MiniCAM and IGSM). As Pielke, Jr. remarks, such projections have no credibility today.
To summarize, unrealistic, warm-biased models and emission scenarios were foundational to the “science” informing the 2009 Greenhouse Gas Endangerment Finding. Claims that the Endangerment Finding’s scientific basis was sound and has only strengthened over time are false.
Part 2 of this series will show that the Obama EPA’s decision to treat adaptation as “outside the scope” of an endangerment determination injected another systemic bias and further eroded the Finding’s scientific integrity.