Was 2019 the Second Warmest Year, and What Does It Matter?
 As part of the festivities surrounding the 100th anniversary of the American Meteorological Society, the National Oceanic and Atmospheric Administration (NOAA) and the National Aeronautics and Space Administration (NASA) announced that 2019 was the “second warmest year ever.”
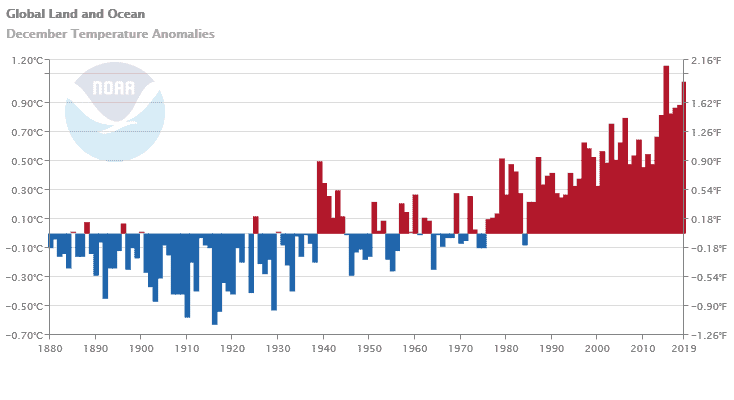
In an accompanying slide show, they included five global surface temperature histories back to 1880, which all pretty much resemble each other. Here’s the NOAA version:
Of course, 1880 doesn’t define the beginning of climate history and there’s a mountain of evidence that Earth’s surface temperature averaged warmer than the current era for three millennia at the beginning of this interglacial period.
Disregarding that, each record shows two periods of warming, 1910-1945 and post-1976. There was very little additional carbon dioxide (CO2) in the atmosphere in 1910, so that first warming is likely to be climatic noise (or, some have argued, the final climb from the “little ice age” that began in the 17th century). Similar periods of both warming and cooling are actually fairly numerous in proxy data back to the end of the current ice age, nominally 10,800 years ago.
The climate records themselves aren’t stationary. In NOAA’s previous data set there was no warming from 1998 to 2014, or, ignoring the 1998 gigantic El Niño, from 2002 to 2014. The warming that is displayed in the current slide show in that period is a result of a very controversial adjustment in which they ditched satellite-sensed sea surface temperatures for those taken in ship cooling water intake tubes, which are known to read about 0.2⁰F too high. The new record increasingly substitutes drifting buoy temperatures which are a very good, except that they are all adjusted upward to match the crummy ship temperatures. Once NOAA did this, all the other global records, with one exception, were similarly adjusted, and “the pause” in warming disappeared.
In the NOAA record, the post-1976 warming trend in the surface record remains constant at 0.17⁰C/decade (which was similar to the 1910-1945 warming rate). The average model in the current U.N. suite says the surface should be warming at 0.3⁰C/decade now, nearly twice what is being observed. The satellite average from the University of Alabama at Huntsville shows less warming at 0.13⁰C/decade in the lower troposphere. In the tropical upper troposphere, around 30,000 feet, the models predict an average warming of a whopping 0.8⁰C/decade there while the observations are 0.18⁰/decade in this region. So the upper troposphere is forecast to warm over four times faster than is being observed. Given that over 90 percent of the moisture that midlatitude agriculture depends upon originates in the tropical ocean, getting the vertical distribution of temperature wrong there has effects ranging far from the tropics. It is this distribution that determines how much tropical moisture enters the global circulation.
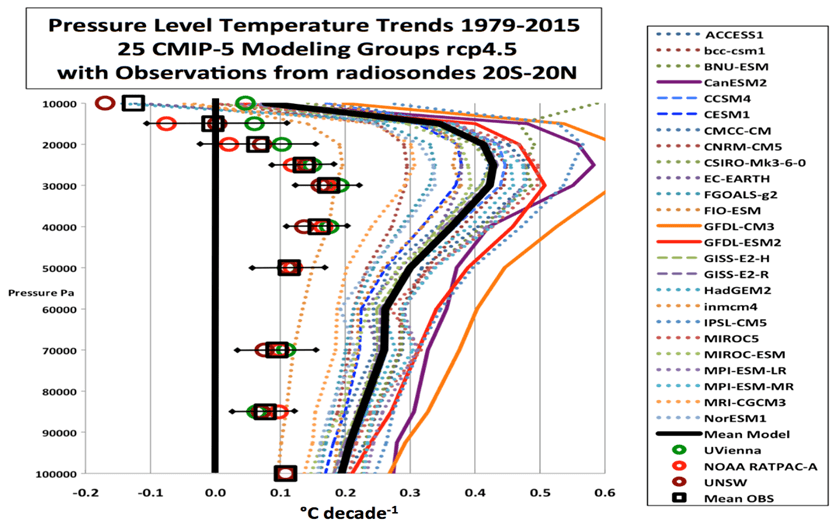
Model-predicted (thin lines) and average predicted warming (black line) versus altitude, as well as observations (symbol clusters). The models predict an enormous warming in the upper troposphere, around 30,000 feet, that is simply not being observed. Close observation reveals that one model, the Russian INM-CM4, which has the least warming, also gets it close to right.
There is one model run that matches observations. It is the Russian INM-CM4 model, and it is also the coolest of them all, with a 21st century warming of 1.4⁰C and an equilibrium sensitivity of temperature to a doubling of the CO2 concentration of 2.1⁰C, compared to the all-model average of 3.4⁰C. In the upcoming IPCC climate summary, even the INM-CM4.8 sensitivity has been revised down, to 1.8⁰C.
The fact that there’s anthropogenerated warming since 1976—which can be “proven” by the concurrent cooling of the stratosphere—is itself neither surprising nor alarming, and it means that recent years must be at or near the highest in these records. Using observed changes, Nic Lewis and Judith Curry, as well as John Christy and Richard McNider, now calculate a sensitivity of around 1.6⁰C. That would imply warming so small that it would be foolish to impoverish ourselves in any (futile) attempt to stop it.
Along with Kevin Dayaratna and Ross McKitrick, we just had a peer-reviewed paper accepted where we show that realistic discount rates and plant growth enhancements from carbon dioxide yield a negative “social cost of carbon.” That’s a net benefit, though we take pains not to trumpet it. The model we used is one of the same ones that the Obama administration employed.
In summary, the temperatures we are experiencing are consistent with a modest warming. The one model that gets things right is similarly cool compared to all the others, and we may be in the zone where modest warming is a net benefit.