What you should know about the grid: A brief primer
Photo Credit: Getty
For a long time, the electrical grid has dwelt quietly in the background of American life. It hums away quietly and most people seldom think about it, if at all. The reason for that lack of attention comes down to the fact that we rarely notice what’s working well.
Recently though, this attention is shifting, as alerts to conserve electricity at peak times are becoming ever more common, especially in Texas and California. The grid is rising to a place of cognizance.
The electrical grid is a complicated and widespread machine. Behind the scenes, there’s a massive network of power plants and grid operators working to maintain a highly tuned frequency and deliver the exact amount of power that is being demanded by power users at any given moment. The following highlights some important concepts regarding the grid.
Baseload Power vs. Intermittent Sources
Because of this need to balance power demanded with power supplied, the grid needs a relatively constant amount of power with as much consistency and predictability as possible.
Baseload units. The units that provide this reliability are referred to as baseload units or baseload plants. These units, generally nuclear power plants, coal-fired power plants, and natural gas-fired plants, provide large amounts of consistent power to the grid. Their fuel, uranium, coal, or liquified natural gas, is managed at the facility and is therefore within the control of the plant for as long as their fuel supply lasts.
Hydroelectric dams can also be considered baseload power because operators have control of when water flows through them and can control power output in a similar manner to other baseload facilities, but they can be limited by times of drought and are only available in places with somewhat unique geography.
Intermittent sources. The flip side of baseload power is “intermittent” sources. These are generating sources that have variability beyond the control of plant operators because their fuel comes in a different form. The most common examples of this are wind and solar facilities that rely on the wind gusting or the sun shining to provide power.
In California, there is a phenomenon where the level of solar penetration on the grid leads to a massive dip in net load (the forecasted load minus intermittent sources) on the grid in the middle of the day when the sun is brightest and which then drops off sharply in the early evening.
The issue is that early evening–right as many people are returning home from work–is already a time where demand on the grid increases rapidly. Solar penetration, and the resultant lowering of midday demand has exaggerated the degree of that rapid increase in the early evening. This forces dispatchable units, those that can be called upon to produce more or less power as needed, to ramp up and down sharply.
This ramping requires the dispatchable plants to come up to full power quickly, and to also stop producing quickly. This constant cycling can be hard on equipment, and makes it difficult for the California Independent System Operator (CAISO) to balance supply and demand in the system. This exaggerated rapid increase in demand in the early evening has generally been referred to as the “duck curve” because it resembled the shape of a duck (see the chart below), but as it’s grown more pronounced some have termed it the “canyon curve.”
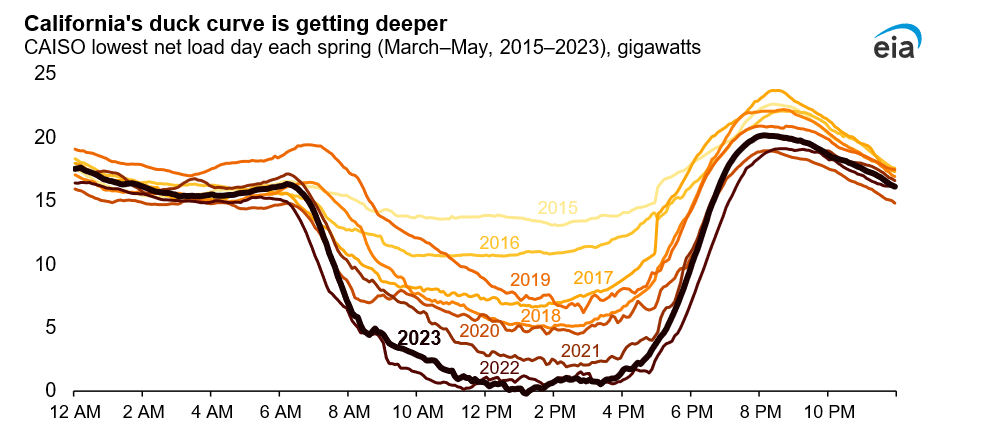
Source: Energy Information Administration
This also throws off the economics of the plants that are used for that ramping generation, because they are forced to idle for long stretches of time and then come online quickly. But they aren’t compensated for the idling time, which may in the long term make dispatchable plants uneconomical and result in a less reliable grid.
Capacity Factor
“Capacity factor” is another useful term to understand. It is a metric that compares the ratio between the amount of power that a unit was designed to produce, its nameplate capacity, and the amount of energy that it actually generated over that period.
So, if a facility has a nameplate capacity of 1,000 MW, but actually produces 900 MW on average over a given period, it has a 90 percent capacity factor. If another unit is nameplated at 1,000 and only averaged 200 MW then that unit would have a capacity factor of 20 percent.
This number alone though doesn’t tell a full story, because there are numerous reasons that various units may produce differently over time, but it is a useful proxy for how much of the projected potential of various sources is being realized. Wind and solar technologies tend to have low capacity factors because of intermittency. Even though the determination of nameplate capacity takes some degree of intermittency into account, wind and solar still perform well below their nameplate expectations.
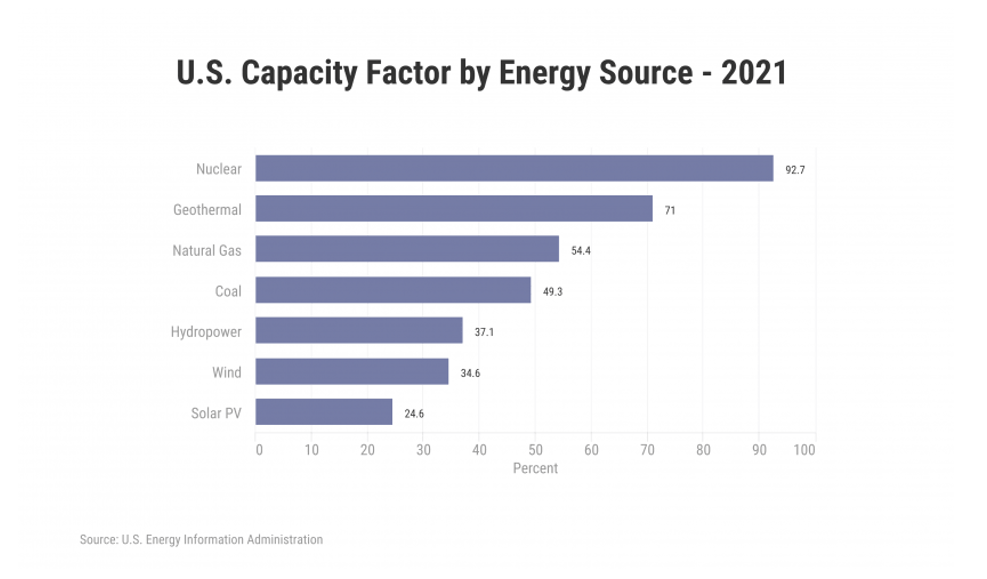
In 2021, the electricity source in the United States with the highest capacity factor was nuclear with 92.7 percent, while the lowest was solar photovoltaic (PV) at 24.6 percent. Natural gas and coal have lower capacity factors than nuclear at 54.4 percent and 49.3 percent respectively.
Given how often natural gas is cycled up (used more) and down (used less) to match demand, capacity factor is not as reliable a metric of natural gas’s ability to produce as it is for other sources such as nuclear. Coal is utilized less during months with lower demand, generally the spring and fall, and as a result has a lower capacity factor. This issue makes capacity factor a less useful metric for coal as well. Capacity factor, therefore, can help us to understand how a unit is being used, but doesn’t tell the whole story. Does the unit have a lower capacity factor than we would expect? Is that because it is being utilized inefficiently, or because it is failing to produce optimally on its own? These questions are incredibly helpful in understanding the composition of the grid.
The following chart shows capacity factor for various energy sources:
Why Understanding the Grid Matters
Decisions about the electric grid are made all the time, and at all levels of government. Often these decisions go unchecked and unattended because of popular disinterest in these topics, and common misunderstanding of the terms involved.
Understanding the concepts of baseload source and intermittency as well as the difference that capacity factor makes to a unit’s generating potential is essential to parsing news about developments in energy and public policy affecting the grid. As policies that would shift the grid from more reliable sources to more intermittent sources are being promoted and implemented in increasing volume, this understanding is especially important.