Chapter 2: Why we need a regulatory budget

The federal government publicly discloses its fiscal costs. It does not disclose most of its regulatory costs. Federal spending programs are funded either by taxes or by borrowing, with interest, from future tax collections. The public can readily inspect the costs of programs and agencies in Congressional Budget Office publications and in a formal federal budget with historical tables. That disclosure holds representatives accountable for spending,
Regulation is different. Although spending and regulation are both mechanisms by which governments act or even compel, regulatory costs are less transparent and less disciplined. That means Congress might sometimes find it easier to act via off-budget regulation rather than raising spending or taxes. And even when regulatory compliance costs do prove burdensome and attract criticism, Congress can escape accountability by blaming agencies.
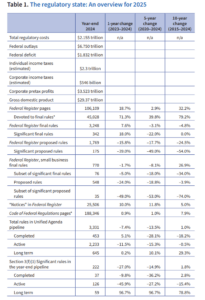
Disclosure of federal spending obviously has not restrained deficits and runaway debt. Yet transparency is vital for wrestling the budget back under control. In similar fashion, policymakers should publicly disclose regulatory costs, burdens, and vital information to the fullest extent possible despite leadership that is more open to a carbon budget than a regulatory one. Table 1 provides an overview of the 2024 federal regulatory enterprise discussed in the following pages, as well as a flavor of the kinds of components to embed in a “regulatory report card” and transparency that should come from officialdom.
About this $2.155 trillion estimate
A regulatory budget would be a great idea to keep Congress and the executive branch honest about the costs they are offloading to the private sector. However, the reality is that total regulatory costs are immeasurable, often unfathomed, and have not and cannot be truly calculated. It has been a quarter century since the federal government even tried.
There are no objective metrics to assess, apart from raw outlays on the likes of equipment and personnel. The subjective and internally felt opportunity costs of regulation cannot be calculated by an outsider any more than economies can be centrally planned. Make no mistake: There is no agreement on the costs and benefits of regulation, whether individually or in the aggregate, and there never will be.
Nonetheless, demanding some aggregate regulatory cost baseline is a reasonable ask of officialdom. In the wake of Biden’s Executive Order (EO) 14094 on modernizing regulatory review, the official narrative in large part denies that interventions are costs at all. It also makes questionable claims of savings, such as the Biden White House assertion that water heater regulation and forced replacement are “going to help consumers save about $11 billion a year.”
For purposes of maintaining a conservative accounting, Ten Thousand Commandments has employed a roughly $2 trillion estimate annually for years. This approach is based largely but not entirely on the federal government’s own reckonings that emerged from the mid- to late 1990s reform era encompassing compliance costs, economic and gross domestic product (GDP) losses, and social and other costs, supplemented with irregular White House updates of select costs and benefits.
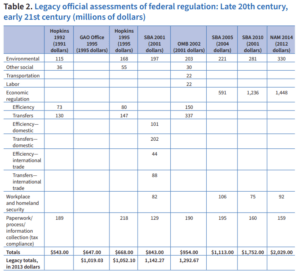
The Office of Management and Budget (OMB) estimate of $954 billion in 2002 (in 2001 dollars) would translate to over $1.64 trillion now (see Table 2). Of course, a lot has happed since then, including the addition of such rulemaking engines as the Department of Homeland Security, the Dodd-Frank financial law, the Affordable Care Act, federal pushes against fossil fuels and functional household appliances, and more.
The recent four years of lockdown, infrastructure, inflation, and technology spending and control redirected private–sector resources toward government–chosen ends via direct spending, contracting, procurement, and attendant regulation that mostly go unquantified.
Notable Biden-era examples include the Federal Communications Commission’s (FCC) attempted 2023–2024 resurrection of net neutrality regulations, as well as broadband social-policy schemes such as the Infrastructure Investment and Jobs Act (IIJA)-rooted rule on “Prevention and Elimination of Digital Discrimination” and its build-out mandates and price controls. Similar IIJA-rooted digital-welfare campaigns stem from the Commerce Department’s National Telecommunications and Information Administration that—alongside endorsing the FCC in its “digital discrimination” regulatory proceeding—boasts its own haphazard allocation of over $42 billion in BEAD (Broadband Equity, Access, and Deployment) funding with social agenda strings not contained in the IIJA legislation itself.
A recent National Association of Manufacturers (NAM) report, titled The Cost of Federal Regulation to the U.S. Economy, Manufacturing and Small Business, finds regulatory costs of $3.079 trillion for 2022 (in 2023 dollars). Employing bottom-up approaches and top-down regression modeling rooted in “academic literature finding that macroeconomic performance and living standards are systematically linked to regulatory policies,” the NAM assesses regulatory costs this way:
- Economic: $2.067 trillion
- Environmental: $588 billion
- Occupational safety/heath and homeland security: $124 billion
- Tax compliance: $300 billion
According to the report, the $2 trillion economic component encompasses rules affecting decision-making in, for example, “markets for final goods and services, markets for physical and human resources, credit markets and markets for the transport and delivery of products and factors of production.” Such interventions “affect who can produce, what can (or cannot) be produced, how to produce, where to produce, where to sell, input and product pricing and what product information must be or cannot be provided.”
Direct compliance outlays by firms, which understate the whole, include “investments in capital equipment, expenditures on O&M [operations and maintenance], payments to outside consultants, in-house employees devoted to compliance activities and so forth.” For reference, the last column of Table 2 also depicts the NAM’s 2014 estimate of $2.029 trillion.
Other assessments in recent years find regulatory costs even higher than the NAM’s new reckoning. Others look at components. For example, a report using 2002–2014 data on occupational tasks and firms’ wage spending finds that the “average US firm spends between 1.3 and 3.3 percent of its total wage bill on regulatory compliance” and that the “wage bill devoted to regulatory compliance workers in 2014 was between $79 billion and $239 billion, depending on the stringency of the regulatory compliance measure employed, and up to $289 billion when capital is also added.”
In law but not in practice, OMB is supposed to publish an annual survey of a subset of regulatory costs and benefits, the Report to Congress on the Benefits and Costs of Federal Regulations and Agency Compliance with the Unfunded Mandates Reform Act. The report invokes the Regulatory Right-to-Know Act, but the mandatory aggregate reports that the law requires have not appeared in two decades. Those have been replaced by a 10-year lookback (thereby conveniently omitting the first years of the 21st century and the entire 20th), which has itself lapsed despite the nearly unlimited resources at the federal government’s command.
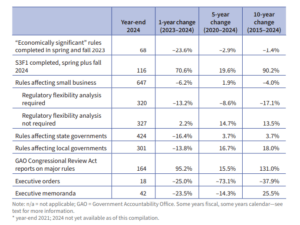
In 2023, the White House released three catch-up draft editions of the Report to Congress in a composite format encompassing fiscal years 2020–2022. Like its predecessors, the Report to Congress contains a limited overview of executive agency major rules and partial monetary quantification of some costs and benefits. As the first three rows of Table 3 show, only 31 major rules featured both benefits and costs quantified and monetized. This category is what administrations typically point to when touting net benefits of the regulatory enterprise. However, another 56 major rules had costs alone quantified, which historically OMB does not sum up. Next, in a fiscal year (FY) 2023 report issued in November 2024, 19 rules featured both costs and benefits, and another 10, costs only.

All in all, OMB has reviewed 330 major rules over the 2020–2023 “roaring 20s” period covered in Table 3. This is out of 12,796 rules finalized in the Federal Register during the same time frame.
Although the Report to Congress covers agencies’ compliance with the Unfunded Mandates Reform Act, the independent agencies, which include formidable regulators such as the FCC and some financial regulatory bodies, are exempt from OMB cost–benefit review. Overall, as Table 3 also shows, about 35 percent of the reviewed major rule subset features quantitative cost estimates so far in the decade. Beyond the designated major rules, the proportion of rules with cost analysis averages less than 1 percent. Historically, the ratios are similar.
The 2022 edition of Ten Thousand Commandments employed an estimate of $1.927 trillion for annual regulatory costs that had incorporated OMB Report(s) to Congress through FY 2019, making it a touchpoint of sorts for the first two decades of the 21st century and the incremental costs that OMB is revealing. Additional official reporting since then allowed us to adjust the 2024 estimate to $2.117 trillion, which is our starting point for 2025.
Table 3 shows the composite report containing the first four years of the 2020s. Those years had 50 rules with both benefits and costs quantified, adding $29.1 billion to annual regulatory costs. Those rules, presented in Appendix A, cover vehicle fuel efficiency, building energy conservation, and industrial admissions standards, as well as deregulatory Trump-era moves on “waters of the United States.” That $29.1 billion was added during this time frame is noteworthy, given that the first two of the four fiscal years represented Trump savings, and given that the first 20 years of the century found OMB noting $151 billion in annual costs added, averaging around $7 billion annually.
The 66 rules noted for 2020–2023 in Table 3’s fourth column with costs alone quantified add $48.2 billion to ongoing annual costs. Appendix B details this category of rules for fiscal years 2020–2022, which includes rules such as COVID-19 paid leave.
During the 2002–2019 period, there were dozens of such cost-only rule disclosures, with high-end cost estimates of $53.71 billion. This underscores that the first four years of this decade alone have added nearly that amount, indicative yet again of rising rulemaking costs. Recent costs are even higher, however, since FY 2024 is not yet officially incorporated into an OMB Draft Report, despite our being in FY 2025 now. During 2024, the OMB issued rules with total costs exceeding $1 trillion: The 2026 edition of this report will contain the annualized figures if they are made official.
To this $77 billion in quantified rules of 2020–2023 from the Report to Congress, we also incorporate a small annual paperwork cost component for independent agencies. In addition to the tardy Report to Congress, five laggard Information Collection Budget of the U.S. Government (ICB) volumes appeared in 2023 in belated compliance with the Paperwork Reduction Act of 1980. An FY 2023 edition followed in July 2024. The FY 2023 update reported that 10.5 billion hours were required to complete mandatory paperwork from 39 departments, agencies, and commissions. Paperwork is also tracked online: As of January 23, 2024, OMB’s website reported that government-wide totals for “Active Information Collections” imposed a “total annual cost” of $188,443,374,126 (up from $143,731,031,418 a year earlier) and take up 12,340,821,785 hours. One might note with amusement the pseudo-precision of $126. Until January 2024, hours were presented to three-quarters-of-an-hour precision on time consumed.
The 10.5 billion hours Washington says it takes to complete federal paperwork in its Information Collection Budget snapshot translates into the equivalent of 14,983 human lifetimes. For our purposes, executive branch agencies’ paperwork costs are assumed to have been incorporated into the Report to Congress. However, since independent agencies’ costs are not, the release of paperwork reports allows the incorporation of a small amount of incremental costs here. Assuming $35 per hour, independent agency costs that were $28.05 billion at the time of the 2024 Ten Thousand Commandments now stand at $32.49 billion. Interestingly, in keeping with the OMB shift from regulatory streamlining to greasing the pursuit of net benefits, the new Information Collection Budget was repackaged under Biden in his final two years as “Tackling the Time Tax,” wherein the thrust is not reducing paperwork burdens on the regulated public but increasing access to taxpayer–provided benefits via the likes of automatic eligibilities and partnerships with community-based organizations.
We can make a slight adjustment to legacy economic costs as well. Given that the NAM report’s economic cost component alone exceeds $2 trillion and building from the legislative interventions of the past two decades, it is appropriate to cautiously recognize that the higher economic costs that we have pointedly left flat since OMB referenced some $487 billion in 2001 dollars (Table 2). This is in keeping with the imperative to have official federal reports occupy center stage and to have their own inadequacy spur upgrades and reform.
In yet another bow to conservatism, rather than $487 billion, this report until 2023 had used a far more cautious $399 billion baseline in 2013 dollars. Updating that government-rooted but downsized figure to 2024 dollars yields a $539 billion marker we shall use. That’s still far below the NAM’s figure for economic regulation, but it serves our purpose of setting a legacy baseline and of appealing to Congress to insist on compliance with the Regulatory Right-to-Know Act.
Incorporating higher economic costs brings the total to $2.155 trillion, as reflected in Figure 1. Marking a $38 billion increase over the $2.117 trillion employed in this report’s 2024 edition, this does not yet capture the tens of billions in regulatory costs imposed in FY 2024, as OMB has not yet officially documented in a new Report to Congress. We do not claim accuracy to four significant figures but present them in the same spirit as OMB in its paperwork assessments, which presented dollar values to the one’s place and time-spent precision to the quarter hour. This figure serves as a baseline to compare with metrics such as federal spending aggregates.

estimate
Inflating figures from a quarter century ago is a sketchy exercise. Critics of cost–benefit analysis also claim that many old rules like those in the legacy federal reports no longer impose costs because of technological change or adaptation. The distortions of regulation over time make that assertion untrue, but nonetheless the NAM shows how keeping government estimates intact can illuminate the inadequacy of official government reporting and spur improvement. For example, this report embeds a $418 billion annual estimate for environmental costs, also below the NAM $588 billion tabulation for that category, so we could have also updated that figure and may elect to do so in future editions of this report.
Much federal economic and social intrusion is not captured as costs of regulation or coercive intervention in any of the formats that purport to address or score them. Even mere numbers of rules were not tabulated before 1976. Like the NAM report, other assessments acknowledge regulatory costs far beyond official reckonings, including former White House Council of Economic Advisers chief economist Casey Mulligan’s report, “Burden Is Back: Comparing Regulatory Costs Between Biden, Trump, and Obama.” These exercises to broaden understanding are appropriate since OMB reports do not entail third-party objectivity but, as OMB acknowledges in recent editions of the Report to Congress, “All estimates presented . . . are agency estimates of benefits and costs, or minor modifications of agency information performed by OMB.”
In that vein, this report’s Appendix C presents more than a century and a half of economic consolidations and administrative state escalations. As the Competitive Enterprise Institute’s founder Fred L. Smith Jr. framed this dilemma, “The genius of the Progressives in the late 19th century was to preempt or push large sectors of the emerging future (the environment, schools, electromagnetic spectrum, infrastructure, welfare, the medical world) into the political world.”
These outside-the-framework costs include antitrust regulation, public–-private partnerships in electric vehicle charging networks, clean hydrogen hubs, regional technology hubs, and other top-down subsidies, common carriage, resource-use restrictions on western lands, and the “too big to fail” stance toward large financial institutions, just to name a few.
Administrative state convention routinely disregards political failure, underplays the importance of private property, and fails to appreciate its own role in aggravating inequality. Even transfer and budget rules like the 134 noted in Table 3 can displace what would have been private activity in, for example, retirement and health care funding, distorting those markets in perpetuity. Washington’s inducement of dependency on federal government transfers is as fundamental as social regulation and the custodial administrative state can get, yet it is not counted among costs. And of course, costs of subregulatory materials, such as agency memoranda, guidance documents, bulletins, circulars, and manuals, do not appear in OMB’s annual assessments.
Abundant, therefore, are the routes for getting to $2 trillion and beyond in costs of regulatory intervention, displacement, and consolidation. Equally abundant is the official inclination to disregard the scale and scope of such encumbrances. Regulatory costs have only compounded since the government bothered to tabulate aggregate social, environmental, and economic costs two decades ago. Table 3 and Appendixes A and B depict tens of billions of dollars added in only the most recent four years by a handful of more than 400 federal agencies and subunits.
Regulation, spending, and deficit
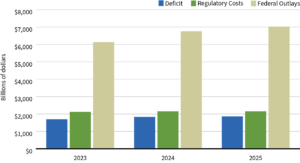
Comparing regulatory costs with federal taxation and spending helps provide perspective. According to the newly released Congressional Budget Office (CBO) Budget and Economic Outlook, covering FY 2024 and projections for FY 2025–FY 2035, the federal government posted $6.750 trillion in outlays on revenues of $4.918 trillion in 2024, for a deficit of $1.832 trillion.
According to the CBO, outlays are expected to cross the $7 trillion mark in 2025 and top $10 trillion annually by 2033. Deficits exceeding today’s $1.8 trillion are then projected to grow as far as the eye can see, passing $2 trillion in 2030.
Figure 2 compares deficits and outlays for fiscal years 2023 and 2024, and projected amounts for FY 2025, along with regulation. Regulation now stands at about 32 percent of outlays and easily exceeds 2024’s $1.832 trillion deficit. For additional perspective, the NAM regulatory aggregate cost figure of $3.079 trillion equals 46 percent of 2024 outlays.
Although spending and debt are tracked, official measurements likely do not capture increased regulatory costs from recent major spending legislation. Unremitting projected deficits can also increase pressure to regulate instead of spend.
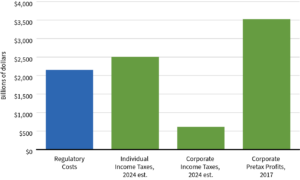
Regulatory costs compared with taxes and profits
Figure 3 provides a snapshot of the US $2.155 trillion regulatory burden compared with taxes and corporate profits. Income tax revenues were an estimated $2.5 trillion for FY 2024, while corporate income tax revenue was estimated at $613 billion for FY 2024. Regulatory costs are three and a half times corporate income taxes and approach the level of individual income taxes. The NAM cost figure of $3.1 trillion exceeds both combined ($2.6 trillion). This study’s $2.155 trillion regulatory cost estimate equals more than 61 percent of corporate pretax profits of $3.5 trillion, while the NAM’s $3.1 trillion estimate would consume nearly all corporate profits.
Regulatory costs compared with US GDP
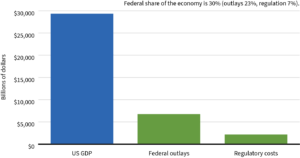
In January 2024, the Commerce Department’s Bureau of Economic Analysis estimated 2023’s US current-dollar GDP at $29.37 trillion. Our highly conservative $2.155 trillion regulatory cost figure is equivalent to approximately 7 percent of GDP, or 11 percent of the NAM’s $3.067 trillion reckoning. Combining $2.155 trillion in regulatory costs with federal FY 2024 outlays of $6.750 trillion, the federal government’s share of the economy stood at $8.9 trillion in 2024, or 30 percent of GDP (see Figure 4). None of these metrics include state and local spending and regulation.
corporate income taxes, and corporate pretax profits
regulation
US regulation compared with global economies
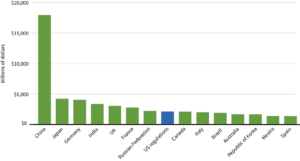
If US regulatory costs of $2.155 trillion were a country, it would be the world’s eighth-largest economy, ranking just ahead of Canada, with its $2.14 trillion 2022 GDP, and behind the Russian Federation at $2.24 trillion (see Figure 5). Using the NAM’s cost estimate, federal regulation would be the fifth-largest country, just ahead of the United Kingdom’s $3.071 GDP.
world’s largest economies
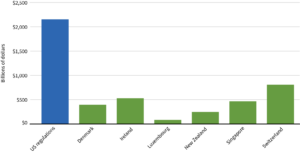
The US regulatory figure of $2.155 trillion not only exceeds the output of many of the world’s major economies, but also greatly outstrips even those ranked as the freest economically by two prominent annual surveys of global economic liberty. Figure 6 depicts the 2022 GDPs of the five nations ranked in the top 10 common to both the Heritage Foundation Index of Economic Freedom and the Fraser Institute/Cato Institute Economic Freedom of the World report. The Fraser/Cato index ranks the United States 5th, whereas the Heritage report ranks the United States 25th.
economies regarded as most free
A hidden tax on household budgets
Regulations are sometimes called a “hidden” tax for good reason. Ordinary income and FICA taxes are itemized on pay stubs and calculated on tax returns. Most regulatory costs are embedded in prices of goods and services, and never show up on a receipt or an annual statement. Regulations can affect households directly, or they can occur indirectly. Businesses pass regulatory costs on to consumers just as they do the corporate income tax. Other regulatory costs find their way to households in the form of lower returns on retirement funds and other investments, as well as fewer investment opportunities and more paperwork.
The true incidence of regulatory costs is of course impossible to precisely calculate. But by assuming a full pass-through of all regulatory costs to consumers, one can look at American households’ share of regulatory costs and compare it with total annual expenditures at the household level, such as the ones from the Department of Labor’s Bureau of Labor Statistics.
For America’s 134.556 million households, average 2023 pretax income was $101,805 (compared with the prior year’s $94,003). If one were to allocate annual regulatory costs, assuming the full pass-through of costs to consumers, US households pay $16,016 annually in embedded costs ($2.155 trillion in regulation divided by 134,556,000 consumer units), or 16 percent of an average income before taxes (and of course more as a share of after-tax income). The NAM’s $3.079 trillion regulatory assessment would imply costs of $22,883 per household, or 22 percent of income.
Using the $2.155 trillion baseline, the hidden regulatory tax exceeds every annual household expenditure item except housing (see Figure 7). Regulatory costs amount to up to 21 percent of the typical household’s expenditure budget of $77,280 (up from $72,967 in 2022). That means the average US household spends more on hidden regulation than on health care, food, transportation, entertainment, apparel, services, or savings. The NAM’s $3.079 trillion regulatory cost of $22,962 amounts to fully 30 percent of household expenditures, still not exceeding housing costs but coming uncomfortably close.
Examining costs is one way to assess the size and scope of federal regulation. Another is to assess the amount of regulatory material that agencies publish each year in sources like the Federal Register.
burdens
Chapter 3: Numbers of rules and page counts in the Federal Register
Ten Thousand Commandments main page