Modernizing EPA Science Policies
“Science is the foundation that supports all of our work at EPA,” the first sentence of the agency’s Peer Review Handbook declares. The document continues: “The quality and integrity of the science that underlies our regulations are vital to the credibility of EPA’s decisions and, ultimately, the Agency’s effectiveness in pursuing its mission to protect human health and the environment.” Only an EPA dedicated to scientific integrity can effectively carry out its mission and deserve the public’s trust.
A 50th anniversary Web page similarly declares that “every step” since the EPA’s founding in 1970 “has been grounded in a solid foundation of science.” EPA researchers and their partners across the scientific community “provided the data, knowledge, and tools needed to tackle the most pressing environmental and related health challenges the nation has faced.” In fact, EPA researchers “pioneered the field of environmental science, defining it as an interdisciplinary field of research focused on illuminating the links between our own health and well-being and the natural environment we share.”
Risk assessments by early EPA researchers, including those who had worked in other agencies prior to the EPA’s creation, provided the “underpinnings of landmark environmental statutes” such as the Clean Air Act and Clean Water Act. In later years, EPA researchers “helped to identify” the health hazards of environmental tobacco smoke and lead in gasoline. Throughout its first 50 years, the EPA pioneered and supported most of the advances in air pollution measurement, monitoring, modeling, and abatement. The agency also made significant contributions to water pollution management, safe drinking water technology, and soil remediation. The EPA has much to be proud of.
Unfortunately, that is not the whole story. EPA regulations are among the most controversial promulgated by any federal agency. Although opponents typically attack those rules as too costly and beyond the EPA’s statutory authority, some also question the agency’s scientific rationale. Such skepticism is appropriate for two broad reasons. One is the “reproducibility crisis” of modern science. Most published research findings in several disciplines are not independently validated. The other reason is institutional. The EPA’s organizational interests and policy agendas influence how it funds, interprets, and disseminates science.
In a nutshell, research findings that are not independently verified, methodologies biased to favor one side in a scientific debate, and research products used to justify policies that courts later determine to be non-congressionally authorized raise legitimate doubts about the EPA’s scientific opinions. When science is perceived to be biased, it fuels rather than quells controversy.
Only by enacting new and stronger scientific integrity standards can Congress ensure that the EPA effectively carries out its mission and deserves the public’s trust.
Deficiencies in the EPA’s management of air pollution epidemiology and climate science figure prominently in this chapter. That focus reflects the economic and political significance of the EPA’s air and climate regulations, and the longstanding scientific controversies associated with those policies. However, in many cases the same or similar defects occur in other research disciplines, and many of the solutions here apply broadly beyond the specific examples used to illustrate them. Of particular importance, many of the solutions are not inherently air or climate specific and are intended to apply to the EPA’s use of science in general.
The present chapter is organized as follows. The first part provides background on the nature of science, the reproducibility crisis, the EPA’s failure to acknowledge that crisis, and agency practices that fail to restrain or instead promote data inaccessibility, publication bias, cherry picking, and data manipulation. The second part delves more deeply into EPA research and science, examining chiefly the EPA’s funding, assessment, and use of air pollution epidemiology, proposes solutions to those problems, and in the process helps to lay the foundations for strong EPA scientific integrity policies in general. The third part finds serious defects in EPA and US government climate risk assessments and social cost of carbon analysis and proposes remedies for those problems.
I. Science, transparency, and reproducibility
When evaluating the EPA’s scientific work, it is useful to begin by reflecting on what science is—and is not. Popular exhortations to “follow the science” and “listen to the scientists” foster two common misconceptions. One is that science is any study published in a peer-reviewed journal. The other is that science is a “consensus” reached by expert panels conducting weight-of-evidence literature reviews.
While peer review is a critical first step in preventing shoddy, trivial, or false research from being published, it is not a guarantee of scientific validity. Peer reviewers are not expected to perform an audit (i.e., an independent verification) and seldom do. Passing peer review may merely mean that some scientifically trained people spot no obvious errors in a study and think it worth publishing for any number of reasons (including potential policy impact).
As Kings College professor Stuart Ritchie’s book, Science Fictions, documents in exhaustive detail, “peer review can’t be relied upon to ensure scientists are honest, detached, scrupulous, or sober about their results.” Indeed, according to Ritchie, his book reveals a “dizzying array of incompetence, delusion, lies and self-deception” in the peer-reviewed literature.
In a 2013 article titled “How Science Goes Wrong,” the Economist reported: “When a prominent medical journal ran research past other experts in the field, it found that most of the reviewers failed to spot mistakes it had deliberately inserted into papers, even after being told they were being tested.” Granted, that is just one internal review. But maybe that is because few journals bother to test their reviewers.
Laxity is not the only problem. When the reviewers are colleagues who co-author each other’s work, attend the same academic conferences, or depend on the same funding sources, peer review may be little more than “pal review.”
The late climate scientist Patrick J. Michaels pungently describes pal review’s causes and consequences:
Publishing in the scientific literature is supposed to be tough. Submit a manuscript to a reputable journal and it will go through “peer review,” where your equals criticize your work, send their comments to a journal editor and then the editor will decide whether to accept your submission, reject it outright, or something in between.
In order to limit any bias caused by personal or philosophical animosity, the editor should remove your name from the paper and send it to other experts who have no apparent conflict of interest in reviewing your work. You and the reviewers should not know who each other are. This is called a “double blind” peer review.
Well, this is “the way it is supposed to be.” But in the intellectually inbred, filthy-rich world of climate science, where billions of dollars of government research money support trillions of dollars of government policy, peer review has become anything but that.
There is simply no “double blindness.” For reasons that remain mysterious, all the major climate journals leave the authors’ names on the manuscripts sent out for review.
Economists, psychologists and historians of science all tell us (and I am inclined to believe them) that we act within our rational self-interest. Removing the double-blind restriction in such an environment is an invitation for science abuse.
What about if my professional advancement is dependent upon climate change monies (which applies to just about every academic or government climatologist)? I’m liable to really like a paper that says this is a horrible and important problem, and likely to rail against an author who says it’s probably a bit overblown. May God have mercy on any manuscript that mentions the rather large elephant in the room, which is that we probably can’t do much about it anyway.
Such “confirmation bias” has been noted and studied for years, but the response of science in general—and atmospheric science in particular—has only been to make things worse.
Peer review has become “pal review.” Send a paper to one of the very many journals published by the American Geophysical Union—the world’s largest publisher of academic climate science—and you can suggest five reviewers. The editor doesn’t have to take your advice, but he’s more likely to if you bought him dinner at the last AGU meeting, isn’t he? That is, of course, unless journal editors are somehow different than government officials, congressmen, or you.
As Michaels also indicates, pal reviewers can become gatekeepers. Although cabals occasionally form to blacklist research rivals, marginalizing scientists who hold the ‘wrong’ opinions can be accomplished without explicit coordination.
As for the consensus assessments of expert panels, those are reliable only if the literature examined is not contaminated by publication bias and data manipulation. Even a fraudulent study that slipped through peer review may be cited hundreds of times—in some cases for years after its retraction.
So, if science is neither anything published in a peer-reviewed journal, nor the latest consensus approved by a panel of experts, what is it?
Science is a mode of inquiry that tests hypotheses (guesses) against data (quantifiable facts). Caltech physicist Richard Feynman succinctly described the scientific method as follows. The scientist begins by making a guess about how the world works. He next computes the consequences we should find if the guess is true. He then compares those computational consequences to facts ascertained by experiment or observation. “It doesn’t matter how beautiful your guess is, how smart you are, or what your name is. If it disagrees with experiment, it’s wrong. That’s all there is to it.”
Feynman goes on to clarify that the guess is wrong only “after the experiment has been checked, the calculations have been checked, and the thing has been rubbed back and forth a few times to make sure that the consequences are logical consequences from the guess, and that, in fact, it disagrees with our very carefully checked experiment.”
The whole process from hypothesis to experiment must be checked and rechecked for the simple reason that people are fallible. Even the best scientists need other scientists to check their work.
Such checking cannot occur if a study’s authors hide their data, methods, and computations from reviewers. Ideally, each study should be an open book with a clear audit trail. Corporate filings to the Internal Revenue Service and Securities and Exchange Commission must meet strong transparency requirements. Similarly, as discussed below, Food and Drug Administration (FDA) regulations require investigators in new drug clinical trials to file and follow fully auditable research protocols.
The pivotal studies on which federal agencies base regulatory decisions with billion-dollar consequences should be comparably transparent. D.B. McCullough and Ross McKitrick explain:
Scholars must have the unhindered right to publish their research and make their points of view known without fear of reprisal. But when a piece of academic research takes on a public role, such as becoming the basis for public policy decisions, then practices that obstruct independent replication, such as refusal to disclose data or the concealment of details about computational methods, prevent the proper functioning of the scientific process and can lead to poor public decision making.
Beyond any considerations of ethics or public interest, transparency is also an epistemological imperative. Science assumes that whatever one person discovers, another can verify (assuming the latter has the requisite skills and tools). If a study’s results cannot be repeated, it is not science. Ritchie explains:
For a scientific finding to be worth taking seriously, it can’t be something that occurred because of random chance, or a glitch in the equipment, or because the scientist was cheating or dissembling. It has to have really happened. And if it did, then in principle I should be able to go out and find broadly the same results as yours. In many ways, that’s the essence of science, and something that sets it apart from other ways of knowing about the world: if it won’t replicate, then it’s hard to describe what you’ve done as scientific at all.
British philosopher of science Karl Popper similarly emphasized the necessity for “repeatable experiments”:
Only when certain events recur in accordance with rules or regularities, as is the case with repeatable experiments, can our observations be tested—in principle—by anyone. We do not take even our own observations quite seriously, or accept them as scientific observations, until we have repeated and tested them. Only by such repetitions can we convince ourselves that we are not dealing with a mere isolated coincidence.
“Replication is the cornerstone of science,” McCullough and McKitrick contend:
Research that cannot be replicated is not science and cannot be trusted either as part of the profession’s accumulated body of knowledge or as a basis for policy. Authors may think they have written perfect code for their bug-free software and correctly transcribed each data point, but readers cannot safely assume that these error-prone activities have been executed flawlessly until the authors’ efforts have been independently verified.
Young and Karr (2011) provide the simplest explanation: “Science works by experiments that can be repeated; when they are repeated, they must give the same answer. If an experiment does not replicate, something has gone wrong.”
Technically, a distinction exists between replicating and reproducing scientific findings. Young et al. (2021) explain:
The validation of scientific truth requires replication or reproduction. Replicability (most applicable to the laboratory sciences) most commonly refers to obtaining an experiment’s results in an independent study, by a different investigator with different data, while reproducibility (most applicable to the observational sciences) refers to different investigators using the same data, methods, and/or computer code to reach the same conclusion.…Scientific knowledge only accrues as multiple independent investigators replicate and reproduce one another’s work.
Replicating the results of an experimental study supports its claim to have found real causal relationships in the world. In contrast, reproducing the results of an observational study confirms that the study contains no serious computational errors.
Nonetheless, “replication” and “reproduction” both express the basic idea that research must be repeatable to be science. Because science journals as well as common parlance often use the terms interchangeably, we do so as well in this chapter.
To summarize, science tests hypotheses against data, repeatability is a hallmark of scientific knowledge, and transparency enables independent researchers to test whether a study’s results can be repeated.
The reproducibility crisis and the EPA
How pervasive are reproducibility problems? That is unknown because replication tests are seldom performed outside the biomedical sciences. “In economics,” Ritchie reports, “a miserable 0.1 percent of all articles published attempted replications of prior results; in psychology, the number was better, but still nowhere good, with an attempted replication rate of just over 1 percent.”
Biomedicine is a relatively “hard” science, using randomized clinical trials to test new therapies. How often are biomedical research findings successfully replicated?
At the biotechnology company Amgen, researchers tried to replicate the results of 53 “landmark” studies of cancer drugs administered to lab animals or human cells in vitro. Only six replications (11 percent) were successful. Baer researchers report that about 20-25 percent of the company’s published findings on oncology, women’s health, and cardiovascular diseases could be replicated. The authors also note the general impression of academic and industry scientists that “many results that are published are hard to reproduce.”
Many biomedical studies cannot be tested for reproducibility because they do not provide enough information. In a random sample of 268 biomedical studies, “all but one of them failed to report their full protocol.” Another literature review found that “54 percent of biomedical studies didn’t even fully describe what kind of animals, chemicals or cells they used in their experiment.”
Studies in other fields exhibit similar problems. An analysis of five leading economics journals found that the Journal of Applied Econometrics rigorously required the archiving of data, models, and code as a precondition for publication. Consequently, 99 percent of its published articles could be tested for replicability. The other journals had less rigorous archival policies. Lower percentages of their published studies could be tested: Federal Reserve Bank of St. Louis (49 percent); Journal of Business and Economic Statistics (36 percent); Journal of Money Credit and Banking (33 percent); and Macroeconomic Dynamics (14 percent).
An analysis of GDP growth studies published in 13 high-quality economic journals could replicate 22 of 67 papers (33 percent) without contacting the authors. After excluding six papers with confidential data and two with unobtainable software, the reviewers could replicate 29 of 59 papers (49 percent), albeit only when assisted by the original authors. The reviewers conclude: “Because we are able to replicate less than half of the papers in our sample even with help from the authors, we assert that economics research is usually not replicable.”
The results of observational studies such as nutritional survey research and air pollution epidemiology are also often not reproducible. Young and Karr (2011) found 12 randomized clinical trials that collectively tested 52 claims in observational studies about the health benefits of nutritional supplements. None of the claims could be replicated. All are likely wrong.
The EPA’s fine particulate matter (PM2.5) air quality standards and regulations are chiefly based on epidemiology, for two main reasons. First, clinical trials with human volunteers and animal toxicology studies use concentrations much higher than ambient levels. Consequently, clinical and toxicological studies can show the biological plausibility of health effects at ambient levels, not the existence of such effects. Second, clinical trials are also of relatively short duration (a few hours) and therefore cannot measure long-term exposure effects. In contrast, observational studies of large population cohorts are longitudinal. Subjects are followed over years to decades “with continuous or repeated monitoring of risk factors or health outcomes, or both.”
The results of such studies are seldom reproduced, for two reasons. First, independent researchers have often been denied access to the raw data in such studies. Second, the percentage of replication studies in any research discipline is small because funders, academic departments, and journals typically prefer studies with exciting new positive (hypothesis-confirming) results, not reviews that could undermine established conclusions, reputations, or policies. Nonetheless, the issue looms large among scientific researchers. Google Scholar lists 90,200 papers on the “reproducibility crisis” and 665,000 papers on the “replication crisis.”
Of 1,576 active researchers who answered several reproducibility questions posed by Nature, 52 percent judged reproducibility to be a “significant crisis” while 38 percent judged it to be a “slight crisis.” Only 3 percent said there is no crisis while 7 percent did not know. “More than 70 percent of researchers have tried and failed to reproduce another scientist’s experiments, and more than half have failed to reproduce their own experiments.”
In short, irreproducibility is real and raises serious questions about the quality of research informing policy decisions. Where does the EPA stand on replication issues?
The EPA published a scientific integrity policy in 2012, a proposed update in January 2024, and a final update in January 2025. None of those documents evinces any awareness of the widely reported replication failures in several research disciplines. Neither the original 2012 scientific integrity policy nor the final 2025 update contains “reproduce,” “replicate,” or related words. The proposed 2024 update affirms that the EPA makes its data, models, and code publicly available “to allow the public to reproduce EPA scientific results.” However, the EPA omits those words in the final scientific integrity policy. More importantly, none of the documents states a commitment or presents a plan to increase the reproducibility of studies funded or used by the EPA.
To its credit, the EPA’s January 2021 Transparency Rule obligated the agency to give greater weight in rulemakings to studies with fully accessible data and models. Activists, politicians, and former EPA staff condemned this modest proposal, claiming it would kill children and unleash a public health crisis. That so many self-avowed champions of science excoriated a mild transparency measure unwittingly underscored the need for stronger scientific integrity standards.
Regrettably, the EPA stumbled over the objection of former staff that none of the statutes administered by the agency lists transparency as a science quality criterion. The objection is easily rebutted. The same statutes also do not define “science,” presumably because the agency is expected to have some grasp of what science is. As explained above, irreproducible research is not really science, and non-transparent science is not reproducible. The EPA was well within its rights to prefer see-for-yourself science to trust-me science. Indeed, in prior administrations, the agency affirmed the need for transparency (“full disclosure”) for each step of an environmental risk characterization.
Instead of insisting on the inherent linkages between science, repeatability, and transparency, the EPA invoked its housekeeping authority, claiming the Transparency Rule dealt solely with internal agency procedure. Environmental groups challenged the rule in the United States District Court for the District of Montana. The court found the Transparency Rule to be a “substantive rule,” as it would permanently narrow the EPA’s discretion to consider certain types of research in rulemakings. And, according to the court, authority for a substantive rule can come only from statutes the agency administers, not general housekeeping authority.
Congress now has an opportunity to prioritize transparency and reproducibility as essential elements of science quality and integrity. It should do so.
General problems in EPA research, science
The reproducibility crisis has several causes. Quality control standards are weak and seldom enforced. Financial and professional incentives encourage researchers to prioritize grantsmanship, publication frequency, media coverage, and policy impact over science quality. Research findings may be irreproducible due to negligence, publication bias, cherry picking, inaccessible data or code, data manipulation, or fraud.
The EPA’s funding, assessment, and production of research tends to entrench rather than discourage those flaws. In the field of PM2.5 epidemiology, the EPA implements no procedures to detect or prevent publication bias and data manipulation. It does not correct for the large number of false positive results that occur when researchers run multiple tests with multiple models on the same dataset. It does not condition research grants on data accessibility. It does not give more weight to reproducible than irreproducible research.
The EPA’s climate science assessments similarly flout the “philosophy” of “transparency, clarity, consistency, and reasonableness” proclaimed in the agency’s Risk Characterization Handbook. The EPA’s typical procedure is to run overheated climate models with inflated emission scenarios and depreciate humanity’s remarkable capacity for adaptation.
Despite longstanding Office of Management and Budget (OMB) policy, the EPA seldom provides a full range of sensitivity cases allowing the public to understand how reasonable alternative assumptions would change the outcomes of its projections. The agency’s responses to comments are often too brief or dismissive to engage dissenting views on the merits. No provision is made for moderated public debate between competing experts on the scientific basis of EPA regulations. The EPA’s science advisory and peer review panels often lack independence and viewpoint diversity.
A problem related to all those issues is the commingling of science and policy in regulatory decisions. Regulatory agencies are inherently tempted to hide policy choices behind a façade of neutral science (i.e. engage in “science charades”) or selectively consider or fund research to justify predetermined policy choices (i.e. engage in “advocacy science”). The Clean Air Act exacerbates that problem by establishing regulatory tripwires—so-called endangerment determinations that require the EPA to promulgate emission standards if it anticipates harm to public health or welfare.
Smart policy usually involves weighing and balancing competing equities. In contrast, an endangerment determination is a single-factor analysis of whether there is or is not a risk. If the answer is yes, the agency must regulate. A science-only regulatory trigger increases the EPA’s inherent incentive to use science for support rather than illumination. It also fosters obtuseness about whether the rule’s benefits are worth the costs or whether the cure might be worse than the disease.
The commingling of science and policy is a key theme of Chapter 2. Although not a specific focus of the present chapter, it contributes to the problems examined here.
II. Research and science problems in air pollution epidemiology
Inaccessible data
Epidemiological studies that examine potential correlations between airborne particulates and mortality collect health data from large numbers of individuals. The raw data thus include personally identifiable information (PII), which is protected by the Privacy Act of 1974, as amended. To do their work, researchers sign confidentiality agreements barring the release of PII.
Protecting patient privacy is essential. However, authors of the foundational studies have used patient privacy as an excuse to hide their data from independent investigators—and from the EPA itself. Except when pressed by Congress, the EPA makes no effort to obtain such data. The EPA has never successfully obtained the raw PM data from the researchers it funds.
Cecil and Griffith (1985) suggest that the EPA and other agencies deliberately decline to take possession of epidemiological research data to immunize the latter from scrutiny under the Freedom of Information Act (FOIA):
Though the precedents are confusing and regulations vary from agency to agency, it appears that if an agency does not take possession of the research data, the agency can fund the research, participate in the design and development of the research, permit access by third parties to the data, base regulatory findings on the conclusions of the research, and yet thwart access to the records by persons and organizations the agency does not wish to have them.
Cecil and Griffith contend that FOIA’s limited application to federal agency data “invites agencies to structure their relationships with research grantees and contractors in such a way that controversial or sensitive federal research records relied on by the agencies will be beyond public scrutiny.”
Only once did authors of the chief foundational PM-mortality studies, Dockery et al. (1993) and Pope et al. (1995), agree to share their data with a third party—the Health Effects Institute (HEI).
HEI’s reanalysis, Krewski et al. (2000), confirmed Dockery and Pope’s finding of a significant PM2.5-mortality nexus. However, oddities in Pope’s and HEI’s results raised questions about the reality of that nexus. As air quality analyst Joel M. Schwartz explains, the Pope study and HEI reanalysis reported that:
PM2.5 kills those with no more than a high school degree, but not those with at least some college; men but not women; and the moderately active but not the very active or sedentary. These odd variations in PM’s ostensible effects don’t seem biologically plausible and suggest that the apparent effect of PM2.5 is actually spurious, resulting from failure to control adequately for confounding factors unrelated to air pollution.
More importantly, no other research team was allowed to examine the Dockery and Pope data, and HEI’s independence was potentially compromised by its financial dependence on EPA funding.
HEI completed its reanalysis three years after the EPA promulgated its first rule establishing national ambient air quality standards (NAAQS) for PM2.5. The Dockery and Pope studies were the rule’s principal scientific basis. Reporting fundamental flaws in the Dockery/Pope research would have undermined the EPA’s landmark PM rule, putting HEI crosswise with its principal donor.
Granting HEI exclusive access to the Dockery and Pope data perpetuated the EPA’s reliance on “secret science.” It also made no methodological sense. If HEI can review PII without compromising patient privacy, so can other researchers, including those who are not EPA-funded.
Survey research with PII can be placed in a restricted access data repository or secure data enclave. Reviewers can be bound by data access agreements equivalent to the original researchers’ confidentiality agreements. Reviewers can be required to de-identify the raw data as a safeguard against accidental release. They can be required to return or destroy copies of the original data after the audit is complete. Those are essentially the protocols HEI’s reanalysis followed.
Reproducibility testing requires independent scrutiny of a study’s raw data along with its models and code. Except in the case of the ill-fated Transparency Rule, the EPA has made no serious effort to make the datasets of pivotal studies more accessible for independent review. Only Congress can fix this problem.
Publication bias
Objectivity and balance are hallmarks of science quality. A field of scientific research can be objective and balanced only if all results are reported—negative results that support the null hypothesis as well as positive results that support the researcher’s hypothesis.
However, the entire research ecosystem comprising funders, academic departments, and journals has a strong preference for studies reporting statistically significant positive results. Young et al. (2021) explain:
Well-published university researchers earn tenure, promotion, lateral moves to more prestigious universities, salary increases, grants, professional reputation, and public esteem—above all, from publishing exciting, new, positive results. The same incentives affect journal editors, who receive acclaim for their journal, and personal reputational awards, by publishing exciting new research—even if the research has not been vetted thoroughly. Grantors want to fund the same sort of exciting research—and government funders possess the added incentive that exciting research with positive results also supports the expansion of their organizational mission. American university administrations want to host grant-winning research, from which they profit by receiving “overhead” costs—frequently a majority of overall research grant costs.
Due to those pervasive incentives, far fewer studies with null results are accepted for publication. Many are sent to the “file drawer” rather than submitted to a journal. Many are not even written up.
The EPA contributes to publication bias by acts of both omission and commission. The agency does not require the studies it funds to report negative as well as positive results. It does not set aside a significant portion of research grants for replication studies or studies seeking to validate the null hypothesis.
In addition, the EPA contributes to publication bias simply by paying for the overwhelming lion’s share of PM2.5 epidemiology. In the early 1990s, the EPA funded investigators on both sides of the PM-mortality issue. It funded Harvard University professor Douglas Dockery and colleagues who found a significant association between airborne particulates and mortality. It also funded Patricia Styer and her team at the National Institute of Statistical Sciences (NISS), who found no significant association. However, in 1995, the EPA decided to renew funding for the Dockery group but not for NISS. It was a market signal the research community could not fail to notice.
The signal soon became a roar. In 1998, the EPA provided research grants of $7.7 million to $8.7 million to each of five new research centers headquartered at prestige universities (University of Washington, New York University, University of Rochester, UCLA, and Harvard University). Two more centers were created in 2012 (University of California, Davis, and Johns Hopkins University), also with grants just shy of $8 million. By 2019, the EPA had awarded more than $210 million in grants to the seven PM centers and the Health Effects Institute. During 2000-2019, EPA grants to HEI totaled $87 million.
“The mission statements of all those centers make it abundantly clear that their objective was not to investigate whether PM2.5 had health effects, but to produce studies documenting the size and nature of those effects,” University of Virginia law professor Jason Johnston observes. In the words of one mission statement, “our goal is to lay a firm scientific foundation for effective intervention strategies.”
EPA funding created the PM2.5 research industry and sustains it to this day. The resulting regulatory science eco-system may be summarized as follows. The EPA funds multimillion-dollar PM research centers. The centers produce scores of studies asserting or implying the need for new or stronger “intervention strategies.” The resulting “weight of evidence” in the EPA-funded literature aligns with the agency’s interests and ambitions.
Cherry picking
Cherry picking is the selective inclusion or exclusion of evidence to bias an analysis towards a predetermined conclusion. An obvious form of this practice is to cite studies that confirm a favored hypothesis and ignore studies that do not.
In PM2.5 rulemakings, some commenters have provided lists of peer-reviewed, reproducible studies finding no association between PM2.5 and mortality. Such studies are typically not discussed in the final rule or included in its reference list.
Cherry picking exacerbates publication bias. Not only are fewer studies with null results published. Those that make it through the publication gauntlet are overlooked or downplayed.
For example, the EPA’s proposed (2023) and final (2024) PM2.5 NAAQS rules do not mention Enstrom (2017) and Young et al. (2017). Enstrom’s reanalysis of the foundational Pope et al. (1995) study finds that the reported association between PM2.5 and mortality is due to “selective use” of both population and PM2.5 exposure data.
Young et al. (2017) examined potential associations between mortality and air pollution in the eight most populous California air basins over a period of 13 years, reviewing over 2 million deaths during 37,000 exposure days. They found that “daily death variability was mostly explained by time of year or weather variables,” and that “neither PM2.5 nor ozone added appreciably to the prediction of daily deaths.”
The EPA is aware of those studies, which are briefly summarized in the agency’s December 2019 Integrated Policy Assessment for Particulate Matter. But subsequent rulemakings do not revisit such studies, unlike studies supporting the agency’s regulations, which continue to be cited up to two decades after publication.
A related form of cherry picking is selective interpretation of results. The EPA’s most recent proposed and final PM2.5 rules cite an agency-funded study, Greven et al. (2011). The EPA mentions the study’s technique for reducing uncertainties related to potential confounders, but not the authors’ conclusion that at the local level, “we are not able to demonstrate any change in life expectancy for a reduction in PM2.5.”
Another form of cherry picking is ignoring inconvenient data, arguments, or questions. In EPA rulemakings, commenters have submitted information and queries like the following.
Residents of Arlington County, VA have an average life expectancy of 82.76 years. Average life expectancy in Beijing is nearly identical: 82.2 years. Yet annual PM2.5 levels in Beijing are currently more than four times higher than those in the D.C. Metropolitan area and were more than ten times higher only a decade ago.
The chart based on Statista data goes back to 2013. Annual PM2.5 levels during 2008-2012 were comparable to those during 2013-2015. Going back further, Beijing had an annual PM2.5 level of 147 micrograms per cubic meter (µg/m ) in 2002. Clearly, the elderly in Beijing have inhaled much higher doses of ambient PM2.5 than Arlington County residents over the past two decades, yet average life expectancies are approximately equal. How does that information square with the EPA’s assessment that US ambient PM2.5 levels pose significant mortality risks? The EPA did not respond.
Commenters also noted that if ambient PM2.5 concentrations are as lethal as the EPA contends, cardiovascular mortality from cigarette smoking should be much higher than it is. Pope et al. (2009) struggled to explain that anomaly. As they point out, the average smoker inhales 7 to 17.5 milligrams of PM2.5 per cigarette—roughly 1,000 times the mass of PM2.5 in a cubic meter of outdoor air in the US. Why then are smokers not dropping like flies from heart disease?


Pope et al. (2009) conclude that the “exposure-response relationship between cardiovascular disease mortality and fine particulate matter is relatively steep at low levels of exposure and flattens out at higher exposures.” In other words, they postulate that PM2.5 kills at small doses but that each additional dose does less harm as consumption increases. Do other toxins work that way? The EPA did not respond.
A study in the New England Journal of Medicine reported that people who stop smoking by age 35 have a normal life expectancy, which translates to about 80 years for a US white female. Assuming such an individual had smoked half a pack of cigarettes per day until her 35th birthday, she would have inhaled over four pounds of PM2.5. Science writer Steve Milloy poses this question: What does it say about the lethality of PM2.5 on a long-term basis if a non-smoker and smoker can have the same life expectancy despite the vast differences in PM2.5 inhaled—two sugar packets versus a four-pound bag’s worth, respectively? Milloy illustrates the question with this photo:
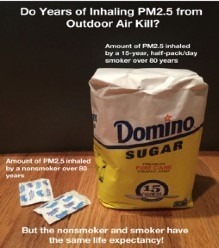
Commenters sent Milloy’s question and photo to the EPA. The agency did not respond.
Non-independent advisory panels
Section 109(d) of the Clean Air Act requires the EPA to appoint a seven-member “independent scientific review committee” known as the Clean Air Scientific Advisory Committee. CASAC’s job is to help the EPA appraise the adequacy and scientific basis of existing, new, or revised air quality standards—an exercise the agency is required to undertake every five years.
The EPA, or CASAC with EPA’s permission, may form subcommittees or work groups to address specific NAAQS related issues. Several members of the 2005 and 2010 particulate matter subcommittees were substantial recipients of EPA research grants. Eight out of nine members of the 2005 fine PM subcommittee were affiliated with the EPA funded PM research centers, and “every EPA fine PM center director was on the panel.” By 2010, the EPA had “essentially eliminated” from the PM2.5 subcommittee “any scientist who was not EPA-funded and/or affiliated with an EPA center.”
That pattern continues. Of the 19 members of CASAC’s 2021 Lead Review Panel on revising fine PM air quality standards, twelve were affiliated with organizations receiving EPA grants of hundreds of thousands to millions of dollars. Seven members had received multiple grants. Panel Chair Lianne Sheppard, who also chairs CASAC, is affiliated with the University of Washington’s PM center, where she and colleagues have received over $53.5 million in EPA grants since 1999.
Advisors affiliated with institutions that are substantially funded by the EPA are not in the best position to offer independent advice on policy-relevant scientific issues before the agency.
Grading their own homework
“No man is allowed to be a judge in his own cause; because his interest would certainly bias his judgment, and, not improbably, corrupt his integrity,” James Madison wrote in Federalist No. 10. The principle Madison invokes, often expressed as Nemo Judex In Causa Sua (“no one should be a judge in his own cause”), is a rule of natural justice derived from Roman law and formalized by English Common Law jurist Edward Coke in the 17th Century.
A pillar of the American judicial system, the principle requires judges to recuse themselves from any case in which they have, or appear to have, a vested interest in the outcome.
Being a rule of reason, the principle applies to many situations outside the courtroom. The owner of a baseball team should not also serve as umpire of the game. Similarly, in endeavors dealing with the acquisition or production of knowledge, no one should grade his own homework. Yet the EPA’s advisors and peer reviewers often do just that.
Regarding the CASAC members affiliated with the EPA-funded PM centers, Professor Johnston comments: “By performing the research, summarizing what they deem relevant, and then recommending expensive policies, these centers are judge, jury, and executioner in one person.”
Self-grading is also endemic to EPA’s climate science work. The EPA’s December 2009 Endangerment Finding underpins all the agency’s greenhouse gas regulatory activity. The Finding lists three “major assessments” as its “primary scientific and technical basis”: the 2007 Fourth Assessment Report (AR4) of the Intergovernmental Panel on Climate Change (IPCC), the 2009 National Climate Assessment (NCA) of the U.S. Global Change Research Program (USGCRP), and various reports by the National Research Council (NRC).
The EPA selected 12 individuals to peer review the Endangerment Finding’s Technical Support Document (TSD). Each had served as author or reviewer of one or more of the “major assessments.” Four had worked on all three assessments. For example, Virginia Burkett was an author of the AR4 report on climate change impacts, author of the 2009 NCA report, reviewer of an NRC report on the potential impacts of climate change on US transportation systems, and an author of reports on GHG emission scenarios, climate models, sea-level rise, and US transportation system climate vulnerabilities for the U.S. Climate Change Science Program (CCSP)—the USGSRP’s name during 2002-2009. The EPA “effectively asked” all 12 TSD reviewers “to judge their own work.” At the risk of belaboring the obvious, those reviewers were also positioned to judge their critics’ work.
Statistical significance
“Data manipulation” is not forgery or outright fraud. The term refers to a variety of computational tricks that produce the illusion of statistical significance where none exists.
Statistical significance is a somewhat paradoxical concept. For example, in an epidemiological study of the health effects of PM2.5 air pollution on a population cohort, researchers do not directly estimate the probability that some level of exposure increases illness or death. Rather, they try to determine the probability that an observed correlation between PM2.5 exposure and an adverse health effect is not due to random chance.
In other words, researchers try to refute the “null hypothesis”—the assumption that no relationship exists between the predictor (exposure) variable and the outcome (health effect) variable. Refuting the null hypothesis builds evidence that an observed correlation is statistically significant, hence that it may reflect a causal relationship.
In most scientific studies, a correlation is deemed to be statistically significant if there is less than a 5 percent probability that it is due to chance. Thus, the threshold of statistical significance is expressed as p < 0.05. Correspondingly, probability estimates are known as “p-values.”
As noted, funders typically want to see “positive” results from their investment, academic departments want their research grants renewed, researchers want to be published, and journals want to be newsworthy. Accordingly, the entire research eco-system favors the production and publication of studies reporting statistically significant (p < 0.05) correlations rather than null results.
The bias in favor of finding and publishing results with low p-values not only encourages researchers to exaggerate the probability or strength of reported effects. It also hides information about what is not true. There is value in knowing that a disease is not caused by a suspected pathogen, or, conversely, that an apparently promising therapy is not effective.
The value of negative results is well known. Nonetheless, researchers face continual financial and professional pressure to publish positive results, and data can easily be manipulated to make chance outcomes look significant.
Data manipulation
Clinical pharmacologist Chittaranjan Andrade has written a clear explainer on data manipulation. P-Hacking is the most common form. In P-Hacking, the researcher keeps analyzing the data “until a statistically significant outcome is obtained.” The objective is not to test a hypothesis but to find correlations with p-values lower than 0.05.
A common way to do that is to “experiment with different statistical approaches to test a hypothesis.” For example, the researcher may divide up the subject population by gender, age, ethnicity, marital status, employment, body mass, income, education, etc. He may look for effect correlations one day, two days, one week after exposure, etc. He may “include or exclude” potentially confounding variables. “The researcher then reports only the approach that led to the desired result.”
Including or excluding potential confounders can massively affect purported statistical significance. For example, in late March 2020, four researchers at the Harvard T.H. Chan School of Public Health published a study purporting to link long-term PM2.5 exposures to COVID-19 deaths. The authors did not wait for peer-review before releasing the study. The study estimated that each 1 microgram per cubic meter (µg/m3) increase in long-term PM2.5 exposures accounts for 15 percent of all US COVID-19 deaths. They subsequently reduced the estimate to 8 percent.
Politics may have been a factor in the study’s early release. EPA Administrator Andrew Wheeler was expected soon to propose retaining rather than tightening the existing PM2.5 NAAQS. Regulatory activists cited the Harvard study as confirming the urgent need for stronger PM2.5 standards.
The researchers claimed they had accounted for all relevant confounders. However, they left out one of the most obvious: transit ridership. Daily commuting in crowded trains and buses increases one’s exposure to airborne viruses.
In June 2020, the National Bureau of Economic Research published two papers reanalyzing the Chan study. One reanalysis found that the statistical significance of the purported PM2.5 correlation with COVID-19 mortality disappears when the “striking and robust relationship” between death rates and transit use is considered. The other reanalysis found that elevated rates of COVID-19 mortality in African American and First Nations populations were not associated with “differences in income, poverty rates, education, occupational mix, or even access to healthcare insurance” but rather with “the use of public transit.”
Whether P-Hacking or carelessness explains the spurious PM2.5—COVID mortality correlation, the example illustrates how easily epidemiological research can be tailored to produce the illusion of statistical significance and policy relevance. It also underscores the importance of transparency and reproducibility testing. To their credit, the Chan researchers made their data and code publicly available.
A more extreme form of data manipulation is HARKing—Hypothesizing After Results Are Known. HARKing occurs when “a researcher analyzes data, observes a (not necessarily expected) statistically significant result, constructs a hypothesis based on that result, and then presents the result and the hypothesis as though the study had been designed, conducted, and analyzed or at least oriented to test that hypothesis.”
HARKing is illegitimate because it presents as confirmatory a result that is only exploratory—a result that may be due to sheer chance. A hypothesis obtained by HARKing is not informative until statistical significance is found in a new study examining a different population cohort, different group of patients, or different collection of lab animals.
A similar form of data manipulation is outcome switching. In such cases, the published version of a study does not report outcomes the researcher originally undertook to investigate but rather other outcomes not predicted before data collection began. Ritchie likens an outcome switcher to a boy who shoots holes in the side of a barn, secretly paints a bull’s eye around each hole, and proclaims himself a Texas Sharpshooter.
Outcome switching is most easily detected in randomized clinical trials. The FDA requires clinical researchers to specify their hypothesis and expected primary and secondary outcomes in a publicly accessible registry, before the first patient is enrolled. In theory, registries deter publication bias (sending studies with negative results to the “file drawer”) and selective outcome bias (reporting only results favored by the researchers).
Unfortunately, peer reviewers seldom compare registered and journal article versions of clinical trials, and many journals fail to enforce their registry policies. Nonetheless, widespread discrepancies have been found. Ben Goldacre’s Compare-Trials project examined all clinical trials published in five high-impact medical journals from October 2015 through January 2016. Of 67 trials, nine reported just the outcomes specified in their registries. The other 58 trials reported nothing about 354 registered outcomes and instead reported 357 outcomes furtively added after trials began. Ritchie reasonably speculates that the 354 non-reported registry outcomes had p-values larger than 0.05.
Unenforced quality control requirements
Epidemiological researchers face even less pressure than clinical researchers to register their analysis protocols prior to collecting data, archive the raw data prior to data cleaning and analysis, record changes in research questions, and report all results, negative as well as positive.
The result is a permissive environment for publication bias, P-Hacking, and other trickery. S. Stanley Young explains:
Environmental epidemiology essentially has few, if any, analysis requirements. In an environmental observational (EO) study, the researcher can modify the analysis as the data is examined. Multiple outcomes can be examined, multiple variables (air components) can be used as predictors. The analysis can be adjusted by putting multiple covariates into and out of the model. It is thought that effects can be due to events on prior days so different lags can be examined…. Seldom, if ever, is there a written, statistical protocol prior to the examination of the data. With these factors (outcomes, predictors, covariates, lags), there is no standard analysis strategy. The strategy can be try-this-and-try-that.
Although lack of a preregistered research design is a sign of potential data manipulation, it also makes manipulation harder to detect, because researchers’ actual steps cannot be compared to an original analytic baseline. Failure to record any significant step can render a study non-auditable and irreproducible.
Effects of multiple testing and modeling
An underappreciated point is how easily statistical significance can be contrived just by multiplying the number of potential correlations examined. Ritchie explains:
The p < 0.05 threshold means that if our hypothesis is false (if the null hypothesis is true), then 5 percent of the time we’ll get a false-positive result. But that 5 percent value is for a single test. Some straightforward math shows that in a world where our hypothesis is false, increasing the number of statistical tests snowballs our chances of obtaining false-positive results. If we run five (unrelated) tests, there is a 23 percent chance of at least one false positive; for twenty tests, it’s 64 percent.
Environmental epidemiological studies can include hundreds, thousands, and even larger numbers of statistical tests. The term of art is Multiple Testing and Multiple Modeling (MTMM). Young et al. (2021) attempt to quantify the MTMM “search space” in each of 70 environmental epidemiology papers. Search space is a product of the number of outcome variables (e.g. health effects) times the number of predictor variables (e.g. pollutants of concern) times 2 to the power of the number of covariates (other factors that might influence the outcome). In a formula, search space = O x P x 2C.
Young et al. (2021) estimate that the median search space in the 70 studies exceeds 13,000 questions. That has two important implications. First, with a search space of 13,000 questions, there is a 5 percent probability of generating 650 “statistically significant” results that are actually false positives produced by sheer chance.
Second, the true threshold of statistical significance is no longer 0.05. It must be adjusted with the correction devised by Italian mathematician Carlo Emilio Bonferroni. The Bonferroni correction is simple: divide 0.05 by the number of statistical tests. Thus, if five statistical tests are run on a single dataset, the significance threshold for any association discovered is 0.05/5 = 0.01. In other words, to be significant, the probability of an association occurring by chance must be less than one percent.
If the search space is 13,000, a correlation is significant only if the probability of obtaining it by chance is less than 0.000385 percent.
When the EPA funds epidemiological studies, it does not require researchers to quantify their search space and apply the Bonferroni correction. Nor does the EPA apply the Bonferroni correction to studies it assesses.
EPA does not use p-value plotting
P-values range from 0.0 to 1.0. Both the p-value of each statistical test (question) in a single study and the overall p-value of each study included in a meta-analysis can be plotted on a graph. In a single study where the predictor and outcome variables have no real relationship, plotting the p-values of each test forms a line rising at a 45-degree angle (slope = 1). That is because the null hypothesis is true; hence every correlation between two variables has an equal probability of occurring.
For example, the graph below is a p-value plot derived from a study attempting to find whether women who eat any of 131 different foods have a higher probability of conceiving a male baby. The hypothesis is biologically implausible because it is the X or Y chromosome from the male parent, not anything the female ate before or during pregnancy, that determines the sex of the child.
Unsurprisingly, the p-values from the study’s 262 survey questions form a line rising approximately at a 45-degree angle:
P-value Plot, 262 P-values, Drawn from Food Frequency Questionnaire, Questions Concerning Boy Baby Conception
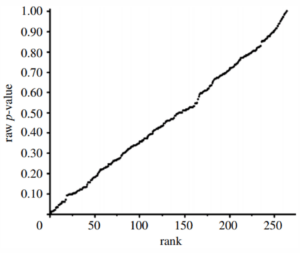
Source: Young et al (2008).
In contrast, plotting the p-values of 102 epidemiological studies of cigarette smoking and lung cancer reviewed by Lee et al. (2012) produces a single line with almost all datapoints well below 0.05.
P-value Plot, 102 Studies, Association of Smoking and Squamous Cell Carcinoma of the Lungs
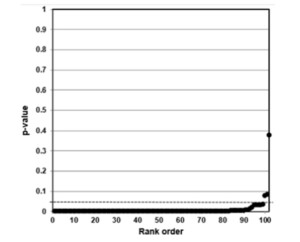
Source: Young et al. (2021)
What happens when p-value plotting is applied to air pollution meta-analyses? Young et al. (2021) plotted the overall p-value of each study included in metanalyses examining relationships between air pollutant exposures and all-cause mortality, heart attacks, asthma development, and asthma attacks. The p-value of each individual study is plotted as a dot on a graph with p-values rising from 0.0 to 1.0 on the Y axis and the study’s place in the rank order of p-values (lower to higher) shown on the X axis. In all cases, the plots are bilinear. The dots form one line suggesting statistical significance, and another line suggesting randomness.
For example, below is the p-value plot derived from Mustafic et al. (2012), a meta-analysis of studies examining potential relationships between six air pollutants and heart attacks. For each pollutant, the plots are bilinear.
P-value plots, six air quality components, air quality,-heart attack meta-analysis
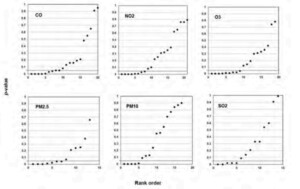
Source: Young et al. (2021)
Although a bilinear plot is not direct evidence of publication bias or data manipulation, it raises legitimate suspicions. Such plots have little biological plausibility. Given the financial and professional incentives described above, it is more likely that statistical significance will be contrived out of randomness than that real relationships will be made to look random.
The EPA does not conduct p-value plotting to detect potential publication bias and data manipulation. Nor does it require EPA-funded researchers who conduct meta-analyses to apply that diagnostic.
What EPA scientific integrity policies should look like
A modernized EPA would educate Congress and the public about the nature, extent, and seriousness of the reproducibility crisis, beginning with its Scientific Integrity Policy, which currently ignores the issue entirely.
The agency would implement procedural requirements to increase the transparency and reproducibility of studies it funds or assesses for regulatory purposes. Such reforms would chiefly target data secrecy, publication bias, and data manipulation.
To curb cherry picking, the EPA would be required to consider all replication studies and all studies with negative results if they conform to the strict new quality control standards.
The EPA would implement policies to increase the independence and viewpoint diversity of its science advisory panels. Moreover, science advisory panels would advise the agency strictly on scientific issues, not matters of law or policy.
However, there are limits to what procedural requirements can accomplish given the EPA’s outsized role as the nation’s dominant funder and interpreter of air pollution research. Congress should consider options to decentralize air pollution research funding.
The next section details key science quality and integrity issues Congress should address. Each key issue includes specific recommendations.
Key issue
Require disclosure sufficient for replication
Complete transparency of all phases of a study—hypothesis and outcome selection, research design, data collection, data cleaning, data analysis, and results reporting—enables independent researchers to check the math. Transparency both deters questionable research practices and facilitates their detection. By encouraging researchers to report all results, transparency also curbs publication bias.
Recommendations for Congress
Prohibit the EPA from funding PM research or using such research to determine air quality standards or other critical metrics, unless all research materials are sufficiently transparent to facilitate independent validation. Under this reform, which we may call the “Scientific Integrity in Rulemaking Act,” researchers would be free to publish any study or report any findings they wish. However, if they want the EPA to fund their study, or use it to determine air quality standards or other critical metrics, the authors must provide a clear audit trail covering all phases of their research. The authors’ data and methods must be sufficiently transparent to facilitate—not merely allow—independent validation.
- Compliant studies would meet the following verifiable criteria:
- The study’s hypothesis and research design are timestamped and archived prior to any data being collected.
- The original data are timestamped and archived prior to being cleaned.
- All models and code are accessible to reviewers, and any changes in research questions and methods are duly recorded.
- All results, negative as well as positive, are archived and reported.
McCullough and McKitrick (2012) propose a similar checklist of verifiable requirements:
- The data have been published in a form that permits other researchers to check it;
- The data described in the article were actually used for the analysis;
- Computer code used for numerical calculations has been published or is made available for other researchers to examine;
- The calculations described in the paper correspond to the code actually used;
- The results listed in the paper can be independently reproduced using the published data and methods;
- If empirical findings arise during the analysis that are materially adverse to the stated conclusions of the paper, this has been acknowledged in the article and an explanation is offered to reconcile them to the conclusions.
“At present,” McCullough and McKitrick observe, “readers of a study have no way of knowing which, if any, of the above conditions hold, without doing a great deal of work checking into such things themselves. And if the data and methods are not published, such checking is effectively stymied.” Indeed, they opine, if conditions (a) through (d) are not met, “then the academic debate cannot even begin, since other researchers will not have access to the research materials.” As there is no shortage of disputation, McCullough and McKitrick presumably mean that unless other investigators have full access to the research materials, a proper debate cannot begin—one with the potential to resolve disputed questions.
Creating strong new incentives to produce auditable studies would discourage P-Hacking, HARKing, and outcome switching. Facilitating independent review would motivate researchers to be diligent in handling and analyzing data, objective in drawing conclusions, and balanced in reporting results. Reporting negative results would help curb publication bias. Expanding the market for replication studies would produce more knowledge of what is not true. That, in turn, would help steer future research in more useful directions.
An obvious question is whether litigants could cite the new standards to challenge existing rules based on non-transparent, non-reproducible research. Yes. It is unreasonable to grant permanent immunity to regulations informed by research that cannot survive independent scrutiny. Relitigating issues that once seemed settled may displease business leaders who value regulatory predictability more than regulatory efficiency. However, in the long run, prioritizing science quality should make regulation more stable and less vulnerable to litigation.
To avoid excessive administrative burden, EPA reviews of previous rules to determine the reproducibility of their scientific basis should coincide with the agency’s regularly scheduled reviews of existing pollution standards, as Young et al. (2021) recommend. Such retrospective reviews should also target the most influential studies underpinning the most consequential regulations. The authors should receive ample time to make available all research materials required for reproducibility testing. If they decline to do so, or the study’s results do not replicate, the EPA should “withdraw the regulation, if not in haste, then with all deliberate speed.”
If the comprehensive reform package outlined above is not adopted, Congress should:
Make data access a condition for receiving an EPA research grant or using a study to determine air quality standards or other critical metrics. This reform, which might be called the “Enhance Data Access Act,” is a subset of the Scientific Integrity in Rulemaking Act described above.
The public pays for much of the health data used to develop regulations. Those regulations, in turn, may impose costs on the public in the form of higher consumer prices, lower wages, reduced innovation, and restricted liberty. Thus, transparency advocates have long argued that the public’s right to know extends, in some form, to the health data underpinning regulatory decisions.
As the EPA’s April 2018 proposed transparency rule put it: “When EPA develops significant regulations using public resources, including regulations for which the public is likely to bear the cost of compliance, EPA should ensure that the data and models underlying scientific studies that are pivotal to the regulatory action are available to the public.”
In addition, there are clear downsides to data secrecy and upsides to data access. Keeping regulatory data inscrutable weakens quality control and encourages questionable research practices. Enhancing data access can “lead to better outcomes and strengthen public confidence in the health and environmental protections underpinning EPA’s regulatory actions.”
Concerns about divulging personal medical information are exaggerated. Reviewing decades of technological development, the National Research Council concluded that data access can be increased “without damage to privacy and confidentiality rights.” The 2018 transparency proposal described several ways to increase data access while protecting patient privacy:
These mechanisms may range from deposition in public data repositories, consistent with requirements for many scientific journals, to, for certain types of information, controlled access in federal research data centers that facilitate secondary research use by the public…. These strategies should be cost-effective and may also include: Requiring applications for access; restricting access to data for the purposes of replication, validation, and sensitivity evaluation; establishing physical controls on data storage; online training for researchers; and nondisclosure agreements.
Cecil and Griffin (1985) note that the Privacy Act was intended to “correct administrative abuses of identifiable records” under the Freedom of Information Act. However, “no instance of research abuse of identifiable records was cited.” That is not surprising. As Milloy observes, “no bona fide researcher is interested in such information since it has no particular scientific value.”
Besides, if the original researchers could be trusted not to divulge PII, why not independent reviewers bound by identical nondisclosure agreements?
Facilitate independent review before a study is selected to inform rulemaking. Once a study has been cited in a proposed rule, administrative convenience, policy commitments, or reputational pride may impel the agency to discount research flaws discovered after the fact. The best time to audit an epidemiological study is before the EPA chooses to rely on it.
If the EPA funds an environmental epidemiological study, or intends to use it in rulemaking, the agency should first take physical possession of the dataset and make it available for independent review. For highly influential or pivotal studies (as defined below), the data should be available to independent investigators for one year before the EPA proposes a rule informed by that research. This requirement might be called the “Adequate Data Review Period Act.” It would strengthen the two previous reforms and should be enacted separately if those are not adopted.
Whether the previous reforms are adopted or not, Congress should:
Require the EPA to weigh studies according to their reproducibility. This reform, which might be called the “Prioritize Reproducible Research Act,” is a modified version of the EPA’s short-lived Transparency Rule. That rule required the EPA to give “greater consideration” to studies with accessible dose-response data and “lesser consideration” to studies with inaccessible data.
Because literally thousands of environmental studies are published every year, the Transparency Rule confined its scope to “pivotal science.” The EPA initially defined pivotal science as “the studies, models, and analyses that drive the magnitude of the benefit-cost calculation, the level of a standard, or point-of-departure from which a reference value is calculated.” The final transparency rule defined pivotal science as “the specific dose-response studies or analyses that drive the requirements or quantitative analyses of EPA significant regulatory actions or influential scientific information.”
Placing more weight on reproducible studies is a sensible policy. The Transparency Rule distinguished between replicable and non-replicable studies. It should also have distinguished between replicated studies—those that have been independently validated—and replicable studies—those that have not yet been replicated but are sufficiently transparent to allow independent validation. Other things equal, in proposed rules, independently validated studies should be given greater consideration than replicable studies. The latter, in turn, should be given greater consideration than studies that fail replication tests or cannot be tested due to inaccessible data or code.
Prioritize quality over quantity in weight-of-evidence assessments. This reform is implicit in the Prioritize Reproducible Research Act discussed earlier, but the EPA and courts may balk at this policy unless it is spelled out in its own statutory provision.
Weight-of-evidence review easily becomes a popularity contest in which the hypothesis with the largest number of supportive studies wins. Since the EPA is the principal financer of environmental epidemiology, it is a foregone conclusion that most published studies will support the EPA’s policy views.
This reform, which might be called the “Quality Over Quantity Act,” would clarify that it is the quality of the underlying studies, not their sheer number, that determines the adequacy of a rule’s purported scientific basis.
Whether the previous two reforms are adopted or not, Congress should:
Require each rulemaking to include a table showing whether the studies cited meet reproducibility criteria. The number of studies cited could be quite large, producing a table with many rows. The number of reproducibility criteria, arranged in columns, would be comparatively small—perhaps 10 or less.
For example, in column 1, the EPA would report whether the study has a timestamped preregistered hypothesis and research plan; in column 2, whether the study has a timestamped archive of the original data prior to data cleaning; in columns 3, 4, and 5, whether all data, models, and code are accessible for independent review; in column 6, whether all results, negative as well as positive, are reported; in column 7, whether changes in research methods are duly recorded; in column 8, whether the study has been tested for reproducibility; in column 9, whether researchers estimated the study’s search space; in column 10, whether researchers applied the Bonferroni correction when determining statistical significance.
This reform might be called the “Reproducible Science Checklist Act.”
Require correction for the effects of Multiple Testing and Modeling. This reform, which might be called the “Truth in Regulatory Reporting Act,” would enhance every other reform discussed above. It should be paired with them or adopted as a standalone measure if no others are adopted.
As explained above, the search space in a typical epidemiological study is vast, with many studies examining thousands of potential relationships. As search space grows, so does the probability of false positive results. The same math dictates that as search space increases, the threshold of statistical significance decreases.
For each pivotal study, the EPA should be required to estimate and report the search space (i.e., the total number of statistical tests), the probable number of false positives (0.05 multiplied by the number of tests), and the threshold of statistical significance per the Bonferroni correction (0.05 divided by the number of tests).
The Truth in Regulatory Reporting Act would help the public understand how easily chance correlations can be made to look statistically significant and why the actual threshold of statistical significance is often far below 0.05.
Require p-value plotting to detect publication bias and data manipulation in meta-analyses. This reform, which might be called the “P-Hacking Detection Act,” should also be combined with all the other reforms discussed above or enacted separately if no others are adopted.
As previously explained, when the p-value of each study in a meta-analysis is plotted on a graph, and the form of the plot is bilinear, we are entitled to suspect that overall statistical significance is a product of publication bias and/or data manipulation. In such cases, the EPA should not count the meta-analysis as evidence until independent reviewers have validated the component studies with the low p-values.
Note, this diagnostic is fallible. As publication bias and data manipulation get closer to purging all studies with null results, the associated p-value plot will increasingly form a single line with most p-values < 0.05.
Key issue
Curb publication bias
Requiring researchers to archive and report all results, negative as well as positive, would help curb publication bias, while requiring the EPA to use p-value plotting would help detect it. Requiring the EPA to give more weight to replicated and reproducible studies could also alleviate publication bias. However, such quality control measures would leave intact the EPA’s outsized influence as the nation’s chief financer of air pollution research.
The financial dependence of academic research on agenda-driven agencies is a government-wide problem that predates the EPA’s creation. Notably, in his 1961 Farewell Address, President Dwight D. Eisenhower warned that federal funding could both corrupt the scientific community and undermine democratic accountability.
Because a “steadily increasing share” of scientific research “is conducted for, by, or at the direction of the Federal government,” a government contract has become “virtually a substitute for intellectual curiosity,” Eisenhower observed. With federal funding comes the danger of federal control. In his words: “The prospect of domination of the nation’s scholars by Federal employment, project allocations, and the power of money is ever present—and is gravely to be regarded.”
Eisenhower’s admonition to “guard against the acquisition of unwarranted influence, whether sought or unsought, by the military-industrial complex,” is well known. Less remembered is his exhortation to “be alert to the equal and opposite danger that public policy could itself become the captive of a scientific-technological elite.”
During the past quarter century, federal agencies have provided nearly all funding for climate change research, while the EPA has provided the lion’s share of air pollution research dollars. Thus, most research in those fields is “conducted for, by, or at the direction” of the federal government.
Given the economic and political significance of climate and air pollution policies, it is predictable that (a) federal agencies will preferentially fund researchers who share the agencies’ policy goals, (b) universities will preferentially hire and promote scientists who win federal agency grants, and (c) journals will preferentially select peer reviewers affiliated with agency-funded research programs.
Publication bias is pervasive and entrenched because funding is massive and centralized in Washington, D.C. A solution readily suggests itself: decentralize air pollution and climate research funding. Since federal climate science research is spread across ten agencies comprising the USGCRP, and the EPA has a relatively small part of the action ($8 million out of $3.754 billion in FY 2022), the recommendations below apply chiefly to the EPA’s funding of PM health effects research.
Recommendations for Congress
Replace the EPA-centric research funding regime with a decentralized system. Congress should phase out EPA funding of the seven PM centers and HEI. State environmental agencies, non-governmental organizations, and for-profit companies should increasingly assume responsibility for PM health effects research. This reform might be called the “Diversify Funding of Environmental Research Act.”
Some may blanche at the prospect of a coal company ‘buying’ an air pollution study. Isn’t that a conflict of interest? Yes, it is. However, the EPA-centric regime is also conflicted.
To begin with, the EPA is conflicted simply by virtue of being a regulatory agency. Rulemaking is an adversarial process. In regulatory proceedings, the agency is always the primary stakeholder, the most interested party, the big dog in the fight. The agency is in the arena, not above the fray. No matter how honest its leadership and staff may be, the agency is an advocate, not an honest broker.
Beyond that generic reality, the EPA is conflicted in more specific ways. The EPA funds and interprets the research justifying the rules it promulgates and enforces. It often funds the research of the science advisors it appoints to provide “independent” advice. It hires and pays administrative law judges to preside over the prosecution of persons accused of violating EPA rules.
The aim of decentralization is not to banish self-interest from policymaking, which is impossible, but to foster diversity and competition among a larger pool of funders and researchers. An analogy is the Framers’ extended commercial republic, which curbs the “violence of faction” not by trying to abolish faction, the causes of which are “sown in the nature of man,” but by multiplying the number and variety of factions.
The choice facing Congress is not between interested and disinterested environmental research but between funding that reflects a single dominant interest and funding that reflects a multiplicity of interests. Decentralized funding would, over time, allow a competitive marketplace of ideas to replace the current cartelized marketplace.
The agency’s traditional allies have ample resources to compete in an open market. Consider the following numbers. The EPA’s FY 2024 Budget request for its Air, Climate, and Energy Research program is $137,835,000. That is a princely sum for a single funder, making the EPA the PM research industry’s financial center of gravity. However, $137.8 million is barely three percent of the annual gross receipts of the nation’s top 25 environmental NGOs ($4.7 billion). The New York Department of Environmental Conservation’s budget for 2021 was $7.8 billion. The land-based segment of the US wind power industry invested $12.5 billion in 2022. Harvard University’s endowment in 2023 was estimated at $50.9 billion.
However, Congress should not create a matching grant program to subsidize state, NGO, or corporate funding of PM health effects research. Federal subsidies would come with federal strings, spawning another era of centralized publication bias.
The goal of diversifying environmental research funding is to enable all studies to compete on a level playing field, regardless of who funds them, provided the grants meet federal legal requirements and the studies are evaluated under the quality control standards outlined above.
If full decentralization of PM research funding is not adopted, Congress should:
Limit EPA funding of PM research to the construction of datasets. Under this proposal, which might be called the “Independent Dataset Construction Act,” the EPA would finance the building of population cohort datasets, which is a major expense, take possession of the datasets, and maintain them in a secure archive. However, the EPA would not fund, directly or indirectly, the analysis of the data. Any qualified researcher or research group would be free to analyze the data but with grants obtained from state environmental agencies, NGOs, or for-profit businesses. No researcher or group analyzing the data would have a direct financial interest in advancing the EPA’s policy agenda.
If that reform is not adopted, Congress should:
Require the EPA to set aside a percentage of PM health effects grants for replication studies. Only researchers and organizations genuinely independent from the original authors would be eligible to compete for replication grants.
This is an inferior policy to the diversification options outlined above. The EPA would continue to be the largest funder of both dataset construction and analysis. Consequently, it would still exert central direction over PM health effects research. However, a set-aside of 10 percent or more would at least create a market space for studies that are marginalized under the current funding system.
Key issue
Curb cherry picking
Under the Administrative Procedure Act, as interpreted by the Supreme Court, a rulemaking is arbitrary and capricious if the agency “entirely fail[s] to consider an important aspect of the problem.” Selective exclusion of disfavored studies enables an agency to duck important aspects of a regulatory problem.
To be sure, no agency can review all studies, and some studies are not worth considering. Nonetheless, that does not mean cherry picking cannot be distinguished from winnowing based on valid quality control concerns or administrative necessity. For example, Calabrese and Agathokleous (2021) find that the EPA ignores an ever-growing body of evidence (6,000-plus studies) that, at very low doses, radiation and other toxic agents can beneficially stimulate the immune system—a phenomenon known as “hormesis.”
As discussed earlier, research results that are not repeatable are not really science. The distinction between reproducible and irreproducible research is objective and verifiable. Congress should clarify that ignoring or giving short shrift to replicated and reproducible studies in favor of non-transparent irreproducible studies is prima facie evidence of cherry picking.
Recommendations for Congress
Strengthen the Information Quality Act. Congress enacted Section 515 of the FY 2001 Consolidated Appropriations Act (P.L. 106-554), commonly known as the Information Quality Act (IQA). This law directed the Office of Management and Budget (OMB) to issue government-wide guidelines, and each agency to issue agency-specific guidelines, establishing standards and procedures to improve the quality of agency-disseminated information. In OMB’s guidelines, objectivity (e.g. accuracy, lack of bias in presentation and content) is the leading element in the overall definition of quality, which also includes utility (value to users) and integrity (security from tampering).
The IQA has been a toothless tiger. As interpreted by a federal district court in Salt Institute v. Tommy Thompson (2004), “Neither the Act itself nor its very limited judicial history provide a mechanism for judicial review of information quality or any avenue for judicial relief.”
Under the IQA, each agency is to establish administrative mechanisms allowing affected persons to seek and obtain correction of information maintained and disseminated by the agency that does not comply with its information quality guidelines. However, the Act specifies no legal consequences, not even for agency-disseminated information that is inaccurate or biased in content or presentation.
Congress should amend the IQA to:
- Clarify that the requirements of the IQA, including the right to seek and obtain correction, are legal requirements that must be met by agencies, and are subject to judicial review.
- Codify the ruling in Motor Vehicle Mfrs. Ass’n that failure to consider “an important aspect of the problem” renders a rulemaking arbitrary and capricious.
- Clarify that selective exclusion of reproducible research is one form of such failure.
This reform might be called the “IQA Modernization Act.”
Facilitate public hearings on the scientific basis of rules. The Administrative Procedure Act (APA) authorizes two types of rulemakings, “formal” and “informal.” Nearly all regulatory determinations are made through “informal” rulemakings. The usual pattern is for the agency to publish a notice of proposed rulemaking (NOPR) in the Federal Register. The NOPR presents the proposal’s factual and legal basis, specifies a comment period, and invites public input. The agency subsequently publishes a final rule along with updated supporting analyses and responses to comments.
A formal rulemaking is a trial-like proceeding (“public hearing”) in which opposed parties testify under oath, present oral and documentary evidence, and cross-examine each other before an administrative law judge (ALJ) or other hearing officer. The officer has authority to “issue subpoenas for evidence and witnesses, rule on evidentiary and procedural matters, hold settlement conferences, order parties to submit to alternative dispute resolution, and make final decisions regarding the rule.” The officer may not have ex parte contact or communication with other agency officials during the proceeding.
The hearing officer’s decision “typically becomes the final rule” and “may be subject to review by a higher court.” The record for decision is “exclusive,” meaning the officer’s decision must be based solely on the evidence and testimonies presented at the hearing.
No formal rulemaking has been held since the early 1970s, partly because, like other forms of litigation, such proceedings can drag on interminably and obsess on issues of no particular concern except the parties directly involved. For example, the Federal Drug Administration’s “notorious” Peanut-Butter Rule “took more than a decade of protracted proceedings to decide whether peanuts must comprise 87 percent or 90 percent of peanut butter.”
However, the proposal here is not to convene a formal rulemaking—a process designed to settle all legal challenges to a regulatory proposal, including by means of negotiations. Rather, the idea is to create a judicial forum in which an agency and its critics can have an officiated, on-the-record debate, with sworn testimony and cross examination overseen by a hearing officer, about the scientific basis of the agency’s regulatory proposals.
Such a forum would be an inhospitable environment for cherry picking. Petitioners could summarize studies the agency ignored or depreciated in the proposed rule, challenge the agency’s selection or interpretation of the relevant science, and critique studies on which the agency relied. In the presence of opposing counsel and under judicial supervision, an agency would have to address petitioners’ case on the merits. Although the hearing would not culminate in a legal determination, critics of a rulemaking’s scientific basis would have their “day in court” in the form of an officiated scientific debate. Ideally, such debates would inform public comments on proposed rules and could be cited in subsequent litigation on final rules.
Under this reform, which might be called the “Level Playing Field in Regulatory Science Act,” Congress would create a process whereby interested parties may petition the EPA to convene public hearings on the scientific basis of its rulemakings.
Important details would need to be worked out. Exactly what role would the administrative law judge or hearing officer play in such proceedings? Would the officer primarily state the questions before the court and enforce rules of conduct and evidence? Or would the officer also deliver a final verdict on the merits of the parties’ conflicting views? If the latter, what legal consequence would the officer’s judgment have either directly on the rulemaking at issue or indirectly on subsequent litigation in other courts?
Other details require clarification as well. Should petitioners be limited to challenging the scientific basis of “major” (≥$100 million) or “high impact” (≥$1 billion) rules? Although cost should be a factor, even a minor rule may raise important scientific issues.
In general, public hearings should examine what the Transparency Rule called “pivotal science” and what the EPA’s 4th Edition Peer Review Handbook and U.S. Office of Personnel Management call “influential scientific information” (ISI).
All or nearly all scientific and technical work products on which the EPA relies to regulate PM, regulate greenhouse gases, or calculate the social cost of carbon qualify as influential scientific information or highly influential scientific assessments.
Send the EPA questions it avoids answering. Members of Congress always have this prerogative as individual lawmakers and often as committee members. The worst that can happen is the EPA answers evasively or not at all.
Several questions relevant to issues raised above leap to mind:
- California has some of the highest PM2.5 levels in the country. Yet multiple studies find no PM effect on mortality in the Golden State. Why is that?
- If PM2.5 is as deadly as the EPA claims, why is average life expectancy in Beijing about the same as in Arlington County, even though Beijing residents inhaled 4.5 to 17 times as much ambient PM2.5 during the past two decades?
- If PM2.5 is as deadly as the EPA claims, why is the life expectancy of a smoker who quits at 35 about the same as that of a non-smoker, despite the former inhaling ~ 30 times as much PM2.5 over a lifetime?
- If air pollution is a major cause of asthma, why have asthma rates gone up as air pollution has gone down?
- If air pollution is a major cause of asthma, why does Texas rank among states with the lowest asthma rates and Vermont among states with the highest rates, despite Texas having the greatest concentration of fossil fuel infrastructure and Vermont no fossil fuel infrastructure?
- If ground level ozone is a major trigger of asthma attacks, why are asthma attacks less frequent during peak ozone season (June-August) than during September-November, when ozone concentrations are lower?
Key issue
Increase the balance and independence of EPA science panels
Many members of the agency’s scientific review panels receive substantial EPA funding or work in organizations literally created by EPA funding. Such advisors are unlikely ever to conclude that current regulatory standards should be relaxed or repealed.
Recommendations for Congress
Replace the EPA-centric funding regime with a decentralized system. In other words, phase out EPA grants to the seven PM centers and HEI and invite (not subsidize) air pollution research funding by states, NGOs, and for-profit companies. That would end panelists’ financial dependence on the EPA by sunsetting the agency’s patronage. Or, as discussed above, limit EPA funding to the construction of epidemiological datasets.
Under the Federal Advisory Committee Act (FACA), advisory panels are to be “fairly balanced in terms of the points of view represented,” and the “advice and recommendations of the advisory committee” are not to be “inappropriately influenced by the appointing authority.” Those requirements are clearly not being met today.
Requiring viewpoint diversity could raise concerns about compelled speech and science politicization, while limiting the EPA’s discretion to select its own advisors could raise separation of powers concerns.
The best solution is to end the EPA-dominated patronage system that can foster subservient advisors and disciplinary groupthink, or scale it back by limiting EPA financial support to the data construction phase of PM research.
If those reforms are not adopted, Congress should:
Disallow current recipients of EPA research grants from serving on advisory panels, and current panelists from applying for such grants. Enacting that policy would require amending the Environmental Research, Development, and Demonstration Authorization Act (ERDDAA) (42 U.S.C. 4365) and the Clean Air Act (CAA) 42 U.S.C. §7409(d)(2).
Service on the EPA’s Science Advisory Board (SAB) and Clean Air Scientific Advisory Committee (CASAC) is generally for a three-year term. Under the proposed reform, which might be called the “Advisory Panel Decent Interval Act,” a researcher may not serve on the SAB or CASAC if she, or her academic department or institute, received an EPA grant during the previous three years. Similarly, a researcher serving on a panel may not apply for an EPA grant until one year after her term of service expires.
This is an imperfect solution. A short-term pause in the agency’s patronage may do little to enhance the independence of researchers in whom the EPA has long invested. Worse, some will view it as mean spirited. Why should someone be penalized by being barred from the honor of serving on a federal advisory board just because she recently won a competitively awarded research grant?
That criticism overlooks the bureaucratic interests and regulatory ambitions that influence the “competitive” grant selection process. Competition limited to applicants whose research supports the agency’s agenda is biased. That has been the status quo since the late 1990s. It’s time for a change.
Key issue
Curb self-grading
This is a thorny problem. On the one hand, appointing researchers to grade their own work can produce a rigged system with public policy “captive to scientific-technological elite.” On the other hand, disqualifying a researcher from providing peer review just because he is prolific seems counterproductive and unfair.
FACA requires advisory committees to be “fairly balanced in terms of the points of view represented,” and groupthink can stifle scientific curiosity and objectivity. However, no constitutionalist wants to combat viewpoint discrimination through an affirmative action-type quota system. What is to be done?
Recommendation for Congress
Strengthen and codify OMB’s Information Quality Peer Review Bulletin. It is hardly surprising that all 12 peer reviewers of the EPA’s endangerment finding had worked on the scientific assessments being reviewed. The “EPA did not consider allowing the public, including scientific and professional societies, to nominate potential reviewers,” note CEI attorneys Devin Watkins and Sam Kazman. That flouted OMB’s Information Quality Bulletin for Peer Review, which states: “Agencies shall consider requesting that the public, including scientific and professional societies, nominate potential reviewers.”
OMB’s Bulletin also affirms the need for balance on peer review panels, explaining that “while expertise is the primary consideration, reviewers should also be selected to represent a diversity of scientific perspectives relevant to the subject.” OMB goes on to observe that on “most controversial issues, there exists a range of respected scientific viewpoints regarding interpretation of the available literature.” That is certainly the case with PM2.5 epidemiology and climate science. Stating the obvious, OMB opines that inviting “reviewers with competing views on the science may lead to a sharper, more focused peer review.” OMB reports that some organizations, such as the National Academy of Sciences, “specifically recruit reviewers with strong opinions to test the scientific strength and balance of their reports.”
Congress can counter the self-grading and one-sidedness of peer review and advisory panels without resorting to quotas or inappropriate meddling in agency business. One potential reform, which might be called the “Curbing Bias in Peer Review Act,” would have the following features.
First, Congress should not merely require agencies to “consider” requesting public nominations of potential reviewers. When the science at issue is “pivotal,” “influential,” or “highly influential,” Congress should require agencies to ask for public nominations.
Second, Congress should create a right of action to uphold IQA and FACA standards of balance in the appointment of peer reviewers and advisors. Specifically, citizens should be able to sue an agency when it: (1) treats the public nominations process as mere window dressing; (2) misclassifies science as non-pivotal or non-influential to evade a public nominations requirement; or (3) selects one-sided peer-review and advisory panels to address “controversial issues” on which there is a “range of respected scientific viewpoints regarding interpretation of the available literature.”
Congress need not specify percentages (quota) to ensure a “range of respected scientific viewpoints.” As Supreme Court Justice Potter Stewart famously said, even though he may not be able to intelligibly define pornography, “I know it when I see it.”
A move hard to square with respect for viewpoint diversity was EPA Administrator Michael Regan’s summary termination of all Trump-appointed CASAC and SAB members. Former EPA staff spearheaded this action in August 2020, urging that the agency “Re-compete all board/committee positions after lifting the exclusion for EPA grant recipients,” and “Take steps to Change the CASAC Chair.” John Graham, who had led the EPA’s disbanded Science Advisory Board, said about the purge: “Now for the first time in the agency’s 50-year history, we have an administrator interested in scientific advice only from those scientists he has personally appointed.”
III. Overview of EPA climate science problems
Mainstream climate research has a scientific integrity problem due to its reliance on a triply biased methodology. The usual practice is to run overheated models with inflated emission scenarios and ignore or belittle humanity’s remarkable capacity for adaptation. That approach is wired to exaggerate the physical impacts of greenhouse gas emissions and the harmfulness of such impacts.
Because climate “solutions” are mostly coercive plans to reallocate billions and ultimately trillions of dollars in private capital investment, such policies are fraught with controversy. Supporters often spin “the science” for media and political impact, insisting that climate change is a “crisis” and “existential threat” even though IPCC reports do not use those terms.
The EPA is of course only one actor in the climate “space.” However, the EPA plays a leading role within the USGCRP, providing the quantitative sectoral impacts analysis for the 2018 Fourth National Climate Assessment. In 2015, the EPA took the lead in presenting the Obama administration’s scientific case for the Paris Agreement. The EPA has also been at the forefront since 2009 of US government efforts to estimate the social damages of an incremental ton of carbon dioxide (CO2) emissions—a metric known as the social cost of carbon. In November 2023, the EPA published a major report with new, ostensibly more accurate social cost estimates than those published by federal agencies since February 2010. In the EPA’s reboot, each ton of CO2 emissions causes over three times as much damage as federal agencies estimated in February 2021.
In a series of cases dealing with the EPA’s modeling of air pollutant risks, the D.C. Circuit Court of Appeals has repeatedly held that an agency’s use of a model is “arbitrary” if the model bears “no rational relationship to the reality it purports to represent.” Logically, the same verdict should apply to emission scenarios and adaptation assumptions.
Overheated models
To project the physical impacts of climate change, the USGCRP, IPCC, and other “mainstream” researchers run general circulation models (GCMs) and earth system models (ESMs) with various emission scenarios. The IPCC works with climate modeling groups around the world to produce and evaluate the models used in its assessment reports. This exercise is called the Coupled Model Intercomparison Project (CMIP). Each generation of models is numbered after the assessment report that it informs. Thus, the IPCC used the CMIP5 model ensemble in its 2013 Fifth Assessment Report (AR5) and the CMIP6 model ensemble in its 2021 Sixth Assessment Report (AR6).
CMIP models make projections about the evolution of global annual average temperatures out to the year 2100 and beyond. There is no way to directly test the accuracy of those projections. However, the models can hindcast global temperature changes in the past, and those projections can be compared to observations. That is what atmospheric scientist John Christy and colleagues have done in a series of studies over the past decade or so.
The next chart below shows the mean and spread of CMIP5 model projections in the tropical mid-troposphere compared to the averages of three independent empirical datasets: satellites, balloons, and reanalyses. Compared to the observations, the models on average project more than twice the mid-troposphere warming during 1979-2016. The following chart shows that only one CMIP5 model, the Russian INM-CM4, accurately tracks temperature change through the depth of the tropical troposphere.
The superior accuracy of INM-CM4 likely has something to do with its climate sensitivity estimate, which is the lowest of any CMIP5 model. Climate sensitivity is customarily defined as the amount of warming that occurs after the climate system fully adjusts to a doubling of carbon dioxide-equivalent (CO2e) greenhouse gas concentration. INM-CM4 has a climate sensitivity of 1.8°C. In contrast, GFDL-CM3, which has a sensitivity of 4.8°C, projects a warming trend that is literally off the chart.
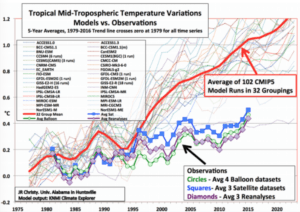

One might suppose the new and improved CMIP6 models used in AR6 would be more accurate. Not so—instead, they are worse. On average, CMIP6 models hindcast about 2.3 times the warming rate measured by satellites and weather balloons not only in the tropical troposphere but also in the global troposphere. Warming rates in all CMIP6 models are higher than the observed trend, in most cases significantly so.
39 IPCC Climate Model Simulations CMIP6, 300–200 hPa Temperature Trend, 1979–2019

Source: Adapted from McKitrick and Christy (2020). Red bars are CMIP6 temperature projections. White dashed line is the average of observations. Black dashed line is the model average projection.
Readers may wonder why Christy and colleagues often compare modeled and observed temperature trends in the tropical mid-troposphere. After all, nobody lives there!
The tropical mid-troposphere is uniquely suited for testing the validity of climate models. That is because: (1) Nearly all models predict strong positive feedbacks in the tropical mid-troposphere; (2) the region is well-monitored by satellites and weather balloons; (3) the mid-troposphere is too distant from the surface to be influenced by the temperature effects of land use changes; and (4) the models were not previously “tuned” to match the historical climatology in that region, hence are genuinely independent of the data used to test them.
That last point is the most critical. Modelers try to make their models realistic by adjusting climate parameters until hindcasts match historical climate phenomena. For example, a modeler may adjust a GCM’s climate sensitivity estimate to keep it within an “acceptable range.” However, hindcasting data already used to calibrate a model is like peeking at the answers before taking a quiz. The only real way to test a climate model’s predictive skill (other than waiting 30+ years to see how things evolve) is to compare the model’s hindcasts to data that have not already been used to train the model. In other words, the model must be applied to data that are “out of sample.” That is Christy’s procedure. The results speak for themselves. The models are not realistic. They run too hot.
A reasonable explanation is that even when tuned to keep climate sensitivity within an “acceptable range,” the models overestimate climate sensitivity. One might suppose that after the mismatch between the CMIP5 models and observations, the CMIP6 models would have lower climate sensitivity estimates. Instead, about 35 percent of CMIP6 models have higher climate sensitivities than the warmest CMIP5 model.
Climate sensitivity in CMIP6 models

Source: Hausfather (2020). Yellow bars show CMIP6 models with higher sensitivity than any CMIP5 model. Blue bars show CMIP6 model sensitivities within the CMIP5 range
Zhu et al. (2020) exposed the surrealism of the high-sensitivity CMIP6 models. They ran the CESM2 model, which has a sensitivity of 5.2°C, with an emission scenario in which CO2 concentrations reach 855 parts per million (ppm) by 2100. The model produced a global mean temperature “5.5°C greater than the upper end of proxy temperature estimates for the Early Eocene Climate Optimum.” That was a period when CO2 concentrations of 1,000 to 2,000 ppm persisted for millions of years. Moreover, the CESM2 tropical land temperature exceeds 55°C, “which is much higher than the temperature tolerance of plant photosynthesis and is inconsistent with fossil evidence of an Eocene Neotropical rainforest.”
The authors conclude: “Our study illustrates that the development and tuning of models to reproduce the instrumental record does not ensure that they will perform realistically at high CO2.” More colloquially, tuning models with historical climatology does not ensure they have predictive skill.
How did the IPCC cope with the “hot model problem” reported by Zhu et al. and other investigators? In previous IPCC reports, Hausfather et al. (2022) explain, the IPCC “simply used the mean and spread of models to estimate impacts and their uncertainties”—a method dubbed “model democracy” because each model counted equally in the overall assessment. In AR6, the IPCC decided to apply weights to the models before averaging them.
While “weighting” avoids the embarrassment of treating all projections, even the most outlandish, as equally credible, it does not correct the basic methodological flaw—a reliance on persistently errant models.
Inflated emission scenarios
The IPCC, USGCRP, and other government actors typically run the CMIP ensembles with unrealistic emission scenarios that tacitly assume the world returns to a coal-dominated energy system over the course of the 21st century.
Although the Shale Revolution began in 2007, many scenarists assumed until quite recently that learning-by-extraction and economies of scale would make coal the increasingly affordable backstop energy for the global economy.
The IPCC and USGCRP have been the main legitimizers of the two most influential scenarios used in recent climate impact assessments—RCP8.5 and SSP5-8.5. RCP8.5 is the high-end emission scenario in the IPCC’s 2013 Fifth Assessment Report (AR5), the USGCRP’s 2017/2018 Fourth National Climate Assessment (NCA4), and the IPCC’s 2018 Special Report on Global Warming of 1.5°C. SSP5-8.5 is the high-end emission scenario in AR6 and the USGCRP’s 2023 Fifth National Climate Assessment (NCA5).
Although neither scenario was originally designed to be the baseline or business-as-usual scenario, both have been widely misrepresented—including by the USGCRP and IPCC—as official forecasts of where 21st century emissions are headed.
Nothing like that is happening or expected to happen. For example, in RCP8.5, global coal consumption roughly doubles during 2020-2050. In contrast, in the Energy Information Administration’s 2023 International Energy Outlook, global coal consumption during 2022-2050 increases by 19 percent in the high economic growth case and declines by 13 percent in the low economic growth case.
RCP8.5 tacitly assumes global coal consumption increases almost tenfold during 2000-2100.

Source: Riahi et al. (2011).
The increasing affordability of natural gas and the plethora of policies mandating and subsidizing renewables invalidate RCP8.5 as a business-as-usual emission scenario, but so does coal industry economics. Coal producer prices more than doubled during 2000-2010 and are now 3.5 times higher than in 2000. Accordingly, in the International Energy Agency’s (IEA) baseline emission scenarios, global CO2 emissions in 2050 are less than half those projected by SSP5-8.5.
In 2022, Resources for the Future (RFF) published updated baseline emission scenarios, informed by IEA and other market forecasts. In the RFF’s baseline projection, global CO2 emissions are less than half those projected in SSP5-8.5 in 2050 and less than one-fifth those projected in 2100.
Net Annual Emissions of CO2 from RFF-SPs and SSPs
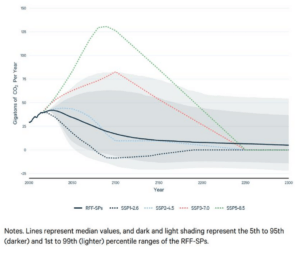
Source: Kevin Rennert et al. (2022). The solid black line is the RFF’s baseline projection. The dotted green line is SSP5-8.5.
For perspective, in NCA4, RCP8.5 was the business-as-usual scenario and RCP4.5 was the policy (climate change mitigation) scenario. RCP4.5 was estimated to reduce harmful climate change impacts on labor productivity, extreme heat mortality, and coastal property by 48 percent, 58 percent, and 22 percent respectively. The new RFF baseline closely aligns with SSP2-4.5, which has the same radiative forcing as RCP4.5.
However, the RFF baseline may already be out of date. Recent information suggests that the most realistic emission scenario is not SSP2-4.5 but an even “cooler” scenario, SSP2-3.4. In other words, the current global emissions trajectory adds 3.4 W/m2 of warming pressure by 2100. Assuming 3°C climate sensitivity, SSP2-3.4 results in 2.0°C-2.4°C of warming by 2100.
It is difficult to overstate the distorting influence RCP8.5 and SSP5-8.5 have had on climate research and public discourse. Google Scholar lists 47,200 papers on RCP8.5 and 9,360 on SSP5-8.5. Cursory sampling suggests that very few studies challenge the plausibility of those scenarios. Of the first 50 entries for both RCP8.5 and SSP5-8.5, all are studies that use those scenarios to model climate change impacts.
In AR6, the IPCC finally acknowledged the “low” likelihood of RCP8.5 and SSP5-8, citing “recent developments in the energy sector” and the IEA’s baseline emission scenarios. However, the extreme scenarios continue to dominate, with RCP8.5 and SSP5-8.5 receiving 41.5 percent of scenario mentions. When combined with another unrealistic high-end scenario, SSP3-7.0 (the orange dotted line in the RFF figure above), total mentions of extreme scenarios in AR6 rise above 50 percent.
Ignore or depreciate adaptation
Several big-picture trends indicative of increasing climate resilience and safety are never mentioned in federal agency assessments of climate change impacts and risks:
- Over the past 70 years—roughly the modern warming period—humanity achieved unprecedented improvements in global life expectancy, per capita income, and per capita food supply.
- US and global corn, wheat, and rice yields (tons per hectare) increased decade by decade since the 1960s. Combined global corn, wheat, rice, and soybean output doubled since 1980.
- Globally, the decadal annual average number of people dying from climate related disasters declined from about 485,000 per year in the 1920s to about 14,000 per year in the past decade—a 97 percent reduction in annual climate-related mortality.
- Factoring in the fourfold increase in global population since the 1920s, the average person’s risk of dying from extreme weather has decreased by 99.4 percent.
- From 2000 to 2020, global incidence of malaria (number of new cases per 1,000 population at risk) declined by 27.5 percent while global deaths from malaria declined by 30 percent.
- The number of excessive heat days in US cities increased since 2010. However, US heat related mortality was lower in 2010-2018 than in any previous eight-year period since 1975.
- Globally, climate-related economic losses have increased as population and exposed wealth have increased. However, losses as a percentage of exposed wealth declined almost five-fold from 1980-1989 to 2007-2016, with most of that progress occurring in low-to-middle income countries.
- Despite a rising number of “billion-dollar disasters” (due to increases in population and exposed wealth), US annual average weather-related losses as a proportion of GDP declined from slightly over 0.2 percent in 1990 to somewhat below 0.2 percent in 2019.
Omitting such data from climate impact assessments is cherry picking and flouts scientific norms of balance and objectivity.
EPA climate science bias and hype, examples
Benefits of Global Action
The EPA’s June 2015 Benefits of Global Action report presents the Obama administration’s scientific case for negotiating and joining a climate treaty like that adopted in Paris six months later.
The report (hereafter “Global Action”) compares two scenarios—one where climate policies limit global warming to 2°C above preindustrial levels by 2100 (the Paris Agreement’s minimal goal)—and a “business-as-usual,” “reference,” or “no action” scenario in which global warming reaches 5°C.
In essence, Global Action asks Americans to choose between safety and ruin. If we do nothing, warming will reach 5°C by 2100, and in that year, the United States will experience 57,000 preventable air pollution deaths and 12,000 preventable heat-related deaths. Or we can avoid such harms by working with other nations to keep warming below 2°C.
The core problem with Global Action is the triply biased methodology described above. The EPA’s “no action” emissions scenario has a radiative forcing of 8.6W/m2. Projected emissions are somewhat lower than in RCP8.5 but the radiative forcing is slightly higher. In short, the EPA’s “reference case” is another improbable worst-case scenario. Characterizing it as “business as usual” is misleading at best.
Most of the climate impacts featured in Global Action assume a climate sensitivity of 3°C, because 3°C is the “best estimate” of climate sensitivity in the IPCC’s 2007 Fourth Assessment Report (AR4). However, during 2011-2014, researchers published several empirically constrained studies reporting lower climate sensitivities. The average sensitivity in those studies is about 2.0°C, or 33 percent lower. See the chart below.
Global Action does not mention the significant debate on climate sensitivity that emerged since AR4, just as it does not mention the growing divergence between models and observations in the tropical mid-troposphere.
Even if the planet does warm as fast as Global Action projects, the report’s impact projections would still be dubious. Consider first the projection of 12,000 preventable US heat stress deaths in 2100 if policymakers reject “global action.” The EPA acknowledges that adaptation “equal to that of Dallas,” if achieved in 49 US cities, could reduce the death toll to 5,500. However, it is implausible that Dallas in 2015 represents the peak of human adaptive capability—especially if the future is as hot as the EPA’s “business-as-usual” scenario projects. The EPA’s adaptation assumption is unreasonably pessimistic.

Source: Michaels and Knappenberger (2014). The gray bar indicates the “likely” (greater than a 66 percent probability) sensitivity range in AR5. Colored arrows indicate the 5 to 95 percent confidence bounds for each estimate. Colored vertical lines indicate each study’s best estimate. The red box encompasses four sensitivity estimates reported by Ring et al. (2012). Spencer & Braswell (2013) produce a single estimate from ocean heat content observations.
The EPA estimates that global action would avoid approximately 13,000 premature US deaths in 2050 and 57,000 in 2100 from poor air quality, the theory being that warming will increase ozone and PM2.5 formation. Leaving aside the issue of whether PM2.5 and ozone are as dangerous as the agency assumes, EPA data clearly show that air pollutant emissions and concentrations keep declining despite increases in urban summer temperatures.
Long before 2100, perhaps even by 2050, most significant remaining US air pollutant emissions could be eliminated. If so, the impact of warming on US air quality would be minimal. Yet the EPA claims global action would deliver $160 billion and $930 billion in US air quality-related health benefits 2050 and 2100, respectively. How is that possible?
As explained in a text box, Global Action does not really estimate the impact of projected warming on air pollutant emission levels expected to occur in 2050 and 2100. Rather, the report estimates the impact of warming on “present-day [emission] levels.” The EPA claims that holding present-day levels “fixed” allows the agency “to isolate the climate change-related impact on air quality.”
Not so. That procedure hypes the putative benefits of “global action.” The only way to “isolate” the impact of global warming on air pollution in 2050 and 2100 is to compute its effects on projected pollutant emission levels in those years, not emission levels in 2015. The EPA should have modeled air quality impacts under assumptions of low, moderate, and high rates of industrial turnover from older, dirtier capital stock to newer, cleaner technologies. Instead, it unreasonably assumed technological stasis over a period of 85 years.
Worse, Global Action does not really estimate the impacts of future warming on present-day emissions. For “more information on the approach, models used, and results for the air quality sector,” the EPA refers readers to Garcia-Menendez et al. (2015). In that study, the “present day” or baseline year is 2000, not 2015. By 2015, US annual air pollutant emissions were already significantly lower than in 2000.
The table below shows the annual tonnages in 2000 and 2015 of the four pollutants chiefly responsible for US ozone and fine PM pollution, with the percentage reductions achieved by 2015.
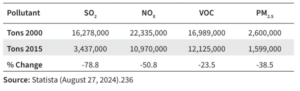
Because ambient temperatures can influence air pollution concentrations, cutting air pollutant emissions is a form of climate change adaptation. The EPA’s pollution mortality analysis not only assumes no further progress in cutting emissions. It also implicitly assumes negative adaptation—as if the substantial emission cuts of the prior 15 years never happened.
That error is fatal to the EPA’s air quality benefits assessment, as economist Oren Cass points out in a 2018 Manhattan Institute report. Cass notes that in Garcia-Menendez et al. (2015), “global action” averts 57,000 preventable US air pollution deaths in 2100 by reducing the average US resident’s exposures to ozone and PM2.5 by 2.6 parts per billion (ppb) and 1.2 µg/m3, respectively. However, during 2000-2015, US average concentrations of ozone and PM2.5 dropped by 13 ppb and 5 µg/m3, respectively. Those reductions in ambient concentrations are multiples of the reductions purportedly achieved by “global action.”
Thus, even if we unrealistically assume no further declines in US annual ozone and PM2.5 emissions after 2015, a rejection of “global action” would by 2100 merely “return” US air quality from 2015 to 2011 levels.
To sum up, by assuming constant annual emissions relative to an out-of-date “present day” baseline, the EPA both highly exaggerates the costs of rejecting “global action” and hides the superior potency of adaptation to mitigation in managing climate-related risks.
Fourth National Climate Assessment (NCA4)
The USGCRP published NCA4 in two installments—Volume I on climate change science, in October 2017, and Volume II on climate change risks, impacts, adaptation, and mitigation, in 2018. The latter volume is our topic here.
Although Volume II weighs in at a whopping 1,515 pages, the New York Times was ready with a review article on the day of the report’s release. Moreover, the reporters were able to spot the report’s big takeaway though it appears only once, on a single page in Chapter 29, and depicted in a graph rather than expressly stated.
Here’s what the Times reported, which is probably the only thing anyone not directly involved might remember: Unchecked greenhouse gas emissions could increase global annual temperatures by 8°C in 2100, which would reduce US annual GDP by 10 percent.
That estimate comes from a single study: Hsiang et al. (2017). Specifically, NCA4’s bottom line derives one chart in that study.
The chart, which is reproduced in NCA4, purports to show how US GDP declines as global average temperature increases:
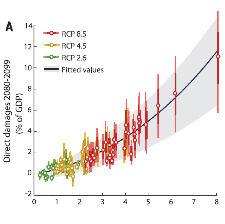
Source: Hsiang et al. 2017. Total direct damages to the U.S. economy, summed across all assessed sectors, as a function of global mean temperature change.
But how likely is it that global warming will hit 8°C in 2100? Hsiang et al. also have a chart showing the probability distribution of different warming outcomes when the CMIP5 model ensemble is run with RCP8.5. That chart is not reproduced in NCA4.

Source: Hsiang et al. (2017). Probability distribution of global mean surface temperature responses under RCP8.5.
As the chart above reveals, even when the warm-biased CMIP5 model ensemble is run with the warm-biased RCP8.5 emission scenario, global warming has only a 1 percent probability of reaching 8°C by century’s end. NCA4 does not mention that detail. Nor does the Times. In the IPCC’s likelihood scale, anything with a 0-1% probability is deemed “exceptionally unlikely.” The USGCRP hid that good news from the public, fostering the misperception of looming global disaster and economic collapse.
On p. 1359, NCA4 presents a sectoral breakdown of climate change damage under RCP8.5 and avoided damage under RCP4.5. The estimates come from the EPA’s 2017 sectoral impacts analysis mentioned above.
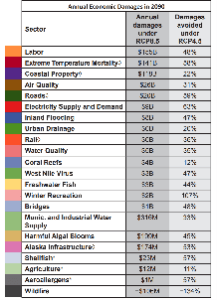
The text accompanying the table states that “results assume limited or no adaptation.” It notes that adaptation “was shown to reduce overall damages in sectors identified with the diamond symbol,” those being extreme temperature mortality, coastal property, roads, rail, and Alaska infrastructure. However, no numbers are provided.
For additional information, the NCA4 refers readers to the EPA’s 2017 sectoral impacts analysis. There we find, for example, that “proactive adaptation to protect roads against climate change-related impacts is projected to decrease costs over the century by 98 percent under RCP8.5 and 83 percent under RCP4.5.” In other words, for roads, the most effective way to reduce RCP8.5-related damages is adaptation, not mitigation.
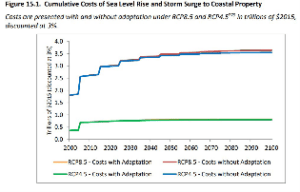
Unless motivated to dig into an EPA technical report, policymakers, reporters, and the public may mistakenly conclude that mitigation is always or usually the better option or higher priority.
The EPA’s sectoral impacts analysis also reveals that adaptation provides much more protection from sea level rise. The EPA estimates that cumulative coastal property damages through 2100 will total $3.6 trillion under RCP8.5 and $3.508 trillion under RCP4.5. In other words, reducing RCP8.5 emissions to RCP4.5 levels decreases cumulative coastal property damages by $92 billion or 2.6 percent (not 22 percent, as reported in the table above). In contrast, proactive adaptation would decrease RCP8.5 costal property damages to $820 billion—a 77.2 percent reduction. Moreover, combining proactive adaptation with mitigation to RCP4.5 level emissions avoids an additional $20 billion or 0.5 percent of coastal property damages. The contribution from mitigation is so small it is barely discernible in the EPA’s chart.
To its credit, the USGCRP reproduces the chart above in NCA4. However, the chart appears in Chapter 8 (Coastal Effects), not Chapter 28 (Adaptation) or Chapter 29 (Mitigation). The requisite information is in plain sight but scattered across hundreds of pages. Most readers will not connect the dots unless the USGRCP connects them. It does not do so. Consequently, most readers (including reporters) are apt to mis-prioritize mitigation over adaptation.
Too few side cases
A primary safeguard against climate impact assessments becoming propaganda exercises is the inclusion of side cases. Such “sensitivity analyses” reveal how the authors’ analytic choices drive results by showing how results change when investigators substitute reasonable analytic alternatives.
For example, modelers could run INM-CM4 (the most accurate model) with SSP2-4.5 and SSP5-8.5; run the CMIP6 ensemble with SSP2-3.4 (the most accurate baseline); or run INM-CM4 with SSP2-3.4. They could also assume all major US cities achieve the heat stress adaptation of present-day Phoenix by 2050; assume pollutant emissions decline practically to zero by 2060; assume coastal communities invest tens of billions of dollars on adaptation to avoid trillions of dollars in coastal property damages; and present the results in a single table.
Side cases discourage bias and hype. They also give the public enough information to raise legitimate questions about an assessment’s analytic choices and conclusions.
Key issue
Foster realism, balance, and objectivity in EPA climate assessments
Rather than require the EPA to police itself, Congress should empower citizens to challenge bias and hype in official climate science assessments. Congress should clarify that reliance on any unrealistic scientific or factual premise, not just unrealistic models, is arbitrary and capricious. Congress should also clarify that interested parties may contest the scientific basis of any EPA rulemaking, including climate policy rules, in officiated, on-the-record, public debates.
What EPA climate science policy should look like
A modernized EPA would be a strong voice for balance, objectivity, and transparency in climate research. It would prioritize realism in the selection of climate models, emission scenarios, and adaptation assumptions. It would test its climate assessments with side cases that use reasonable alternative analytic choices. It would make the side cases easy for policymakers and the public to access. It would explain the scientific basis for preferring its assumptions and analytic choices to those in the side cases.
More broadly, the EPA would candidly discuss peer-reviewed studies challenging either the methodologies on which it relies or its interpretation of the refereed literature. It would ensure that its reference lists reflect “the range of respected scientific viewpoints regarding interpretation of the available literature.”
Recommendations for Congress
Codify, extend, and strengthen the D.C. Circuit’s requirement that models used in rulemaking should have a “rational relationship” to the realities they purport to represent. Although all forecasting involves guesswork, some assumptions and analytic choices are less reasonable than others. As noted above, the D.C. Circuit Court of Appeals has repeatedly held that an agency’s use of a model is “arbitrary” if the model bears “no rational relationship to the reality it purports to represent.” Logically, the same verdict applies to emission scenarios and adaptation assumptions. A rational-relationship-to-reality standard should apply to all important scientific assumptions that underpin agency regulations.
Moreover, the standard should be strengthened. In a constitutional republic, government should have the burden of proving that restrictions on economic liberty serve the public interest. Accordingly, to prevail in litigation, the EPA would need to show that its climate models, emission scenarios, and adaptation assumptions have a clear rational relationship to the realities they purport to represent. This reform might be called the “Climate Assessment Realism Act.”
If that reform is not adopted, Congress should at least give effect to the D.C. Circuit’s reasoning about models.
Require the EPA and other federal science agencies to use the most accurate model or models when assessing climate change impacts. As discussed above, the climate science underpinning EPA greenhouse gas regulations projects climate change impacts is based on the average and spread of all models. That is not what meteorologists do. Rather, they use the model or models with the best record in forecasting specific types of weather in specific regions.
Congress should require the EPA and other USGCRP agencies to similarly use the model or models that most reliably hindcast observed temperatures in the troposphere. This reform might be called the “Need a Weatherman Act.”
Facilitate public hearings. Congress should allow interested parties to challenge the scientific bona fides of all EPA regulations, including climate policy rules, in public hearings, where opposing parties can cross-examine each other under judicial supervision.
Such proceedings could examine the scientific basis of climate policy rules as presented by the EPA and its advisory boards or peer-review panels. Multiagency and intergovernmental scientific climate assessments should also be fair game if those form part of a challenged rule’s scientific justification. To reiterate, this reform could be called the “Level Playing Field in Regulatory Science Act.”
Key issue
Remove social cost of carbon from regulatory development and benefit-cost analysis
The social cost of carbon (SCC) is a monetized estimate of the cumulative social damage from one ton of CO2 emitted in a particular year. Conversely, the SCC is a monetized estimate of the social benefit of avoiding one ton of CO2 emissions in that year. Federal agencies have incorporated SCC values into their regulatory benefit calculations since 2010 or earlier. By one estimate, as of June 2021, federal agencies had used the SCC to calculate climate benefits in at least 80 rules.
Illusory climate benefits
A notable recent example is the EPA’s April 2024 model year 2027-2032 greenhouse gas emission standards for new motor vehicles. The EPA estimates the rule add will add $760 billion to auto industry compliance costs, which in turn will add $2,000 to the average cost of a new car in 2032. The rule’s climate benefits are estimated to be much larger—$1.6 trillion. The EPA obtains that figure by multiplying the rule’s projected CO2 emission reductions (7.2 billion tons during 2027-2055) by the agency’s SCC estimates.
That is deeply problematic. The EPA and other federal agencies use a model called MAGICC to estimate the temperature impacts of emission reduction policies. Select a baseline emission scenario, choose a climate sensitivity estimate, type in a projected emissions reduction, click “Run,” and MAGICC computes the quantity of global warming averted by 2050 and 2100. Even assuming a high (4.5°C) climate sensitivity, MAGICC estimates that the EPA’s auto rule would avert only 0.0068°C of warming by 2100. That change is far too small for scientists to detect or for people to experience.
Unverifiable, non-experiential effects are “benefits” in name only. Notional benefits should not be netted against multibillion-dollar compliance costs that verifiably impose measurable burdens on identifiable firms and consumers.
User manipulation
The auto rule’s $1.6 trillion climate benefit estimate underscores the almost limitless potential of SCC analysis to predetermine results for political objectives. As MIT economist Robert Pindyck put it:
The modeler has a great deal of freedom in choosing functional forms, parameter values, and other inputs, and different choices can give wildly different estimates of the SCC and the optimal amount of abatement. You might think that some input choices are more reasonable or defensible than others, but no, “reasonable” is very much in the eye of the modeler. Thus these models can be used to obtain almost any result one desires.
By adjusting the knobs and dials, an SCC modeler can make fossil fuels—or gasoline-powered cars—look unaffordable no matter economical, convenient, or enabling of human welfare. Similarly, they can make hugely expensive climate policies look like a bargain at any price. SCC estimation easily becomes computer-aided hucksterism.
Warm-biased analytic choices
The federal government’s Interagency Working Group (IWG), of which the EPA is a leading member, published technical support documents (TSDs) on the social cost of carbon in February 2010 and May 2013. It later published TSDs on the social costs of carbon, methane (CH4), and nitrous oxide (N2O)—collectively, the social cost of greenhouse gases (SC-GHG)—in August 2016 and February 2021.
All the IWG’s major analytic choices tilt towards SCC estimates supporting “global action.”
Choice 1: Run the social-damage calculators — formally known as “integrated assessment models” (IAMs) — with climate sensitivity estimates derived from GCMs and ESMs that significantly overshoot observed warming in the global troposphere. Overly sensitive IAMs will project too much warming and, hence, too much heat-related mortality, sea-level rise, and agricultural loss.
Choice 2: Run the IAMs with discount rates lower than those recommended by the OMB, thereby increasing the estimated present value of future emission reductions.
Choice 3: Project cumulative damages over a 300-year period—well beyond the limits of informed speculation about future emissions and adaptive capabilities. Extrapolating losses into the distant future increases SCC estimates without providing real information about public health and welfare in the 22nd and 23rd centuries.
Choice 4: Minimize the agricultural benefits of atmospheric CO2 fertilization by averaging the results of three IAMs, two of which (DICE and PAGE) do not explicitly quantify such benefits.
Choice 5: Exaggerate social vulnerability by including an IAM (PAGE) that unrealistically assumes adaptation cannot reduce social damages once 21st-century warming and sea-level rise exceed 1 degree Celsius and ten inches, respectively.
Choice 6: Inflate warming projections by running the IAMs with implausible emission scenarios in which coal increasingly dominates global energy through the 21st century and beyond.
Choice 7: Conceal the aforesaid biases by not running the IAMs with reasonable alternative assumptions to show how the chosen inputs drive results, and by ignoring such sensitivity analyses in the peer-reviewed literature.
On that last point, note that the IWG reports’ ever-growing citations do not include any of three sensitivity analyses published in the refereed literature by Heritage Foundation data scientist Kevin Dayaratna and colleagues. The 33-page reference list in the EPA’s November 2023 SC-GHG report also omits those studies. Dayaratna et al. (2020), the most recent of the three, finds that when one of the IWG’s damage calculators, the FUND model, is run with updated empirical information about climate sensitivity and CO2 fertilization, the SCC drops to very low numbers, with substantial probabilities of being negative through 2050. A negative SCC is another way of saying a net benefit.
Implausible emission baselines
The IWG estimated SCC values using an average of five emissions trajectories. Four are no-policy emission scenarios from a 2009 Stanford Energy Modeling Forum study known as EMF-22. Each scenario plots socioeconomic development and emissions from 2000 to 2100. The fifth is a policy future, added by the IWG, in which CO2 concentrations stabilize at 550 parts per million (ppm) in 2100. The IWG then extended the five trajectories out to the year 2300, albeit in a manner that might be described as techno-pessimism.
Lacking socioeconomic scenarios for the 22nd and 23rd centuries, the IWG assumed that whatever rates of carbon intensity decline were projected for 2090-2100 in the five trajectories would hold constant over the next 200 years. In other words, the extensions implicitly assumed no technological breakthroughs would occur such as might dramatically accelerate rates of carbon intensity decline.
The IWG did not report the total quantity of emissions in each of the five trajectories over the 300-year analysis period or provide any context to assess their realism. Fortunately, the Electric Power Research Institute (EPRI) did just that in a 2014 technical review of the IWG’s 2010 and 2013 TSDs. EPRI toted up the emissions and compared those quantities to total potential CO2 emissions in the world’s estimated fossil fuel reserves.
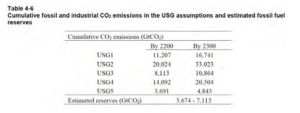
Source: EPRI (2014). The IWG’s baseline is the average of five emission trajectories (USG1-USG5) with gigatons of CO2 emissions held constant from 2100 to 2300 and compared to estimated fossil fuel reserves.
Cumulative emissions in the five trajectories average out to 17,195 GtCO2—roughly 2.4 to 4.6 times estimated fossil fuel reserves. That should have raised eyebrows even in 2010. To produce emission totals that high, the same governments that negotiated the Kyoto Protocol in 1997 and Copenhagen Agreement in 2009 would have to abandon “climate action” for almost three centuries and do so despite the IWG’s expectation of increasingly damaging climate change impacts. It was a fanciful construct.
The IWG’s 2016 TSD did not acknowledge any of the baseline issues raised by EPRI, and the 2021 TSD was also silent about the baselines’ reasonableness (or lack thereof).
Less-is-more social cost paradox
As noted earlier, in 2022, Resources for the Future published updated emission baselines. In addition to new 21st century baseline comparable to SSP2.-4.5, RFF produced a new baseline projections out to 2300 for use in SCC estimation. Upon request, RFF lead author Kevin Rennert created a chart comparing the updated baselines to the IWG baselines. The EPA regards the RFF baselines as the most accurate available and uses them in its November 2023 SC-GHG report.
Comparing the RFF and IWG baselines underscores the implausibility of the latter. The RFF baselines for 2000-2300 (labeled “GIVE” in the chart below) project less than one-third of the CO2 emissions previously assumed in the IWG’s 2010, 2013, 2016, and 2021 TSDs.

Source: Kevin Rennert. The mean projection of GIVE in 2300 is 5,000 GtCO2—less than one-third of the USG1-5 mean of 17,195 GtCO2.
So far, so good. But then things get strange. The EPA’s new 2000-2300 baseline projects less than one-third the total quantity of CO2 emissions as the old IWG baseline. Yet the EPA now projects more than three times as much social damage from each ton of CO2 emitted. In the 2021 IWG central estimate (3% discount rate), the SCC in 2050 is $85/ton. In the EPA’s 2023 updated central estimate (2% discount rate), the SCC in 2050 is $310/ton.
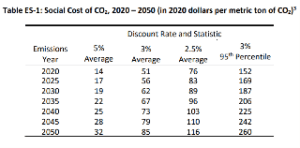
Source: IWG (2021). Central estimate for 2050 is $85/ton CO2
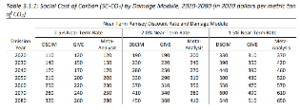
Source: EPA (2023). Central estimate for 2050 is $310/ton CO2
That is perplexing because the most basic idea in SCC analysis is that the damage from the next ton of emissions chiefly depends on the cumulative quantity of tons projected in the baseline. To infer dramatically higher per-ton social costs from dramatically smaller quantities of total emissions is highly paradoxical. Far from explicating this less-is-more paradox, the EPA’s 170-page report does not even acknowledge it.
RCP8.5: EPA’s “secret sauce.”
The EPA uses “transparent” and similar forms of the word 14 times to describe its new social cost methodology. However, the report contains nothing like a table, chart, or paragraph explaining which factors contribute what percentage of the more than threefold increase in social cost—despite the more than two-thirds reduction in baseline emissions.
One factor contributing to the higher SCC values is the EPA’s reduction of the central discount rate from 3 percent to 2 percent (albeit with OMB’s approval). Through the miracle of compounding over a 300-year analysis period, one percentage point change in discount rates makes a substantial difference.
However, that is not whole story, as can be seen by comparing the two tables above. When discounted at 2.5 percent, the SCC in 2050 is $116/ton in the IWG’s calculation and $200-210/ton in the EPA’s calculation. The EPA’s SCC estimate is 73-84 percent higher, even when both are discounted at the same rate.
In early December 2023, science writer Roger Pielke, Jr. identified RCP8.5 as the “secret sauce” in the EPA’s updated SCC. Although the EPA abandoned RCP8.5 as a baseline emissions scenario, the agency now relied on three damage functions “based on RCP8.5 and not EPA’s emissions scenarios or climate projections.”
By damage function, the EPA means a computer code that “translate[s] changes in temperature and other physical impacts of climate change into monetized estimates of net economic damages.” Despite the EPA’s switch to more realistic baselines, each damage function selected by the EPA assumes that an incremental ton of emissions causes the same amount of warming as modelers might project under RCP8.5.
For example, the Data-driven Spatial Climate Impact Model (DSCIM) damage function developed by the Climate Impact Lab incorporates RCP8.5 mortality damages from global warming up to 10°C by 2100. As Pielke, Jr. comments, that warming projection is not “remotely plausible.”
Citing Carlton et al. (2022), a Climate Impact Lab study, Pielke, Jr. further observes that “More than 75 percent of the DSCIM SCC results from mortality due to extreme heat, driven by RCP8.5.” Labor losses, which are the second-largest portion of SCC damages, are “also based on RCP8.5.”
Franken-scenario
However, questions remain about the less-is-more paradox. We might expect the addition of RCP8.5-enhanced damage functions to balance out the loss of RCP8.5-style emission baselines, leaving SCC values roughly unchanged. Instead, SCC values more than triple. What else has the EPA not told us?
The X factor, Pielke, Jr. contends, is a new more pessimistic assessment of human adaptive capabilities. The EPA’s SCC reboot assumes that societies are more fragile than the IWG thought. Specifically, Pielke, Jr. finds that the EPA, following Carleton et al. (2022), combines the forcing trajectory of SSP5-8.5 with the socioeconomic storyline of SSP3. The latter is a scenario in which investments in education and technology “decline” and economic growth is “slow.” In contrast, SSP5, the fossil-fueled development scenario, prioritizes “technological progress and development of human capital as the path to stainable development.”
The two scenarios differ drastically in terms of wealth and adaptive capabilities. In 2100, global per capita income in SSP3 is $20,000; in SSP5, it is almost $140,000. Of the five shared socioeconomic pathways, SSP5 has the greatest adaptive capabilities; SSP3, the least. But only SSP5 has the rapid, fossil-fueled development that produces a radiative imbalance of 8.5 W/m2.
In short, EPA 2023’s SCC estimates derive from a franken-scenario—an implausible amalgam of SSP3 social vulnerability and SSP5 emissions and warming. That is gobbledygook. As EPRI explained in its 2014 critique of the IWG process, a proper socioeconomic scenario provides “a complete and cohesive story with internal consistency between emissions drivers and emissions such that there are well defined relationships.” Combining the emissions of SSP5 with the poverty of SSP3 is not science. It is science fiction with an incoherent storyline.

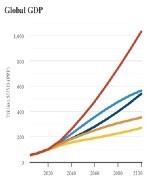
Source: Carbon Brief (2018)
Recommendations for Congress
A modernized EPA would frankly acknowledge that SCC analysis is too speculative and prone to user manipulation to inform either regulatory development or benefit-cost analysis. The IWG and the EPA have been at this game for 13 years, through five iterations, and, if anything, the current estimates are the least realistic and transparent. It is time to declare that this “one number to rule them all” cannot safely be wielded by any rulemaking entity.Pindyck observed in 2013 that social cost models “are so deeply flawed as to be close to useless as tools for policy analysis. Worse yet, their use suggests a level of knowledge and precision that is simply illusory and can be highly misleading.” Nothing has changed in the interim to invalidate that judgment.
When reality finally put paid to the IWG’s inflated emission baselines, the EPA reimported RCP8.5 in the form of new, purportedly “evidence-based,” damage functions, and imagined a future in which emissions from the richest SSP come from the poorest SSP. The EPA’s 2023 SC-GHG reboot is a more artful construction than the IWG’s methodological sandcastle, but it produces more extreme results, posing greater risks to the liberties and prosperity of our republic.
SCC estimation remains politicized “science”—mathematics in the service of propaganda. A modernized EPA would abandon it. Congress should:
Prohibit the EPA and other agencies from using SCC analysis to either inform regulatory development or quantify regulatory benefits. This reform, which might be called the “The Social Cost Propaganda Prevention Act,” is self-explanatory and follows logically from the critique presented above.
If that reform is not adopted, Congress should:
Facilitate the use of public hearings to challenge agencies’ use of SCC analysis in rulemakings. This is yet another application of the Level Playing Field in Regulatory Science Act.
Whether that reform is adopted or not, Congress should:
Require agencies to publish side cases calculating SCC values with reasonable analytic alternatives. Such alternative analytics include low-end climate sensitivity estimates, an SSP2-3.4 baseline emission scenario, 150-year rather than 300-year analysis periods, robust CO2 fertilization functions, and optimistic assessments of human adaptive capabilities.
Conclusion
Only an EPA dedicated to scientific integrity can effectively carry out its mission and merit the public’s trust, as the agency itself avers. Yet the EPA does not acknowledge, and has no plan to address, what many scholars consider the major scientific integrity challenge of our time—the replication (or reproducibility) crisis.
In several policy-relevant disciplines, independent investigators frequently cannot reproduce the results of studies published in peer-reviewed journals. Moreover, attempts to replicate the results of published studies are few and far between. In economics, for example, perhaps only 0.1 percent of published studies attempt to reproduce the results of previous research.
Peer-reviewed journals have published tens of thousands of articles on the reproducibility crisis. Yet the EPA acts as if it does not see the elephant in the elevator. Similarly, the EPA acknowledges no conflict of interest in its massive and often exclusive funding of the research it uses to justify regulatory decisions.
Several more specific failings tarnish the EPA’s scientific integrity record. The agency uses no diagnostics to detect publication bias and data manipulation in the research it funds or assesses. It accepts data concealment by EPA-funded researchers as an unalterable fact of life. It provides no forum for moderated public debate between competing experts on the scientific basis of EPA rulemakings. Members of its “independent” science advisory committees often work for organizations financially dependent on the EPA. Members of its peer-review panels often grade their own work. Both the committees and panels often lack reasonable viewpoint diversity.
Congress should not allow such substandard practices to continue. Scientific integrity is critical to efficient regulation. Only if high-quality science and economics inform regulatory decisions can the public reasonably expect the benefits to exceed or justify the costs.
More importantly, scientific integrity is critical to constitutional self-government. Our liberties are at risk when agencies are free to devise regulatory rationales based on non-transparent data, manipulated data, errant models, implausible scenarios, cherry picked studies, or meta-analyses skewed by selective outcome reporting and publication bias.
Congress should enact legislation obligating the EPA to prioritize transparency, reproducibility, objectivity, and realism in its funding, assessment, and use of scientific research. In environmental health policy, every study funded by the EPA, or used by the agency in regulatory development, should provide a clear audit trail covering all phases of the research. The authors’ data and methods should be sufficiently transparent to facilitate—not merely allow—independent validation.
In climate policy, Congress should specify that a regulation is arbitrary and capricious if it is based on forecasting models, emission scenarios, or assessments of human adaptive capabilities that do not have a clear rational relationship to the realities they purport to represent. Congress should also determine that the social cost of carbon is too speculative and prone to manipulation to inform either regulatory decisions or benefit-cost analysis.
More broadly, Congress should ensure the independence and reasonable viewpoint diversity of EPA science advisory committees and peer-review panels. It should also ensure that the EPA candidly and thoroughly addresses thoughtful criticisms of its scientific assessments and methodologies.
To that end, Congress should create a procedure whereby interested parties may challenge the EPA to debate the scientific basis of proposed rules. Such on-the-record debates, which would feature sworn testimony, cross-examination, and supervision by a hearing officer, would help inform both public comment on proposed rules and subsequent litigation on final rules.
Ultimately, Congress should explore options to decentralize the funding of environmental research. It is unwise to perpetuate a status quo in which most researchers are beholden to a single grantmaker—the very agency with a vested interest in funding research that supports its regulatory agenda.
Implementing science integrity reforms of the sort presented in this chapter will help ensure the EPA effectively carries out its statutory mission, earns the public’s trust, and furthers rather than undermines the American experiment in constitutional self-government.