The Unknowable Costs of Regulation and Intervention
Ten Thousand Commandments 2019 - Chapter 4
Download Chapter 4 as a PDF
The sole official reckoning citizens get on the scale and scope of regulatory costs is an annual but highly incomplete and inadequate OMB survey of a subset of regulatory costs and benefits.[i] The OMB’s 2017 Draft Report to Congress on the Benefits and Costs of Federal Regulations and Agency Compliance with the Unfunded Mandates Reform Act, is the most recent edition, but this draft-only edition is nearly three years out of date, covering through FY 2016. These reports contain a look back at the numbers of significant rules, and partial quantification of a handful of executive agencies’ rules during the most recent 10 years in addition to the current year. An aggregate annual estimate of the regulatory enterprise is required by law, but not performed.[ii]
This latest report pegged the annual costs of 137 selected “major” regulations from 2006 to 2016 at between $78 billion and $115 billion (in 2015 dollars).[iii] The estimated range for benefits in the report spanned $287 billion to $911 billion.[iv] According to OMB, the 16 rules subjected to both benefit and cost analyses during FY 2016 added annual costs of $4.3 to $6.4 billion.[v] Given the report’s absence, the fiscal year-end status reports on Executive Order 13771 covered so far serve as something of a stand-in for significant rule costs, but do not replace the scope (intended but not realized) of these annual reports as a management tool.
Some infer precision from the existence of official regulatory cost roundups. For example, Vox saw the 2017 draft report, which was not published until February 23, 2018, as the Trump administration “quietly” vindicating the Obama regulatory agenda.[vi] Actually, of 36,255 final rules published between 2007 and 2016, OMB reviewed 2,670, of which 609 were major.[vii] Of these, only 140 featured monetized benefits and costs.[viii] No independent agencies’ costs were among those surveyed. Another several billion dollars more in annual rule costs generally appear in these reports for rules with cost-only estimates, but they are not tallied and highlighted by OMB.[ix]
This author maintains that regulatory costs are unknowable in an elemental sense, and estimates of them are not observable or calculable—much as the economic calculations necessary to enable central economic planning are impossible.[x] Regulatory costs are, in the words of American Enterprise Institute scholar Peter Wallison, inherently “squirrelly.”[xi] Yet even so, the need for disclosure is unavoidable as long as the administrative state remains a means of governance. The solution to the unresolvable dilemma is for Congress to vote on rules. This urgency is reinforced by modern agency-invented contrivances like “co-benefits,” by which the modern administrative state reinforces itself. These artifices have appeared on the scene of a stage on which the performance of cost-benefit analysis is already largely a myth.
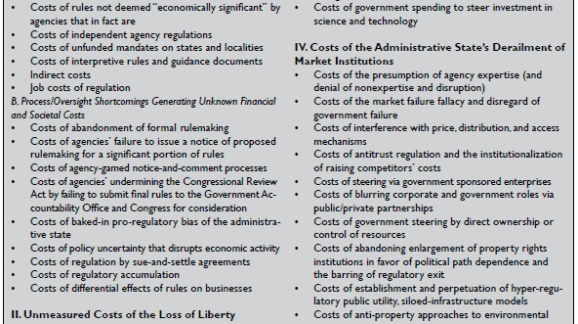
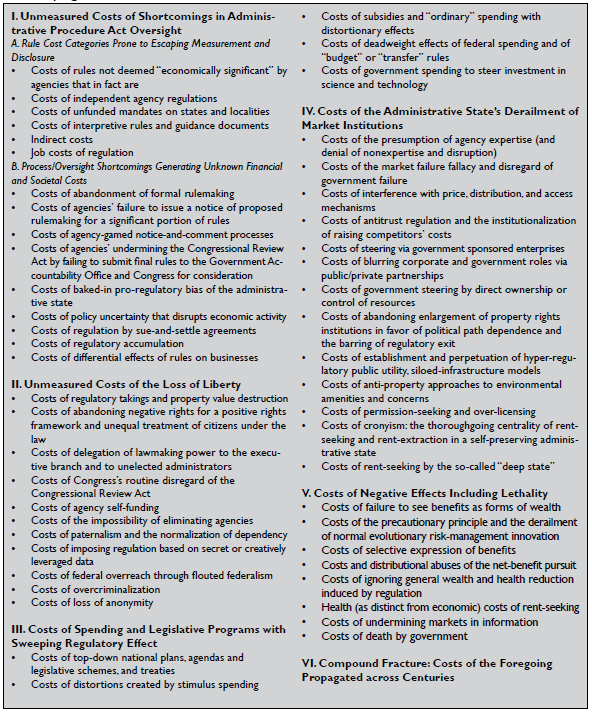
As for economic effects on traditional concerns like employment, regulation affects not only current jobs, but also the inclination for entrepreneurs to create them in the future. This intertemporal nature of regulation complicates honesty in cost assessment, since nations cannot “lose” jobs that have not been created. This helps illustrate how most of the regulatory enterprise is altogether immeasurable, and therefore unavailable to incorporate into studies or models. Box 3 illustrates the wide range of interventions of the regulatory and administative state that go unacknowledged.
Rule of Flaw and Costs of Coercion:
Surveying Unmeasured and Unfathomed Costs of the Administative State and Intervention
The ample shortcomings in administrative state disclosures work to the advantage of the professions and the academic legal studies infrastructure it has spawned over the last century. Others get crumbs. The annual OMB cost-benefit breakdown omits independent agencies and incorporates only those rules for which agencies have expressed both benefits and costs in quantitative and monetary terms—amounting to a couple dozen at best, when several thousand rules—and guidance documents not subject to notice and comment—appear each year.
The Small Business Administration (SBA) last published an assessment of the federal regulatory apparatus in 2010, pegging regulatory compliance costs at $1.75 trillion for 2008, [[AQ: Include endnote for SBA assessment.]] but that was discontinued and not replaced. The primary purpose of the SBA report series was not an aggregate cost estimate but rather to examine regulatory burdens on small firms, which have higher per-employee regulatory costs than larger ones. Earlier governmental assessments around the turn of the 20th century from OMB, GAO, and SBA also found aggregate annual costs in the hundreds of billions of dollars, some in excess of $1 trillion in today’s dollars (see Table 2). Performing an aggregate estimate never was SBA’s job, but it remains OMB’s neglected one. The data underlying these studies (or any studies) were (inevitably) extraordinarily problematic as this author noted in 2017 and in earlier editions of my working paper Tip of the Costberg, the subtitle of which is On the Invalidity of All Cost of Regulation Estimates and the Need to Compile Them Anyway.[i] The federal bureaucracy, with all the resources at its disposal, has done nothing to fulfill its duty to assess the aggregate effects of regulation.
Table 2. Assessments of Federal Regulation: Late 20th Century, Early 21st Century, Billions of Dollars
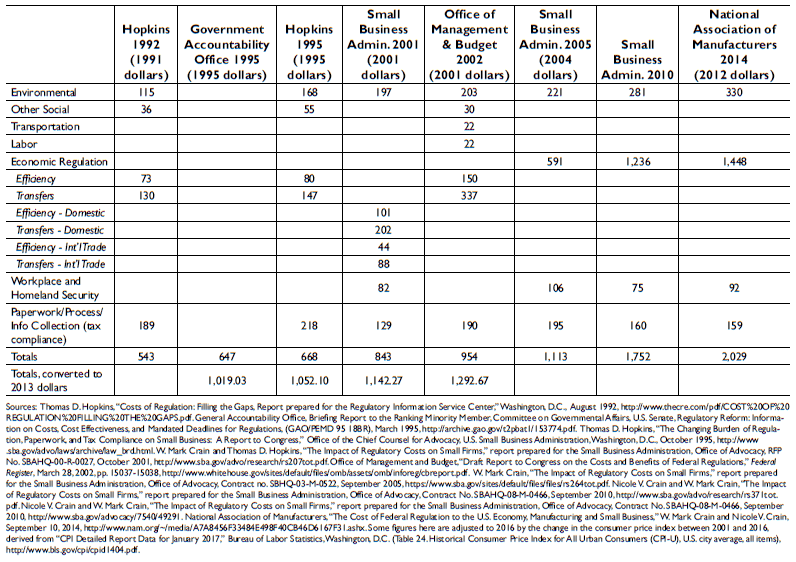
More recently in a 2014 report, the National Association of Manufacturers (NAM) modeled 2012 total annual regulatory costs in the economy of $2.028 trillion (in 2014 dollars).[i] This report had its share of detractors.[ii] Still another report, by economists John W. Dawson of Appalachian State University and John J. Seater of North Carolina State University, pushes regulatory costs into orbit by counting the long-term reduction in economic growth caused by decades of cumulative opportunity costs imposed by economic regulation. Their report posits dozens of trillions of dollars in lost GDP annually.[iii] The authors contend that rules affecting growth rates compound, and that Americans are less than half as rich as they would otherwise be in the absence of much of the regulatory state.
Others have set out to examine how seemingly inconsequential regulations can accumulate and have unintended effects and costs that ought not be ignored.[iv] A 2016 study, “The Cumulative Cost of Regulations” by the Mercatus Center at George Mason University, employs a microeconomic model investigating regulations’ effect on firms’ investment choices to attempt to determine “how much regulation distorts the investment decisions of firms and thus hampers long-run economic growth.” Using a 22-industry data set covering 1977 through 2012, the report concluded that had regulatory burdens remained constant since 1980, the 2012 U.S. economy would have been 25 percent larger. Put another way, the 2012 U.S. economy was $4 trillion smaller than it would have been in the absence of cumulative regulatory growth since 1980.[v] This represents a loss in real income of approximately $13,000 per American.[vi] In this vein, a 2017 White House Council of Economic Advisors report surveyed material increases in growth potential from moving from regulated to less regulated conditions, but regulatory assessments otherwise are lacking.[vii]
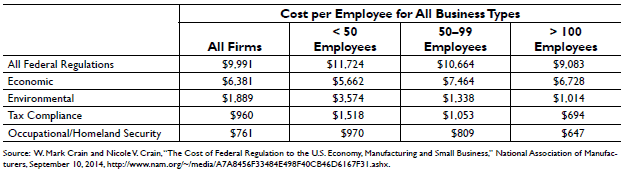
Regarding regulations’ unequal effects on different kinds of firms, the NAM model noted above found overall annual per-employee regulatory costs to firms of $9,991 on average, but the effects by firm size vary.[viii] Table 3 shows that per-employee regulatory costs for firms of fewer than 50 workers can be 29 percent greater than those for larger firms—$11,724 for smaller firms, compared with $9,083 for larger ones.[ix]
Table 3. Regulatory Costs in Small, Medium, and Large Firms, 2012
Looking back, the SBA and earlier OMB surveys had traditionally conveyed regulatory costs in the following categories:
- Economic regulatory costs (for example, market entry restrictions and transfer payments such as price supports;
- Workplace regulatory costs;
- Environmental regulatory costs; and
- Paperwork costs.
Differential effects of accumulating regulations on firms and people is also referenced among the costs in Box 3 and span the economic, environmental, health, safety, and social costs, compounded over decades. These must necessarily include loss of liberty from overcriminalization to the overthrow of the constitutional order itself in favor of rule by unelected bureaucrats. Some never tire of pointing out the accumulation of wealth by the top percenters in their alleged concern over income inequality, but perpetuation of unnecessary regulation also erases wealth accumulation and harms the most vulnerable.[i]
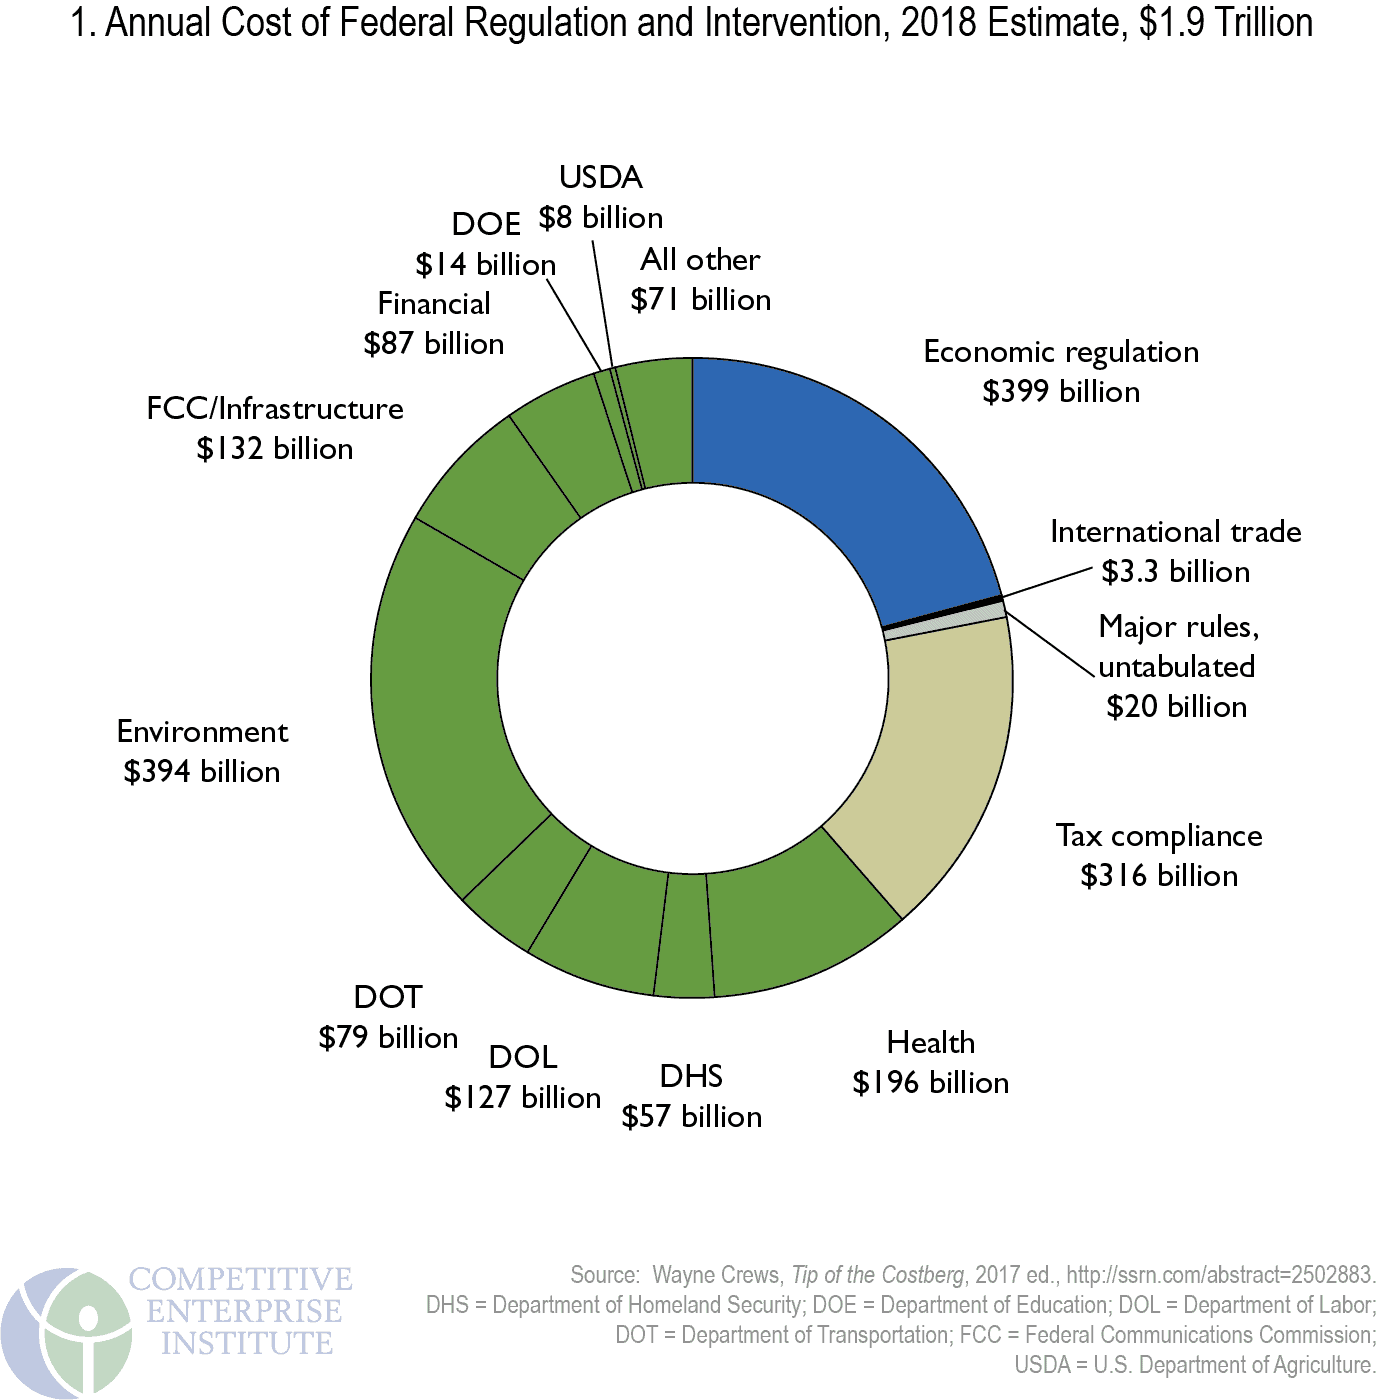
In the context of these existing and available sources and the federal government’s failure to issue new aggregate analysis, this report employs a baseline for across-the-board costs of federal regulation and intervention of $1.9 trillion annually in compliance costs, economic and GDP losses and social costs (see Figure 1).[ii] This figure is based on a nonscientific, disclaimer-laden, fusion amalgam of GDP losses and compliance costs derived from available official data and other sources.[iii] Even so, this assessment is more representative and inclusive than official estimates and more “conservative” in that burdens conceivably are considerably more as the Mercatus and Dawson and Seater approaches imply.
We need greater acknowledgement of what we do not know, to own up to burdens that slip through the cracks. Unless Congress votes on rules, the federal government must continue to be forced to assess regulatory costs from the standpoint of compliance, efficiency, and losses of liberty. The debate has never been whether the government should perform its cost assessment, but whether it should be bottom up or top down.[iv] The answer is that both are needed, and an executive order reaffirming the obligation to assess aggregate costs is warranted. Executive orders and guidance to agencies governing cost assessment and regulatory analysis are incomplete and need to incorporate far more elements (see Box 3).[v]
Regulatory Cost Burdens Compared to Federal Spending and the Deficit
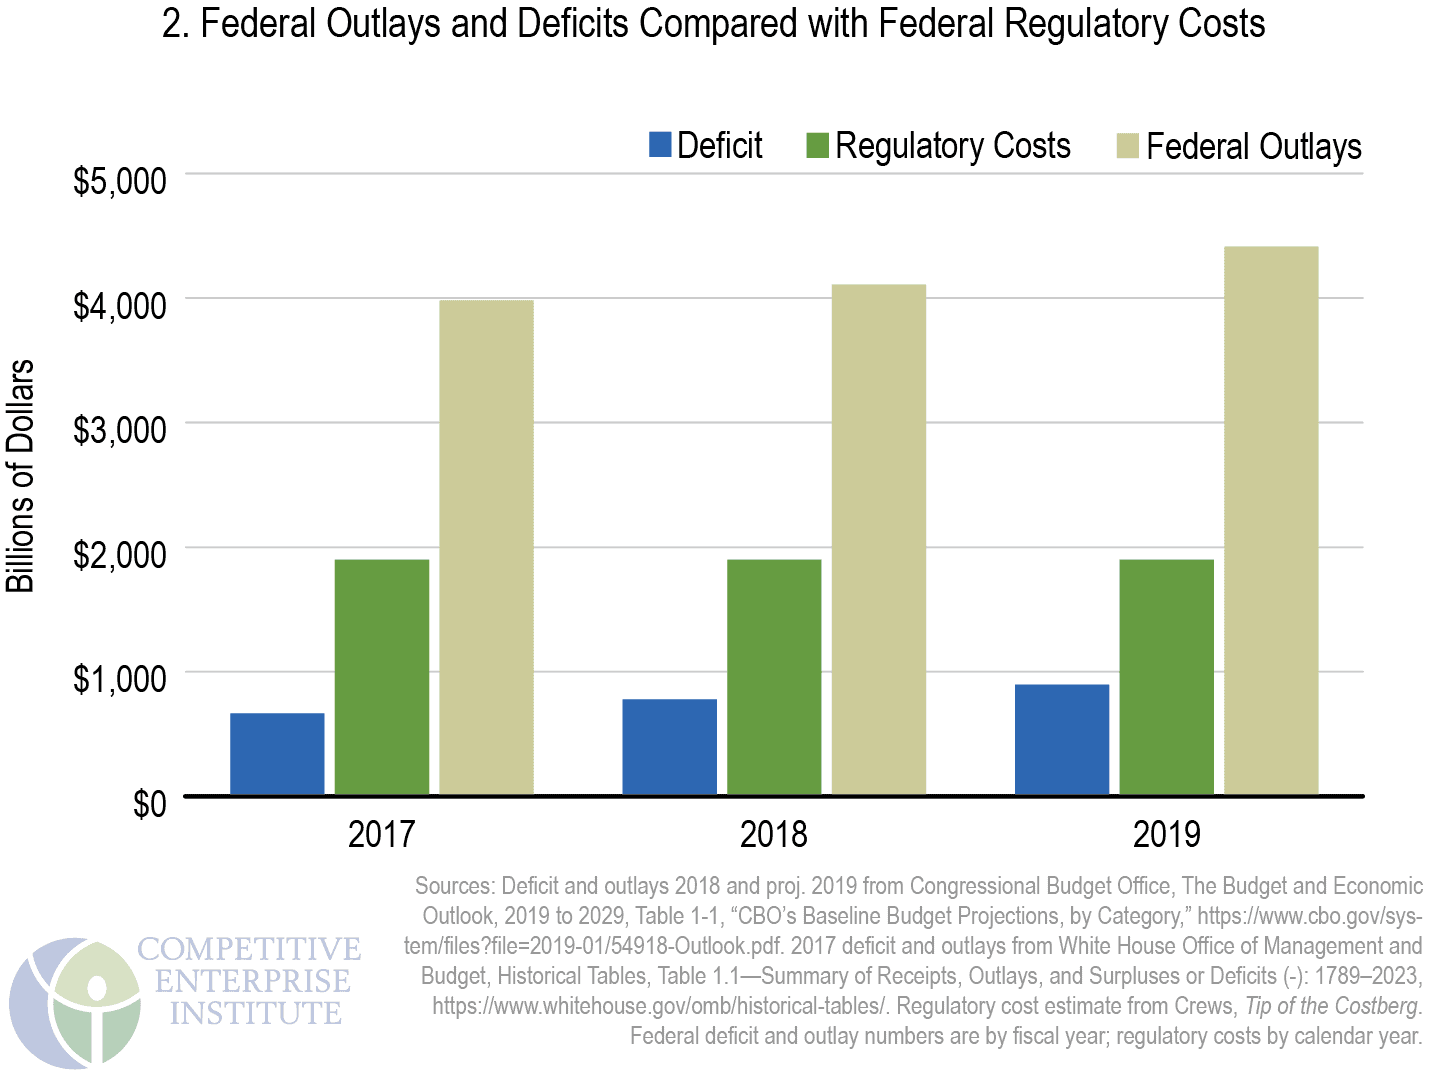
Comparisons of regulation with the costs of federal taxation and spending help place the relative magnitudes in perspective. The U.S. federal government reached $4.108 trillion in outlays and a deficit of $779 billion in FY 2018.[i] Figure 2 compares deficits and outlays for 2017–2018 and projected amounts for 2019 to the overall regulation cost estimate of $1.9 trillion. For 2019, costs of regulatory compliance and intervention are equivalent to about 43 percent of the projected level of fiscal budget outlays of $4.412 trillion, and more than double the anticipated deficit, which is expected to soar to $897 billion.
Regulatory Costs Compared to Income Taxes and Corporate Profits
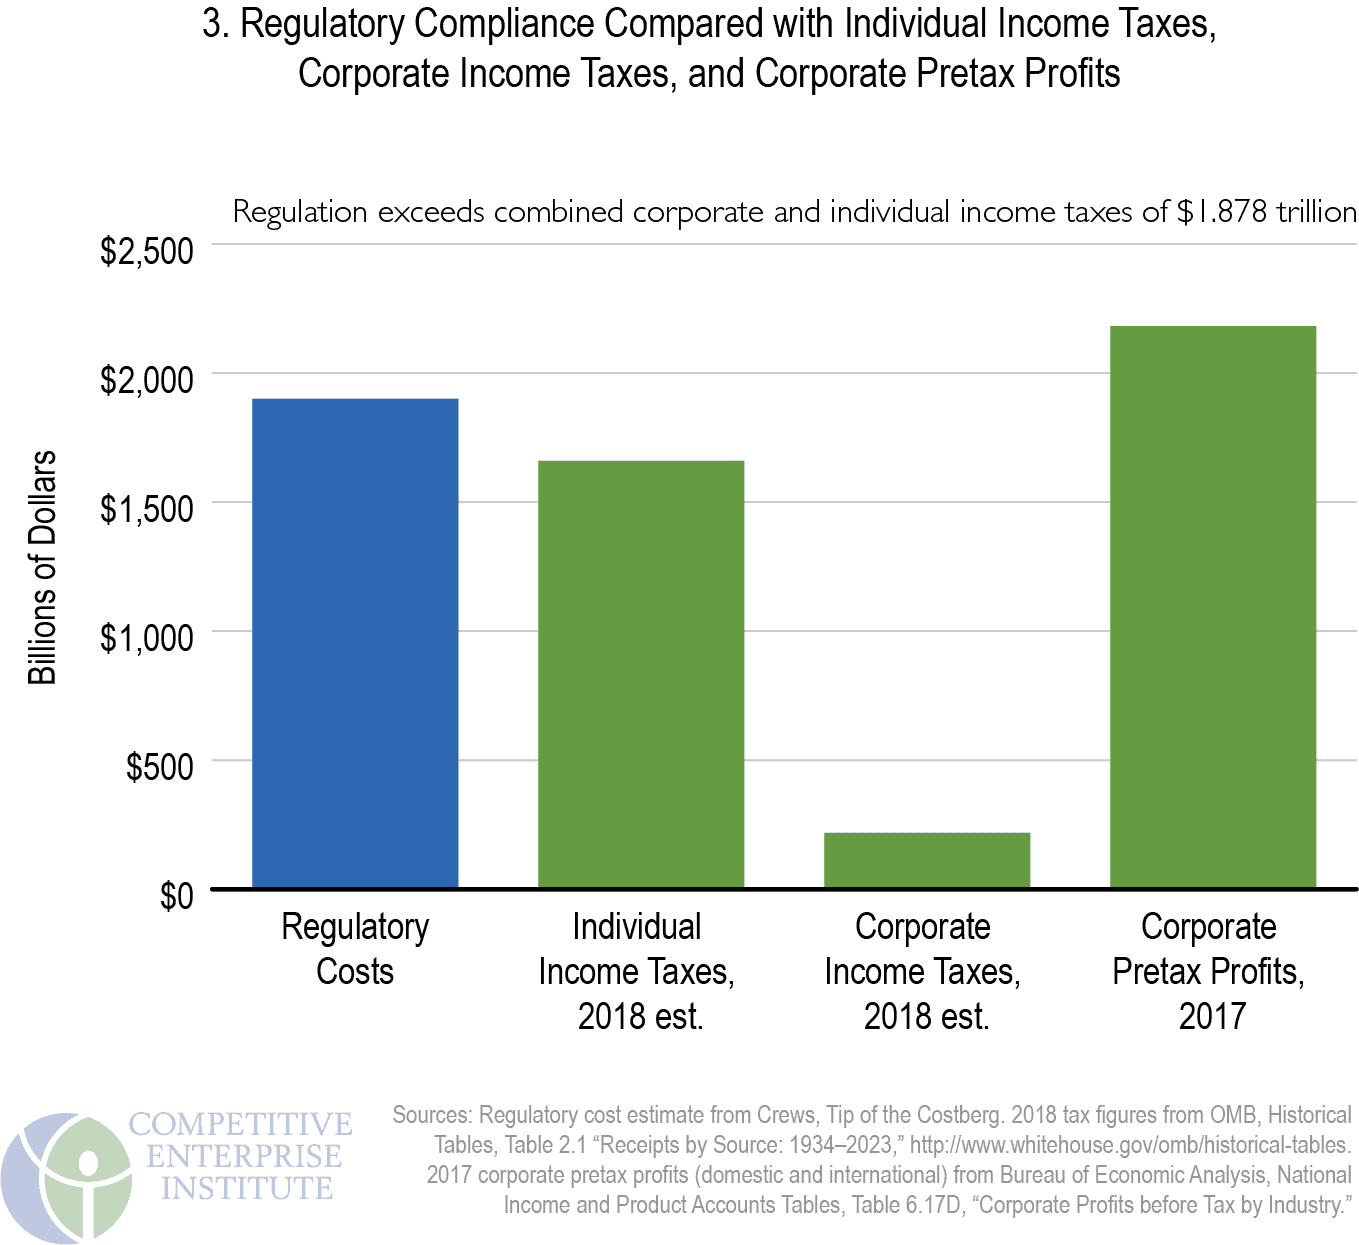
Regulatory costs easily rival revenues from individual income taxes and corporate taxes combined. As Figure 3 shows, regulatory costs stand well above 2018 estimated individual income tax revenues of $1.66 trillion.[i] Corporate income taxes collected by the U.S. government—an estimated $218 billion for 2018—are dwarfed by regulatory costs.[ii] The combination of the two, $1.88 trillion, is roughly equivalent our regulatory cost marker of $1.9 trillion. Regulatory costs even approach the level of pretax corporate profits, which were $2.182 trillion in 2017.[iii]
Regulatory Costs compared to GDP
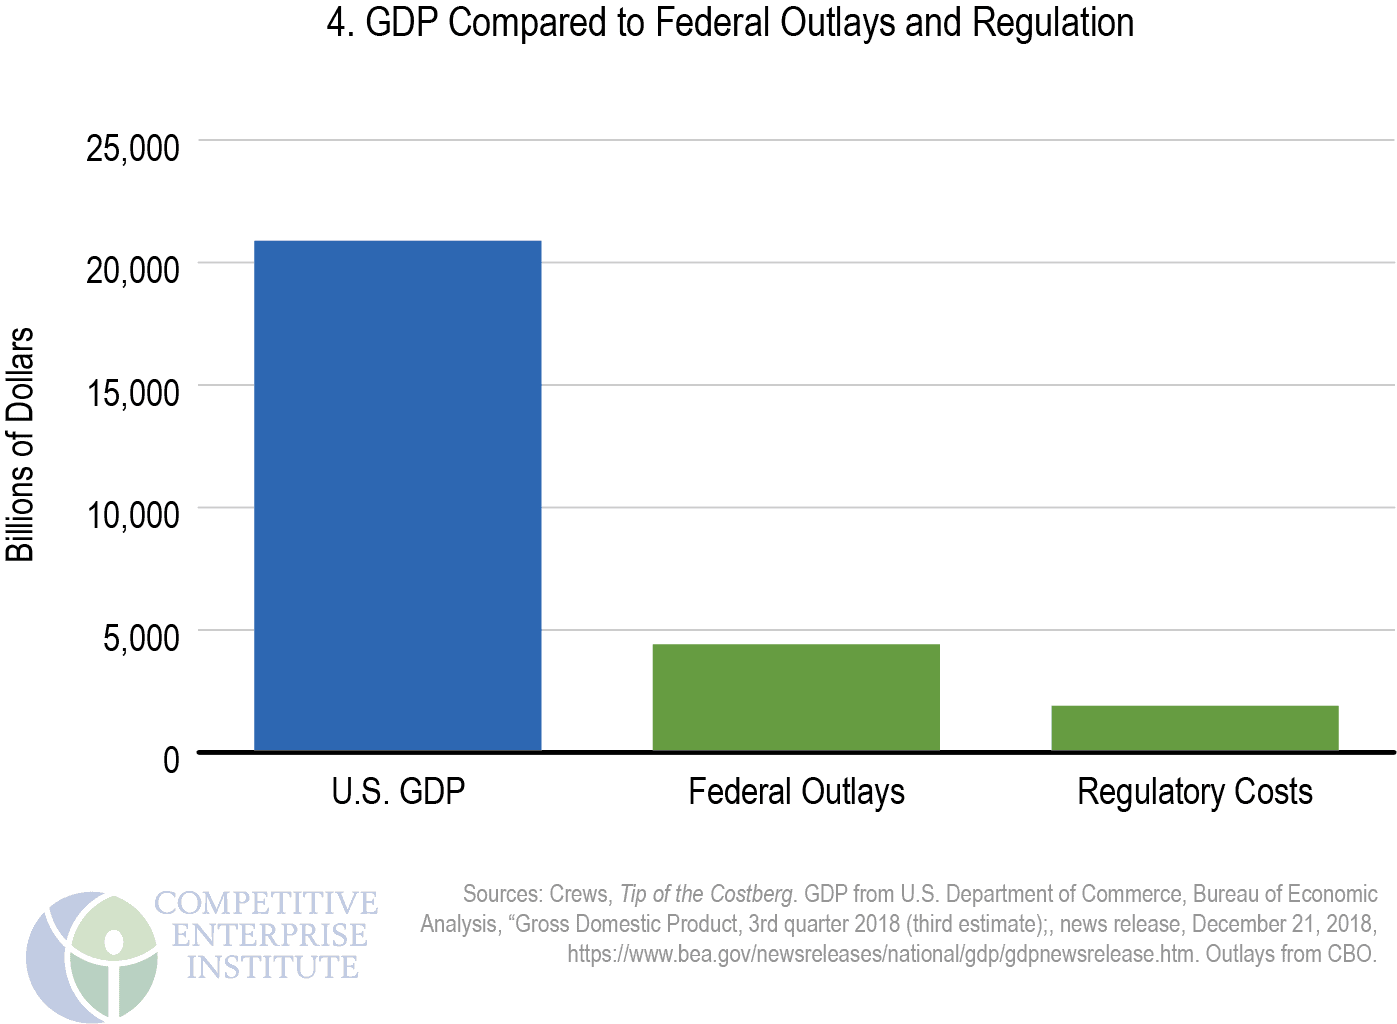
In January 2018, the Commerce Department’s Bureau of Economic Analysis estimated U.S. current-dollar GDP for 2018 at $20.66 trillion.[i] The total regulatory cost figure of $1.9 trillion annually is equivalent to approximately 9 percent of that amount (as noted, other estimates are far higher). Combining regulatory costs with federal FY 2019 projected outlays of $4.412 trillion (see Figure 2), the federal government’s share of the economy reaches $6.07 trillion, or 30 percent of GDP (see Figure 4). That does not include state and local spending and regulation. The percentage has been 30 percent for some time. Much that is new is already born into oversight by preexisting bureaus[ii] and is regulated without passing laws or even writing rules.[iii]
U.S. Regulation Compared with Some of the World’s Largest and Freest Economies
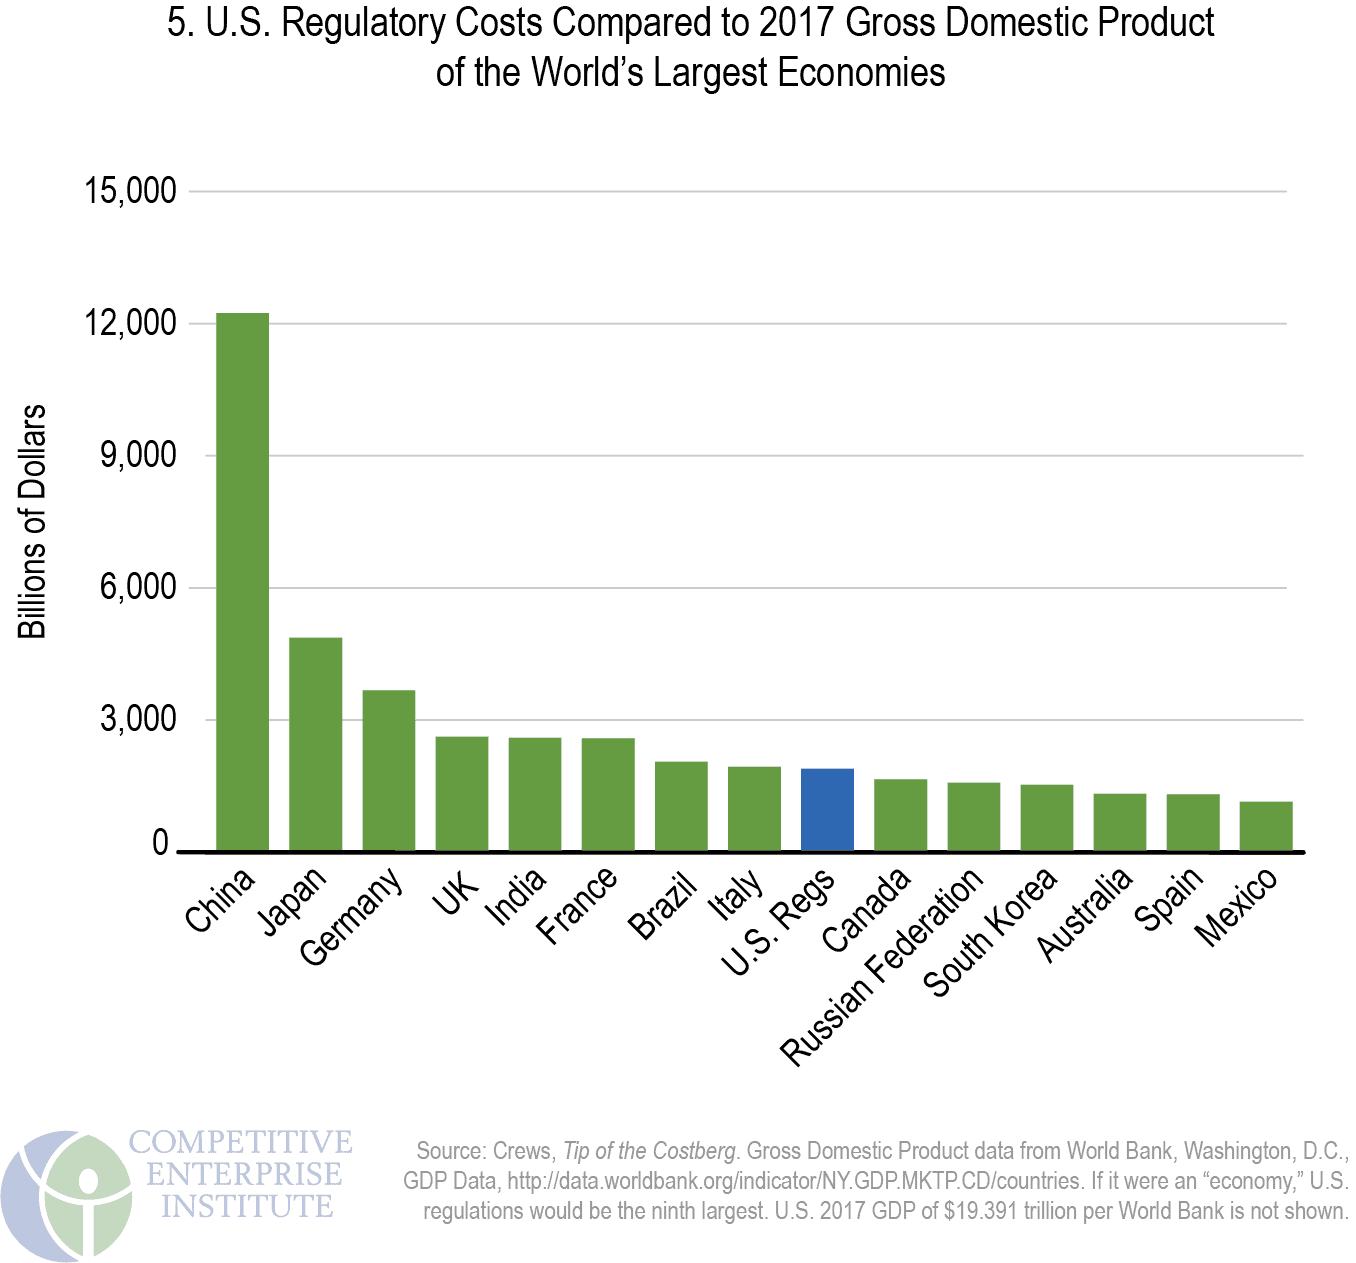
Not counting the United States, only eight countries have GDPs that exceed the cost burden of U.S. regulation. U.S. regulatory costs surpass the 2017 GDP of neighbors Canada, at $1.65 trillion, and Mexico, at $1.15 trillion. If U.S. regulatory costs of $1.9 trillion were a country, it would be the world’s ninth-largest economy, ranking behind India and ahead of Canada (see Figure 5).[i]
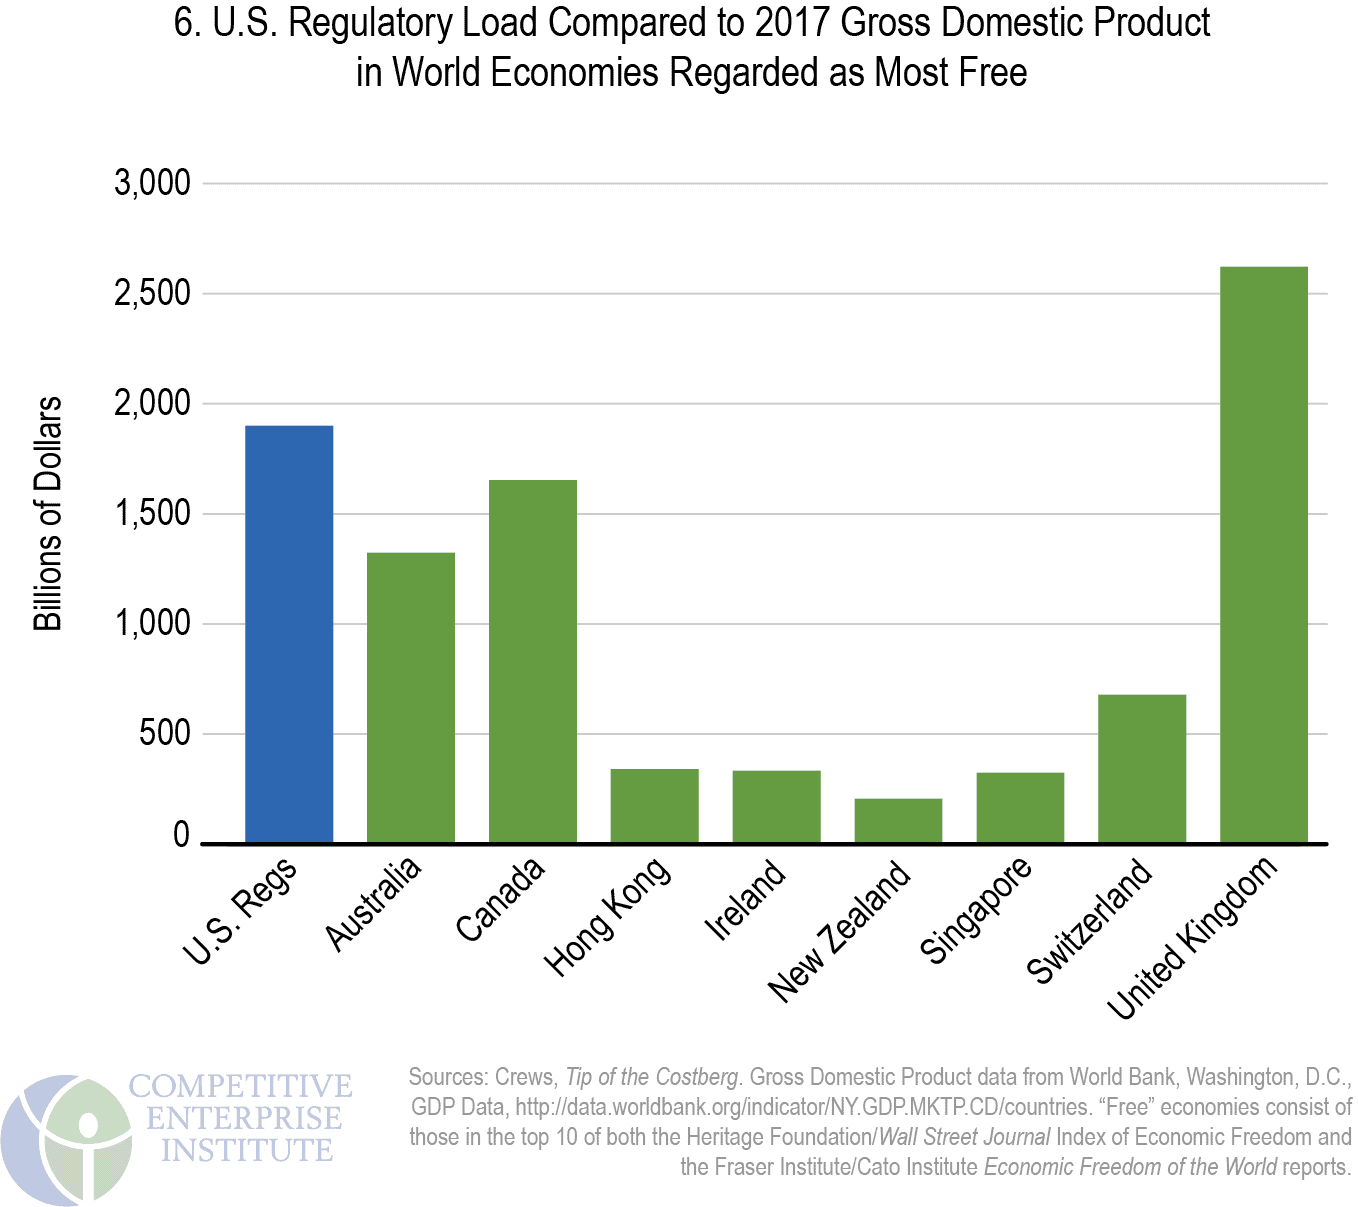
The U.S. regulatory figure of $1.9 trillion easily exceeds the output of many of the world’s major economies, including those, with the exception of the United Kingdom, ranked as the freest economically by two prominent annual surveys of global economic freedom. Figure 6 depicts the 2017 GDPs of the countries common to the top 10 in both the Wall Street Journal/Heritage Foundation Index of Economic Freedom, and the Fraser Institute/Cato Institute Economic Freedom of the World report.[i] The U.S. ranks 12th and sixth on these reports, respectively.
Regulation: A Hidden Tax on the Family Budget
Like the taxes they are required to pay, businesses will pass some regulatory costs on to consumers. Other costs will find their way to workers and investors in regulated companies. By assuming a full pass-through of all such costs to consumers—many consumers are also workers and owners through stock and mutual fund holdings—we can look at the share of each household’s regulatory costs and compare it with total annual expenditures as compiled by the Department of Labor’s Bureau of Labor Statistics (BLS).[i]
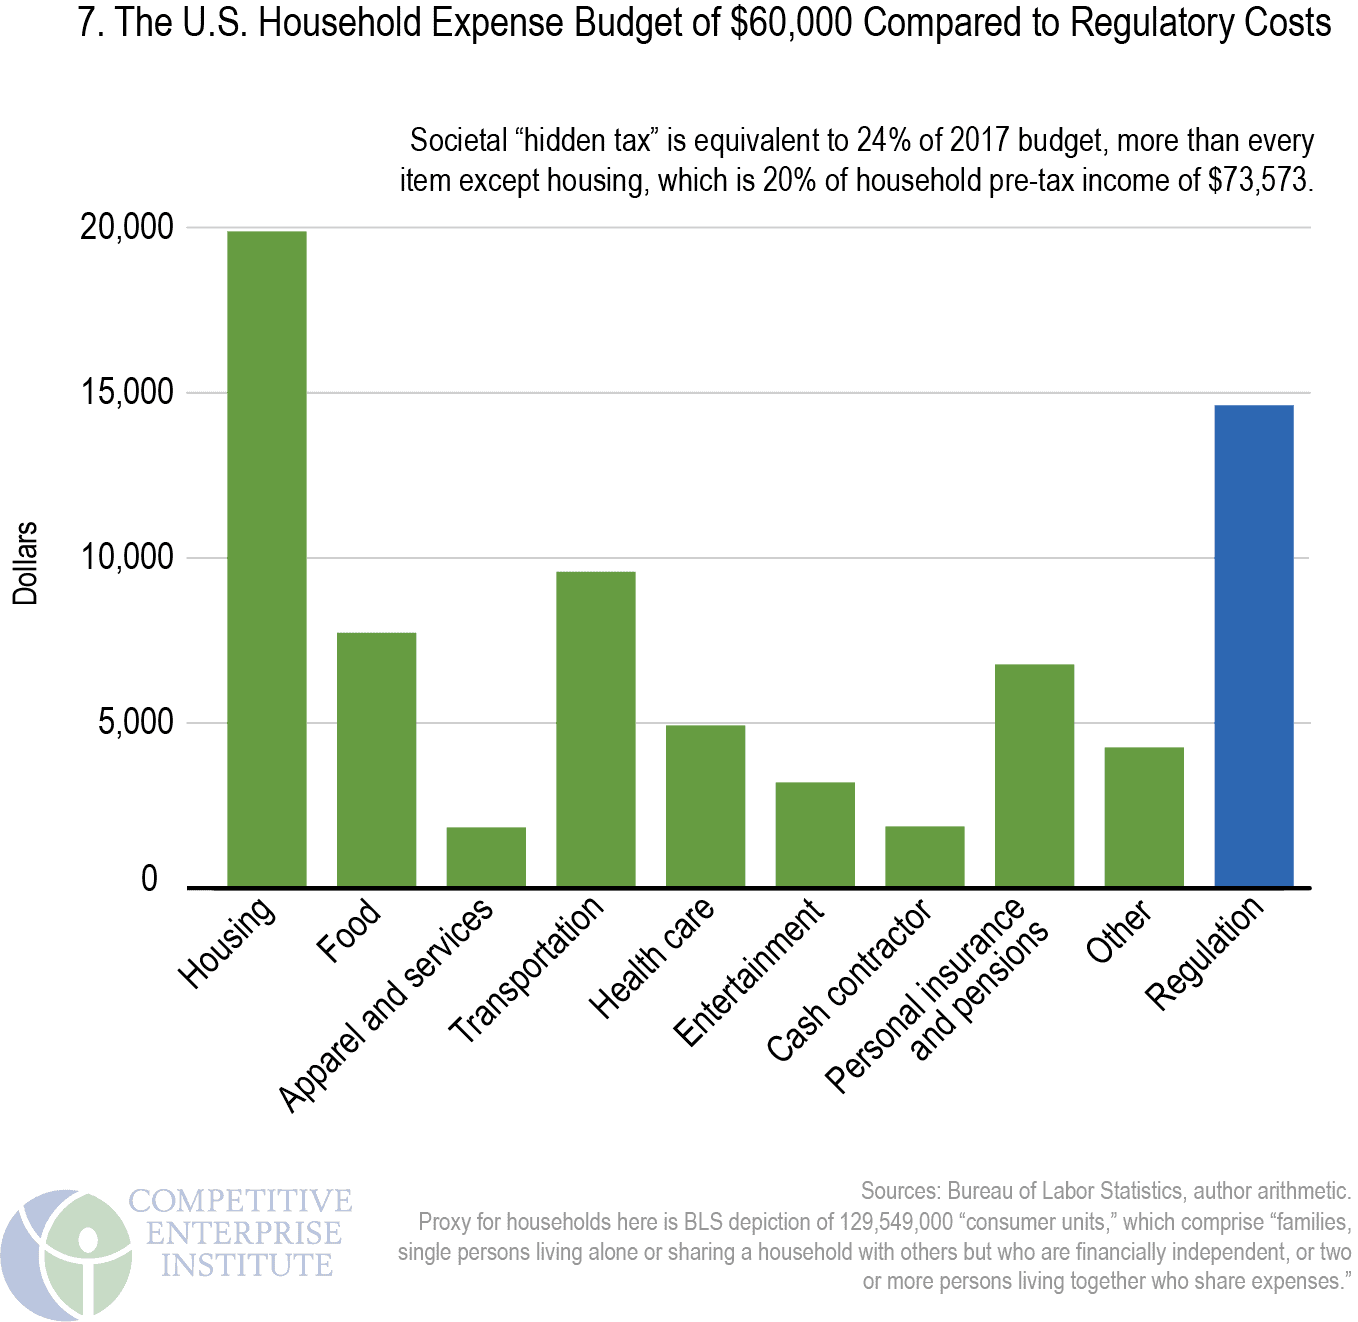
For America’s 130 million households, or “consumer units” in BLS parlance, the average 2017 pretax income was $73,573.[ii] If one were to allocate annual regulatory costs assuming, for simplicity’s sake, a full pass-through of costs to consumers, U.S. households “pay” $14,615 annually in embedded regulatory or intervention costs ($1.9 trillion in regulation divided by 130 million “consumer units”), or 20 percent of average income before taxes, and more as a share of after-tax income. This regulatory “hidden tax” is higher than every annual household budgetary expenditure item except housing (see Figure 7). Regulatory costs amount to up to 24 percent of the typical household’s expenditure budget of $60,060. The average U.S. household “spends” more on hidden regulation than on health care, food, transportation, entertainment, apparel, services, and savings. Of course, some costs of regulation are not hidden. Consumers pay for regulatory agencies more directly through taxes.
The Administrative and Enforcement Costs of Regulation
Regulatory estimates attempt to capture costs experienced by the public, but those estimates do not include administrative costs—the on-budget amounts spent by federal agencies to produce and enforce rules. The Weidenbaum Center at Washington University in St. Louis and the George Washington University Regulatory Studies Center regularly examine the president’s annual budget proposal to compile the administrative costs of developing and enforcing rules. These amounts—as funds that taxpayers contribute to support agencies’ administrative operations—are disclosed in the federal budget in a way that regulatory compliance and economic costs are not.
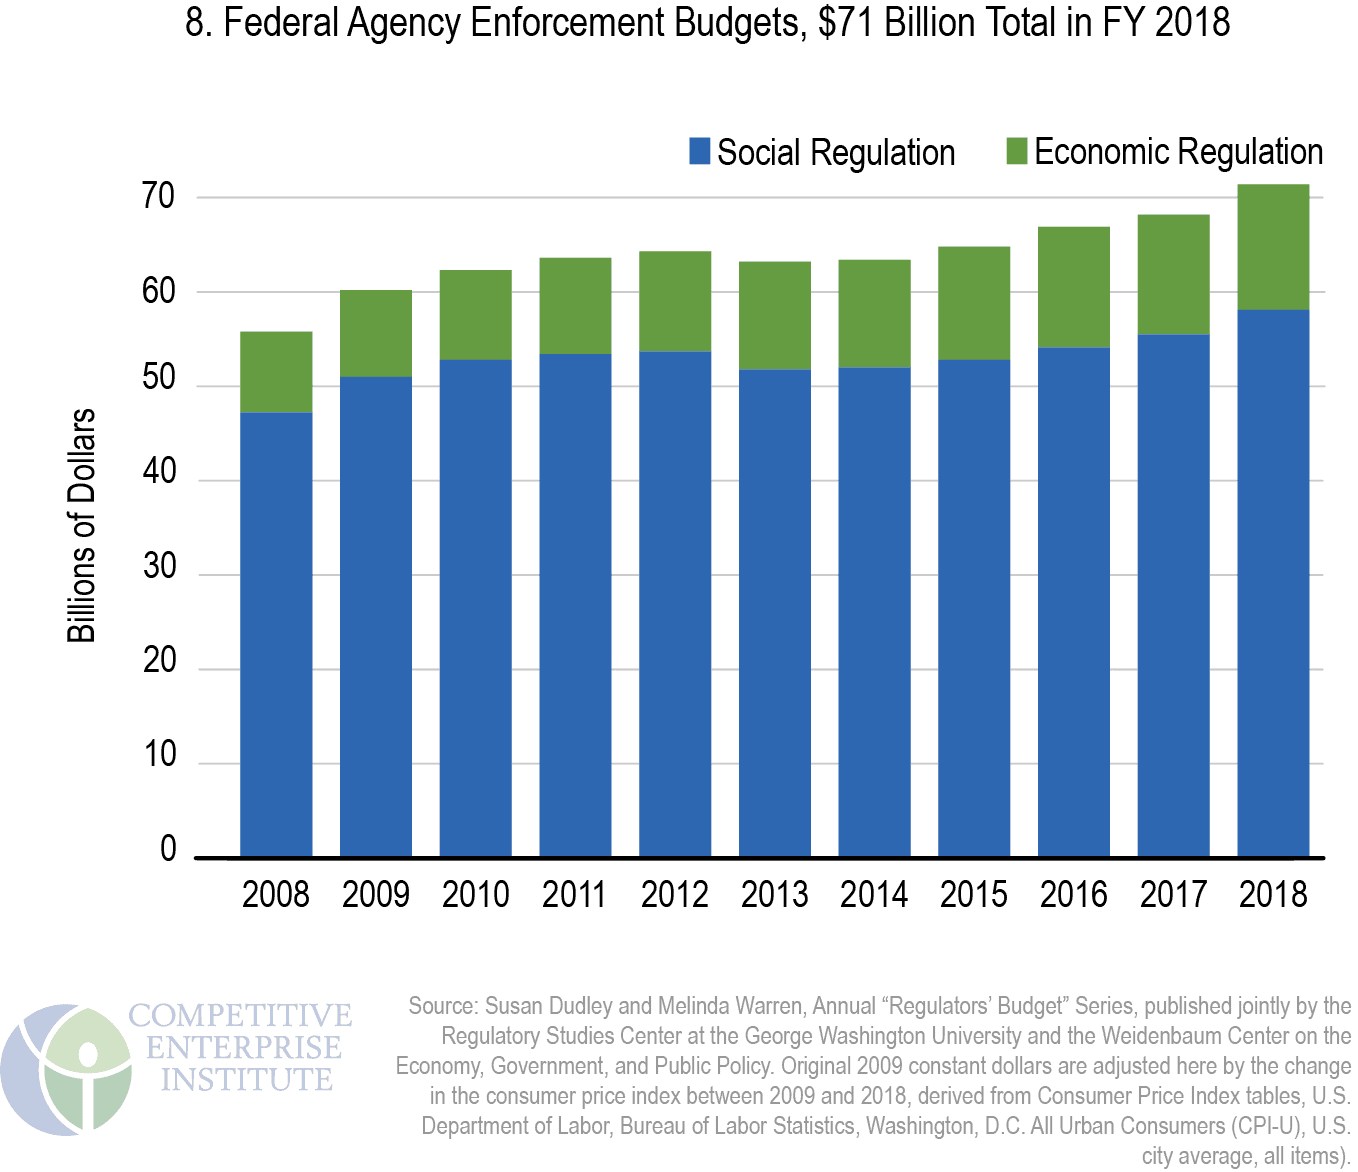
According to the latest compilation, FY 2018 enforcement costs incurred by federal departments and agencies stood at $71.4 billion (in constant 2018 dollars, adjusted from original 2009 dollars) (Figure 8).[i] Of that amount, $13.3 billion was incurred on administering economic regulations. The larger amount, spent on writing and enforcing social and environmental regulations, was $58.1 billion. The $71 billion in regulatory agency enforcement costs helps complete a picture of the federal regulatory apparatus, as these come on top of other estimates of regulatory compliance and economic burdens. In current dollars, the EPA alone spent an estimated $5.172 billion in this category in 2018, accounting for 7 percent of the total expected to be spent by all regulatory agencies.[ii] The EPA formerly accounted for the lion’s share of governmental administration and enforcement costs, but the Department of Homeland Security (DHS), at an estimated $33.3 billion, now comprises 48 percent.[iii]
The Weidenbaum Center and the Regulatory Studies Center also estimate the number of full-time-equivalent administrative and enforcement staff at 281,300 in FY 2017, up from 280,872 in 2017. The number of federal employees has increased well over 100,000 since the 2001 staffing level of 173,057.[i] Much of the post-2001 surge may be attributable to the then newly created Transportation Security Administration’s hiring of thousands of airport screening personnel.
Costs are one way to attempt to capture the size and scope of the federal regulatory enterprise, which is massive. Another is to assess the paper production—the regulatory material that agencies publish each year in sources like the Federal Register.