CEI Comments on EPA’s Proposed Review of the National Ambient Air Quality Standards for Particulate Matter
Docket ID No. EPA-HQ-OAR-2015-0072
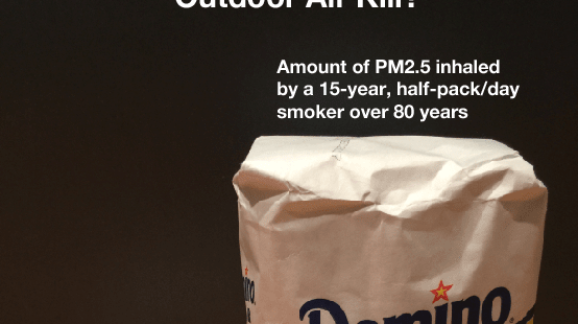
Photo Credit: Getty
Thank you for the opportunity to comment on EPA’s review of the national ambient air quality standards (NAAQS) for particulate matter (PM).[1]
EPA proposes to retain the existing PM standards without revision. EPA’s proposal is consistent with the advice of the agency’s Clean Air Scientific Advisory Committee (CASAC) on the primary 24-hour PM2.5 standard, the primary PM10 standard, and the secondary standards. However, not all CASAC members agree with EPA’s proposal to retain the annual primary PM2.5 standard. That proposal, moreover, is strongly opposed by many blue state politicians, progressive punditry, and, for want of a better term, the Regulatory Industrial Complex.[2]
Accordingly, this letter addresses only EPA’s proposal to retain the annual primary PM2.5 standard. The Competitive Enterprise Institute (CEI) strongly supports EPA’s proposed decision not to tighten the standard.
Summary of Argument
The comment letter identifies 20 epidemiological studies that do not find a PM2.5 mortality-link at exposures below the current NAAQS. EPA references none of those studies. The final rule should correct that oversight and specifically address two recent epidemiological studies—James Enstrom’s 2017 reanalysis of the American Cancer Society cohort study, and S. Stanley Young’s 2017 analysis of mortality rates and PM2.5 exposures in eight California air basins.
The final rule should also comment on mundane realities that conflict with the Killer PM2.5 narrative. “Almost-never” smokers do not experience massive reductions in average life expectancy even though their lifetime exposure to PM2.5 is ~50 times higher than that of non-smokers. Life expectancy in Beijing is roughly equal to life expectancy in Arlington County, Virginia, even though long-term PM2.5 concentrations in Beijing are 4-8 times higher.
Finally, recent claims of a significant link between PM2.5 exposure and COVID-19 mortality are implausible. Smoking and COVID-19 mortality are inversely related, yet smokers inhale much higher doses of PM2.5 than non-smokers inhale from outdoor air.
Statutory Background
The Clean Air Act requires EPA to set both primary (health-based) and secondary (welfare-based) NAAQS for air pollutants emitted by numerous or diverse mobile or stationary sources. The primary NAAQS are typically more stringent, as they must be set at a level “requisite to protect public health” with an “adequate margin of safety.” The EPA sets both annual (long-term exposure) and 24-hour (short-term exposure) primary NAAQS for particulate matter, calibrated in micrograms per cubic meter (µg/m3).
When describing PM, subscripts are used to denote particle size. Thus, PM2.5 includes airborne particles with diameters of 2.5 micrometers (µm) or less, while PM10 includes particles with diameters of 10 µm or less. For PM2.5, the current annual and 24-hour standards are 12 µg/m3 and 35 µg/m3, respectively.
EPA’s Rationale for Retaining the Existing Standards
EPA’s rationale may be summarized as follows. Given the “uncertainties” in recent epidemiological studies purporting to find significant health risks from PM2.5 exposures below the current NAAQS—uncertainties “due in part to the lack of supporting evidence from experimental studies”—EPA concludes that the scientific evidence “does not call into question the public health protection provided by the current annual and 24-hour PM2.5 standards.”[3] A somewhat more detailed explanation follows.
EPA begins by reviewing numerous epidemiological studies purporting to find significant correlations between cardiopulmonary-related mortality in various population segments and PM2.5 levels below the current NAAQS.[4] Epidemiology is a form of survey research—the application of statistics to health outcomes in a population. It discovers correlations between exposures and effects that may or may not have a causal basis. Epidemiology is more likely to find causal connections in cases where pathogen exposures correlate strongly to relatively rare health conditions or events.[5] However, epidemiology finds weak correlations between PM2.5 exposures and total (“all-cause”) mortality—a condition that befalls everyone—and between PM2.5 and common causes of mortality such as cardiopulmonary disease.
Nonetheless, the sheer number of PM2.5 epidemiological studies (the vast majority of which directly or indirectly depend on EPA funding) create the impression of compelling evidence.
Here is a key excerpt from that discussion:
A recent series of retrospective studies has additionally tested the hypothesis that past reductions in ambient PM2.5 concentrations have been associated with increased life expectancy or a decreased mortality rate (U.S. EPA, 2019, section 11.2.2.5). Pope et al. (2009) conducted a cross-sectional analysis using air quality data from 51 metropolitan areas across the U.S., beginning in the 1970s through the early 2000s, and found that a 10 µ/m3 decrease in long-term PM2.5 concentration was associated with a 0.61-year increase in life expectancy. In a subsequent analysis, the authors extended the period of analysis to include 2000 to 2007 (Correia et al., 2013), a time period with lower ambient PM2.5 concentrations. In this follow-up study, a decrease in long-term PM2.5 concentration continued to be associated with an increase in life expectancy, though the magnitude of the increase was smaller than during the earlier time period (i.e., a 10 µg/m3 decrease in long-term PM2.5 concentration was associated with a 0.35-year increase in life expectancy).[6]
However, correlation does not prove causation because many factors contribute to improvements in health and longevity. Although controlled human exposure studies demonstrate the biological plausibility of PM2.5 mortality effects, those studies do not indicate significant mortality risks at levels anywhere near the current annual standard (12 µg/m3). Rather, adverse effects are observed only at much higher exposures than current short-term standard (35 µg/m3). EPA explains:
Most of the controlled human exposure studies in Table 3–2 of the PA [Policy Assessment] have evaluated average PM2.5 exposure concentrations at or above about 100 µg/m3, with exposure durations typically up to about two hours. Statistically significant effects on one or more indicators of cardiovascular function are often, though not always, reported following 2-hour exposures to average PM2.5 concentrations at and above about 120 µg/m3, with less consistent evidence for effects following exposures to lower concentrations. Impaired vascular function, the effect identified in the ISA [Integrated Science Assessment] as the most consistent across studies (U.S. EPA, 2019, section 6.1.13.2), is shown following 2-hour exposures to PM2.5 concentrations at and above 149 µg/m3.[7]
Similarly, animal toxicology studies show adverse health effects only at much higher concentrations than the current annual and 24-hour standards:
As with controlled human exposure studies, most of the animal toxicology studies assessed in the ISA have examined effects following exposures to PM2.5 concentrations well-above the concentrations likely to be allowed by the current PM2.5 standards. Such studies have generally examined short term exposures to PM2.5 concentrations from 100 to >1,000 µg/m3 and long-term exposures to concentrations from 66 to >400 µg/m3 (e.g., see U.S. EPA, 2019, Table 1–2).[8]
EPA notes two exceptions—“a study reporting impaired lung development following long-term exposures (i.e., 24 hours per day for several months prenatally and postnatally) to an average PM2.5 concentration of 16.8 µg/m3 (Mauad et al., 2008) and a study reporting increased carcinogenic potential following long-term exposures (i.e., 2 months) to an average PM2.5 concentration of 17.7 µg/m3 (Cangerana Pereira et al., 2011).” However, EPA notes, “those concentrations are still above the ambient concentrations likely to occur in areas meeting the current primary standards.” Consequently, those studies are not evidence PM2.5 poses significant health risks to humans in areas meeting the current standard.
That experimental studies do not validate epidemiology-based alarm about PM2.5 health risks has been known for years. In their comprehensive review of “inhalation studies using concentrated ambient particles, diesel engine exhaust particulate matter, and sulfate and nitrate salts,” toxicologists Laura Green and Sarah Armstrong concluded: “Toxicologic data on typical forms of pollution derived PM strongly suggest that current ambient concentrations in the U.S. are too small to cause significant disease or death.”[9] That was in 2003, when PM2.5 levels were considerably higher than today. Indeed, during 2004-2019, average annual PM2.5 concentrations in the United States declined by 36 percent, according to EPA’s latest Air Quality Trends report.[10]
EPA emphasizes that although the statute’s “adequate margin of safety” language requires a precautionary approach to setting NAAQS, “the Act does not require the primary standards to be set at a zero-risk level; rather, the NAAQS must be sufficiently protective, but not more stringent than necessary.” Thus, EPA’s final decision must be a “public health policy judgment drawing upon scientific and technical information examining the health effects of PM2.5 exposures, including how to consider the range and magnitude of uncertainties inherent in that information.” EPA is “most confident in the potential of PM2.5 exposures to cause adverse effects at concentrations supported by multiple types of studies, including experimental studies as well as epidemiological studies.”[11]
Due to the “absence of evidence from experimental studies that PM2.5 exposures typical of areas meeting the current annual and 24-hour standards can activate biological pathways that plausibly contribute to serious health outcomes,” the Administrator is “cautious about placing too much weight” on the reported PM2.5 health effects in recent epidemiological studies. Thus, in the Administrator’s judgment, the scientific evidence as a whole “does not call into question the public health protection provided by the current annual and 24-hour PM2.5 standards.”[12]
Strengthening EPA’s Rationale
As indicated above, EPA gives the impression that the epidemiological literature, or its cutting edge, speaks with one voice about the dire perils of PM2.5. It is the case that, due to various incentives affecting EPA, air pollution researchers, and medical journals, the literature contains far more “positive” studies finding evidence of adverse PM2.5 health effects than “negative” studies finding no such evidence.[13]
Nonetheless, the epidemiological literature is not monolithic. Below is a list of 20 negative studies. None is mentioned or cited in EPA’s proposal, nor is any of the authors.[14] This is an unforced error. EPA should correct it in the final rule.
Here is a list of 20 negative epidemiological studies[15] EPA should review before finalizing the rule:
- Styer, P., McMillan, N., Gao, F., Davis, J., Sacks, J. 1995. Effect of outdoor airborne particulate matter on daily death counts. Environ. Health Perspect. 103:490-497.
- Enstrom JE. 2005. Fine particulate air pollution and total mortality among elderly Californians, 1973–2002. Inhalation Toxicology 17:803–816.
- Enstrom JE. 2006. Response to “A Critique of ‘Fine Particulate Air Pollution and Total Mortality Among Elderly Californians, 1973–2002’” By Bert Brunekreef, PhD. Inhalation Toxicology 18:509–514.
- Janes H, Dominici F, Zeger S. 2007. Trends in air pollution and mortality: An approach to the assessment of unmeasured confounding. Epidemiology 18:416–423.
- Smith RL, Xu B, Switzer PP. 2009. Reassessing the relationship between ozone and short-term mortality in U.S. urban communities, Inhalation Toxicology 29(S2):37–61.
- Berglind N, Ljungman P, Möller J, Hallqvist J, Nyberg N, Rosenqvist M, Pershagen G, Bellander T. 2010. Air Pollution Exposure—A Trigger for Myocardial Infarction? Int. J. Environ. Res. Public Health 7(4):1486-1499; doi:10.3390/ijerph7041486
- Greven S, Dominici F, Zeger S. 2011. An approach to the estimation of chronic air pollution effects using spatio-temporal information. Journal of the American Statistical Association 106:396–406.
- Krstic G. 2012. A reanalysis of fine particulate matter air pollution versus life expectancy in the United States, J Air Waste Manage Assoc. 62:989–991.
- Young SS, Xia JQ. 2013. Assessing geographic heterogeneity and variable importance in an air pollution data set. Statistical Analysis and Data Mining 6:375–386.
- Cox LA Jr, Popken DA, Ricci PF. 2013. Warmer is healthier: Effects on mortality rates of changes in average fine particulate matter (PM2.5) concentrations and temperatures in 100 U.S. cities. Regulatory Toxicology and Pharmacology. 66:336–346.
- Young, S.S., Fogel, P., 2014. Air pollution and daily deaths in California. In: Proceedings, 2014 Discovery Summit. https://community.jmp.com/docs/DOC-6691/.
- Cox LA Jr, Popken DA. 2015. Has Reducing Fine Particulate Matter and Ozone Caused Reduced Mortality Rates in the United States? Annals of Epidemiology 25(3):162-73.
- Wang X, Kindzierski W, Kaul P. 2015. Comparison of transient associations of air pollution and AMI hospitalization in two cities of Alberta, Canada, using a case-crossover design. BMJ Open. 5(11): e009169. (PMID:26553835 PMCID:pmc4654281)
- Zu, K., Tao, G., Long, C., Goodman, J., Valberg, P., 2016. Long-range fine particulate matter from the 2002 Quebec forest fires and daily mortality in Greater Boston and New York City. Air Qual. Atmos. Health 9:213-221.
- Vanasse A, Talbot D, Chebana F, Bélanger D, Blais C, Gamache P, Giroux J-X, Dault R, Pierre Gosselin P. 2017. Effects of climate and fine particulate matter on hospitalizations and deaths for heart failure in elderly: A population-based cohort study. Environment International 106:257–266.
- Young SS, Smith RL, Lopiano KK. 2017. Air quality and acute deaths in California, 2000-2012. Regulatory Toxicology and Pharmacology 88:173-184.
- Enstrom JE. 2017. Fine particulate matter and total mortality in Cancer Prevention Study cohort reanalysis. Dose-Response: An International Journal. 2017:1-12.
- Obenchain RL, Young SS. Local Control strategy: Simple analyses of air pollution data can reveal heterogeneity in longevity outcomes. Risk Analysis 37(9):1742-1753.
- You C, Lin DJK, Young SS. PM2.5 and ozone, indicators of air quality, and acute deaths in California. Regulatory Toxicology and Pharmacology. Volume 96, July 2018, Pages 190-196
- You C, Lin DJK, Young SS. 2018. Time series smoother for effect detection. PLoS ONE 13 (4): e0195360. https://doi.org/10.1371/journal.pone.0195360
The proposed rule takes pains to review recent epidemiological literature arguing for mortality effects below the current standard. The final rule should discuss at least some of the recent studies listed above.
Two examples must here suffice. A 2017 reanalysis of the American Cancer Society cohort study by UCLA epidemiologist James Enstrom finds “No significant relationship between PM2.5 and total mortality in the CPS II cohort . . . when the best available PM2.5 data were used.” Enstrom contends that Pope’s finding of a “positive association” is due to “selective use” of both cohort and PM2.5 data.[16]
California has the largest number of PM2.5 non-attainment areas in the country.[17] In a 2017 study, statistician S. Stanley Young and two colleagues analyzed large datasets for air quality and mortality in California during 2000-2012. Specifically, they examined more than 2 million deaths in eight air basins for possible PM2.5 associations on more than 37,000 exposure days.[18] The researchers find no effect of PM2.5 on mortality. In their words:
In this paper we examine daily death data for the eight most populous air basins in California for associations with air quality. We found no associations using regression-based time series analysis. Extensive sensitivity analyses found air quality variables do not add to the predictive ability of the models examined. Even when the predictive ability is improved, the improvement is negligible relative to a model that only uses time of year. The form of the air quality variable that comes into models is inconsistent across basin/year combinations. In short, we were unable to find a consistent and meaningful relationship between air quality and acute death in any of the eight California air basins considered.
Although science is often paradoxical, some incongruities between the Killer PM2.5 narrative and daily realities seem to defy explanation. Young, Enstrom, and seven other co-authors flag one such puzzle, namely, the fact that almost-never smokers inhale ~50 times as much PM2.5 over a lifetime than non-smokers, yet experience no increase in premature mortality, much less the massive reductions in life expectancy one would expect to occur if outdoor PM2.5 exposures were a major destroyer of heart health:
It is implausible that a never-smoker’s death could be caused by inhalation over an 80-year lifespan of about one teaspoon (~5 grams) of invisible fine particles as a result of daily exposure to 15 µg/m³. This level of exposure is equivalent to smoking about 100 cigarettes over a lifetime or 0.004 cigarettes per day, which is the level often used to define a never-smoker. The notion that PM2.5 causes premature death becomes even more implausible when one realizes that a person who smokes 0.2 cigarettes/day has a daily exposure of about 750 µg/m³. If a 10 µg/m³ increase in PM2.5 actually caused a 0.61-year reduction in life expectancy, equivalent to the claim of Pope, then a 0.2 cigarettes/day smoker would experience about a 45-year reduction in life expectancy, assuming a linear relationship between changes in PM2.5 and life expectancy. In actuality, never-smokers and smokers of 0.2 cigarettes/day do not experience any increase in total death rate or decrease in life expectancy, in spite of a 50-fold greater exposure to PM2.5.[19]
A CEI policy paper by regulatory analyst Steve Milloy makes a complementary argument:
Smokers are exposed to relatively immense amounts of PM2.5 as compared to levels in outdoor air. Someone breathing typical U.S. outdoor air, may inhale 100 micrograms (millionths of a gram) per day of PM2.5. Smoking a single cigarette, however, exposes a smoker to 10,000 to 40,000 micrograms in just a few minutes. Someone smoking an unfiltered marijuana joint may inhale as much as 160,000 micrograms in just a few minutes.
Given these immense PM2.5 exposures and the absence of reports of anyone ever dying in the immediate aftermath of smoking anything, the claim that inhaling any amount of PM2.5 from outdoor air can result in death within hours rings hollow.
What does the epidemiology of smoking tell us about long-term exposures to PM2.5? Someone living to age 80 or so breathing average U.S. air will inhale an ounce or so in total of PM2.5—an amount that can be visualized as two sugar packets’ worth of PM2.5. A recent study in the New England Journal of Medicine reported that people who stop smoking by age 35 have normal life expectancy, which translates to about 80 years for white women.[20] Assuming such an individual had smoked half a pack of cigarettes per day, she would have inhaled over four pounds of PM2.5. What does it say about the lethality of PM2.5 on a long-term basis if a non-smoker and smoker can have the same life expectancy despite the vast differences in PM2.5 inhaled—a sugar packet versus more than a sugar bag’s worth, respectively?[21]
Milloy illustrates the foregoing analysis with this photo.[22
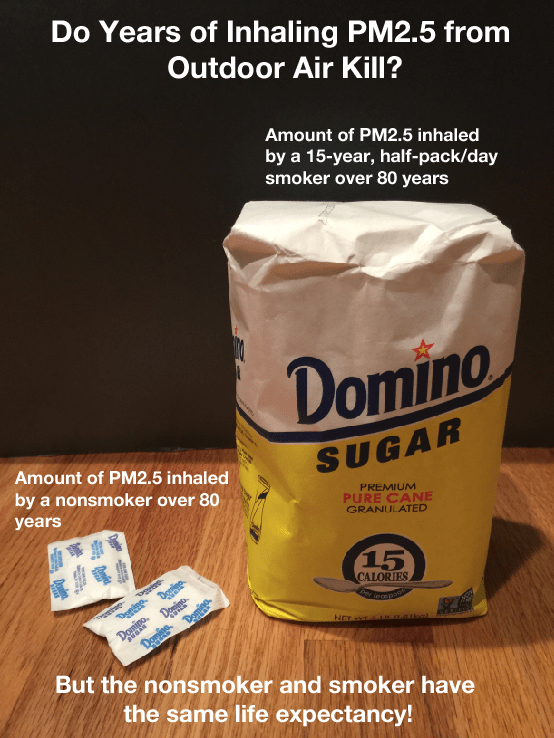
He concludes: “If one can inhale either a little or a lot of PM2.5 over the course of a lifetime and expect to live the same length of time, then PM2.5 does not kill on a long-term basis.”
In a 2009 paper, C. Arden Pope and seven colleagues try to square PM2.5 epidemiology with the aforesaid daily realities. They report that the average dose of PM2.5 from cigarette smoking is estimated to be from 7 to 17.5 milligrams per cigarette—roughly 1,000 times the mass of PM2.5 in a cubic meter of outdoor air in the United States. So, why are smokers not dropping like flies from heart disease given the vastly greater quantities of PM2.5 they inhale? Conversely, how can ambient PM2.5 concentrations be a major destroyer of heart health if smokers are not dropping like flies?
The authors state the problem in more technical terms:
The cardiovascular mortality effect estimates from studies of ambient fine particulate pollution and secondhand cigarette smoke (SHS) are much higher than would be expected on the basis of extrapolations of the effects of active cigarette smoking that assume a linear dose-response relationship that goes through the origin. Conversely, linear extrapolations of exposure-response functions estimated from the air pollution and SHS literature to very high levels of exposure predict cardiovascular death rates that are higher than considered plausible.[23]
Pope et al.’s solution is to postulate that the “exposure-response relationship between cardiovascular disease mortality and fine particulate matter is relatively steep at low levels of exposure and flattens out at higher exposures.” As noted, science is often paradoxical. Nonetheless, it is hard to imagine a poison that kills at small doses but becomes progressively less lethal at higher rates of consumption. Do other toxins work that way?
Milloy points to another daily reality not easily explained by mainstream PM2.5 epidemiology: PM2.5 levels in Beijing are much higher than in the Washington Metropolitan region, yet life expectancies in the two areas are roughly equal.[24]
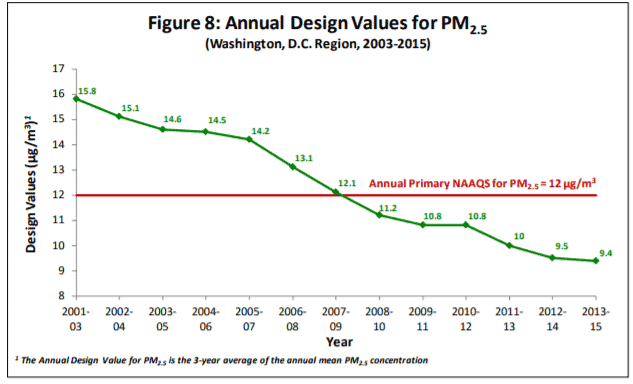
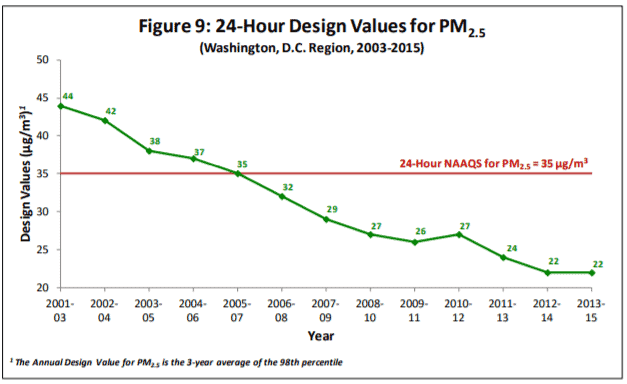
For several years, PM2.5 levels in the Washington, D.C. metropolitan area have been lower than the 2012 annual and 24-hour standards.[25]
The average life expectancy in the Washington metropolitan area is 78 years, or 0.6 years lower than the national average. Arlington County has an average life expectancy of 82.7 years, presumably due to residents’ higher-than-average income, education, and access to high-quality medical care.[26]
Beijing’s PM2.5 levels during June 28-29, 2020 ranged from 68 to 183 µg/m3 with an average level of 104 µg/m3.[27] Beijing’s average annual level in 2019 was 42 µg/m3—down from 85 µg/m3 in 2014.[28] Thus, although air quality is improving, the elderly in Beijing have much higher lifetime exposures to PM2.5 than do Arlington County residents. Yet, according to the Chinese government news agency, average life expectancy in Beijing is 82.2 years.[29]
Health data emanating from the People’s Republic should be viewed with skepticism. Nonetheless, if people on average live about as long in Beijing as they do in an affluent part of the Washington Metropolitan Region, it is hard to understand how revising the annual PM2.5 standard from 12 µg/m3 to 10 µg/m3 would achieve significant health benefits for the American people.
PM2.5 and COVID-19
In early April 2020, Harvard University researchers released a study purporting to find that “an increase of only 1 µg/m3 in PM2.5 is associated with a 15% increase in the COVID-19 death rate.”[30] Within weeks of the non-peer reviewed study’s release, the researchers revised their mortality estimate. As reported in the Washington Post, “Instead of linking an increase in exposure of one microgram per cubic meter to a 15 percent greater likelihood of dying of covid-19, the team said instead it is associated with an 8 percent increase in mortality.”[31]
Blue state politicians and public health advocates touted the study, citing it as a reason EPA should tighten the PM2.5 NAAQS. Some also applauded a March 2020 Earth Systems study that estimated the coronavirus lockdown saved 77,000 lives in China—far outweighing China’s virus-related deaths—just by reducing PM2.5 pollution.[32] The consistency between the two studies is not obvious.
Long-term average PM2.5 levels in the United States have been at or below 12 µg/m3 since 2012[33] whereas annual PM2.5 levels in Wuhan averaged 89.6 µg/m3 in 2017.[34] So, if, per the Harvard study, each additional 1 µg/m3 of PM2.5 increases coronavirus deaths by 8 percent, Wuhan should have experienced 7 times the number of U.S. coronavirus deaths per unit of population. Yet, if, per the Earth Systems study, the drop in short-term PM2.5 levels avoided 77,000 premature deaths in China, similar lockdown policies should also have saved lives in the United States.
It would be interesting to know how the authors of the two studies would combine or net out their respective results. In any event, the Harvard study is hard to square with a new study that finds a “significant inverse correlation of smoking prevalence and COVID-19 mortality rates” in both “hot” and “cold” countries.[35] Milloy reviews the study on his blog. He writes:
Smoking is a very intense exposure to PM2.5. In breathing an hour of average US air, you will shallowly inhale less than 9 micrograms of PM2.5. Compare that with smoking a single cigarette during which you will deeply inhale anywhere from 10,000 to 40,000 micrograms of PM2.5.
The Harvard Howler claimed that every extra 1 microgram of PM2.5 inhaled per hour increased the risk of COVID-19 death by 15%.
But this new study from University of Washington and Stanford University researchers reports an inverse relationship between smoking and death from COVID-19—i.e., countries with higher rates of smoking had lower rates of death from COVID-19.
If the Harvard Howler claim were true, that relationship would be just the opposite.
The new study is here (Web | PDF).
Although the new study has yet to be peer-reviewed, it is not the first study to report this inverse association.
The new study doesn’t show that smoking is protective against COVID-19, but it does show that PM2.5 doesn’t worsen COVID-19.[36]
Conclusion
EPA correctly argues that controlled human exposure and animal toxicology studies do not support claims that PM2.5 poses significant mortality risks at today’s historically low levels. However, EPA should not let pro-regulatory epidemiologists speak for their entire profession. The final rule should identify “negative” epidemiological studies (those that do not find a PM2.5 mortality-link at exposures below the current NAAQS), and comment specifically on James Enstrom’s 2017 reanalysis of the American Cancer Society cohort study and S. Stanley Young’s 2017 analysis of mortality rates and PM2.5 exposures in eight California air basins.
The final rule should also comment on the disconnect between the Killer PM2.5 narrative and daily realities that do not comport with it. People who smoke 100 cigarettes over a lifetime experience no measurable decrease in life expectancy yet inhale ~50 times as much PM2.5 as non-smokers do from the ambient air. Beijing’s PM2.5 levels are 4-8 times higher than those in Arlington Country, Virginia, yet life expectancies are about the same. The claim that each microgram per cubic meter increase in ambient PM2.5 levels significantly increase COVID-19 deaths is implausible. Smokers inhale much greater quantities of PM2.5 than non-smokers do, and data from 40 countries suggests there is a highly significant inverse correlation between COVID-19 mortality and smoking prevalence.
Respectfully Submitted,
Marlo Lewis, Jr., Ph.D.
Senior Fellow Energy & Environmental Policy
Competitive Enterprise Institute
1310 Connecticut Ave. NW
Washington, DC 20005
202-331-1010
[1] EPA, Review of the National Ambient Air Quality Standards for Particulate Matter, 85 FR 24094-24144, April 30, 2020, https://www.regulations.gov/document?D=EPA-HQ-OAR-2015-0072-0069
[2] After urging Americans to guard against the “unwarranted influence” of the “military-industrial complex,” President Dwight D. Eisenhower, in his Farewell Address, noted the growing dependence of academic research on federal money, and the associated “danger that public policy could itself become the captive of a scientific-technological elite.” Text available at https://www.ourdocuments.gov/doc.php?flash=false&doc=90&page=transcript
[3] 85 FR 24120
[4] 85 FR 24106-24114
[5] Steve Milloy, Scare Pollution: Why and How to Fix the EPA (USA, 2016), p. 6.
[6] 85 FR 24206-07
[7] 85 FR 24115-16
[8] 85 FR 24116
[9] Laura C. Green and Sarah R. Armstrong, “Particulate matter in ambient air and mortality: toxicologic
perspectives,” Regulatory Toxicology and Pharmacology, Volume 38, Issue 3, December 2003, Pages 326-335,
https://www.sciencedirect.com/science/article/pii/S0273230003000990
[10] EPA, Our Nation’s Air, Declining Air Pollution Concentration Averages, https://gispub.epa.gov/air/trendsreport/2020/#air_trends
[11] 85 FR 24119
[12] 85 FR 24119-24120
[13] Jason Johnston, “The EPA’s Conflicted ‘Science’ on PM2.5 Mortality,” in Michaels and Keeley, eds., Scientocracy: The Tangled Web of Public Science and Public Policy (Washington, D.C.: Cato Institute, 2019)
[14] Except for Anthony Cox, who is cited in his capacity as CASAC Chairman but not for his contributions to the literature.
[15] Modified from a list put together by statistician S. Stanley Young.
[16] James E. Enstrom, “Fine Particulate Matter and Total Mortality in Cancer Prevention Study Cohort Reanalysis,” Dose-Response: An International Journal, January-March 2017:1-12, https://www.ncbi.nlm.nih.gov/pmc/articles/PMC5407529/pdf/10.1177_1559325817693345.pdf
[17] EPA, PM2.5 (2012) Non-Attainment Area, Area/State/County/Report, Data Current as of May 31, 2020, https://www3.epa.gov/airquality/greenbook/knca.html
[18] S. Stanley Young, Richard L. Smith, Keneth K. Lopiano, “Air quality and acute deaths in California, 2000-2012,” Regulatory Toxicology and Pharmacology, 88 (2017) 173-184, https://junkscience.com/wpcontent/uploads/2017/11/Young-2017-CA-data-RTP.pdf
[19] Text available at http://www.scientificintegrityinstitute.org/Science100615.pdf
[20] Prabhat Jha et al, “21st-Century Hazards of Smoking and Benefits of Cessation in the United States,” New England Journal of Medicine, Vol. 368, No. 4 (January 24, 2013), pp. 341-350, https://www.nejm.org/doi/full/10.1056/NEJMsa1211128
[21] Steve Milloy, Will the Trump Fuel Economy Reform Proposal Create Deadly Air Pollution? On Point No. 250, Competitive Enterprise Institute, October 17, 2018, p. 7, https://cei.org/sites/default/files/Steve_Milloy_-_Will_CAFE_Reform_Proposal_Create_Deadly_Air_Pollution%20%281%29.pdf
[22] Steve Milloy, “How does this photo debunk EPA’s most important ‘scientific’ claim? JunkScience.Com, June 9, 2016, https://junkscience.com/2016/06/how-does-this-photo-debunk-epas-most-important-scientific-claim/
[23] C. Arden PopeIII, Richard T. Burnett, Daniel Krewski, Michael Jerrett, Yuanli Shi, Eugenia E. Calle, and Michael J. Thun. 2009. Cardiovascular Mortality and Exposure to Airborne Fine Particulate Matter and Cigarette Smoke: Shape of the Exposure-Response Relationship. Circulation Vol. 120, No. 11, https://www.ahajournals.org/doi/full/10.1161/circulationaha.109.857888
[24] Milloy, Scare Pollution, pp. 207-210
[25] Department of Environmental Programs, Metropolitan Washington Council of Governments, Air Quality Trends, Metropolitan Washington D.C. Region, 1993-2016, file:///C:/Users/marlo/Downloads/Item_5_DRAFT_AQ_Trend_Report_2017.pdf
[26] Dan Taylor, “D.C.: Here’s How Long Your Life Expectancy Is,” Patch, October 1, 2019, https://patch.com/district-columbia/washingtondc/dc-heres-how-long-your-life-expectancy
[27] Beijing Air Quality: Real Time Air Quality Index (AQI), accessed 1:40 a.m. EST, https://aqicn.org/city/beijing/
[28] Smart Air, Beijing PM2.5 Air Quality Report – 2019 Statistics, https://smartairfilters.com/en/blog/beijing-air-pollution-2019-report-statistics/
[29] Xinhaunet, “Beijing life expectancy hits 82.2 years,” February 21, 2019, http://www.xinhuanet.com/english/2019-02/21/c_137840135.htm#:~:text=BEIJING%2C%20Feb.,municipal%20health%20commission%20on%20Thursday.
[30] Xiao Wu, Rachel C. Nethery, M. Benjamin Sabath, Danielle Braun, and Francesca Dominici, Exposure to air pollution and COVID-19 mortality in the United States, April 5, 2020, https://projects.iq.harvard.edu/files/covidpm/files/pm_and_covid_mortality.pdf
[31] Dino Grandoni, “A Harvard study tying coronavirus death rates to pollution is causing an uproar in Washington,” Washington Post, May 7, 2020, https://www.washingtonpost.com/news/powerpost/paloma/the-energy202/2020/05/07/the-energy-202-a-harvard-study-tying-coronavirus-death-rates-to-pollution-is-causing-an-uproarin-washington/5eb2eb6588e0fa42c41b3ba1/
[32] Jeff McMahon, “Study: Coronavirus Lockdown Likely Saved 77,000 Lives in China Just by Reducing Pollution,” Forbes, March 16, 2020, https://www.forbes.com/sites/jeffmcmahon/2020/03/16/coronavirus-lockdown-may-have-saved-77000-lives-in-china-just-from-pollution-reduction/#677c95a034fe
[33] EPA, Particulate Matter Trends, https://www.epa.gov/air-trends/particulate-matter-pm25-trends
[34] Wang S. et al., Characteristics and origins of air pollutants in Wuhan, China, based on observations and hybrid receptor models. 2017. Journal Air Waste Management Association. 67(7): 739-753, https://www.ncbi.nlm.nih.gov/pubmed/27686014
[35] Michael J. Norden, David H. Avery, Justin G. Norden, David R. Haynor, National Smoking Rates Correlate Inversely with COVID-19 Mortality, https://junkscience.com/wp-content/uploads/2020/06/2020.06.12.20129825v1.full_.pdf
[36] Steve Milloy, “Boom: Harvard PM2.5-COVID-19 study destroyed by study on smoking and COVID-19,” JunkScience.Com, June 24, 2020, https://junkscience.com/2020/06/boom-harvard-pm2-5-covid-19-study-destroyed-by-study-on-smoking-and-covid-19/