House Climate Hearing off to Bad Start
 The newly-minted environment and climate change subcommittee of the House Energy and Commerce Committee will hold a hearing today titled “Time for Action: Addressing the Environmental & Economic Effects of Climate Change.” If the majority staff’s briefing memo is any indication, the hearing will be a platform for alarmism, groupthink, and virtue signaling.
The memorandum begins by invoking the latest high-profile doomsday report, the U.S. Global Change Research Program’s Fourth National Climate Assessment (NCA), published in November 2018. The staff may actually believe the NCA builds a scientific case for “climate action.” It does not. To demonstrate this, I will examine the memo’s opening paragraph, which concisely summarizes the Assessment’s findings.
The memo begins as follows:
On November 23, 2018, the U.S. Global Change Research Program released its Fourth National Climate Assessment (NCA) detailing the widespread impacts of climate change across all parts of the United States. The NCA warned that, in the absence of climate action, average global temperatures could rise by at least three degrees Celsius (°C) by 2100, prompting sea levels to rise by as much as four feet by that year. According to the assessment, Americans are already experiencing increased frequency and intensity of extreme weather, heat waves, wildfires, and flooding due to climate change. The NCA also shows that inaction will lead to significant economic and other damages. By 2090, lost wages will reach $155 billion, mortality from extreme temperatures will surpass $140 billion, and coastal property damage will approach $120 billion. All told, the U.S. economy could lose more than ten percent of its GDP under the worst-case scenario.
Let’s take each of those statements in turn. “The NCA warned that, in the absence of climate action, average global temperatures could rise by at least three degrees Celsius (°C) by 2100, prompting sea levels to rise by as much as four feet by that year.” More precisely, the NCA warned that average global temperatures “could increase by 9°F (5°C) or more by the end of this century compared to preindustrial temperatures” (p. 73). How does the NCA make that projection? By running an ensemble of overheated climate models with an inflated “baseline” emission scenario.
Preliminaries: RCPs, Radiative Forcing, and Climate Sensitivity
There are two key inputs to any warming forecast. The first is an emissions scenario. Most current climate assessments use four standardized scenarios called representative concentration pathways. RCPs project how greenhouse gas emissions, concentrations, and the associated radiative forcing will change over some specified time period, usually from 2000 to 2100 and later.
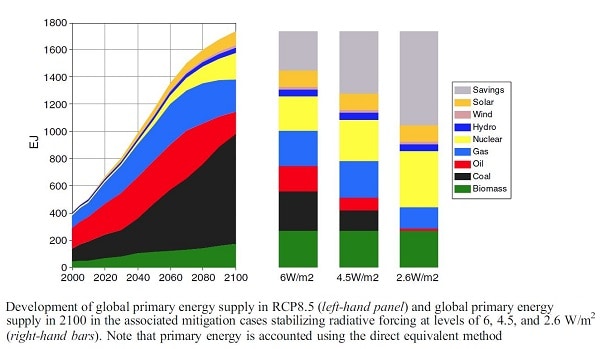
Radiative forcing is a measure of anything that influences the planetary balance between incoming solar energy and outgoing longwave radiation. Several factors, both natural and man-made, can affect that balance. The forcing effects of such factors can be either negative (cooling) or positive (warming), but all are measured in terms of watts per square meter. Accordingly, each RCP is labeled by its estimated W/m2 forcing. In RCP2.6, aggressive mitigation efforts achieve zero-net greenhouse gas emissions by 2050 and produce a positive forcing of 2.6W/m2 in 2100. In RCP8.5, the warmest scenario, rapidly increasing emission concentrations produce a positive forcing of 8.5 W/m2 in 2100. The other two pathways, RCP4.5 and RCP6.0, assume the adoption of climate change mitigation policies that “stabilize” emissions concentrations at higher levels than RCP2.6.
The second critical input to warming projections is an estimate of climate sensitivity, which is usually defined as the long-term temperature change associated with a doubling of carbon dioxide equivalent greenhouse gas concentration. Climate sensitivity is an active area of scientific research and debate. Why? In the memorable words of MIT economics professor Robert Pindyck, “the physical mechanisms that determine climate sensitivity involve crucial feedback loops, and the parameter values that determine the strength (and even the sign) of those feedback loops are largely unknown, and for the foreseeable future may even be unknowable.”
In its 2007 Fourth Assessment Report, the UN Intergovernmental Panel on Climate Change (IPCC) concluded that 3°C was the “best estimate” of climate sensitivity. However, because several subsequent studies estimated a lower sensitivity, the IPCC’s 2013 Fifth Assessment Report (p. 16) offered no best estimate. Rather, the IPCC opined that climate sensitivity is “likely” to range from 1.5°C to 4.5°C. And guess what? That was also the likely range in the IPCC’s First Assessment Report in 1990 (p. xxv). The IPCC is no closer today than it was a quarter century ago to pinning down an exact value for the most important variable in climate change science. The majority staff briefing memo makes no mention of this highly consequential known unknown.
Chill: You’re Too Sensitive!
All projections in the National Climate Assessment “are based on global model results and associated downscaled products from CMIP5 for a lower scenario (RCP4.5) and a higher scenario (RCP8.5).” CMIP5 is the acronym for the ensemble of 32 models used in the IPCC’s Fifth Assessment report. NCA projections are based on the “multi-model mean” of the CMIP5 models (p. 110).
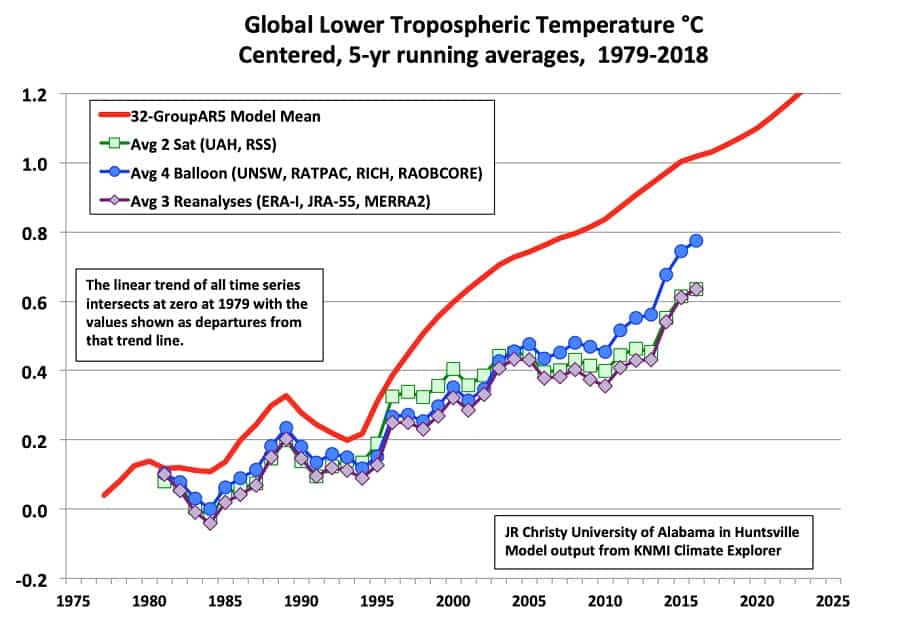
So here we encounter the first systemic problem in the Fourth National Climate Assessment on which the subcommittee’s majority relies. Since 1979, the CMIP5 model mean has projected roughly twice as much global warming as has actually occurred in the global lower atmosphere and nearly three times as much warming as observed in the tropical bulk atmosphere, where greenhouse theory expects the most rapid warming to occur.
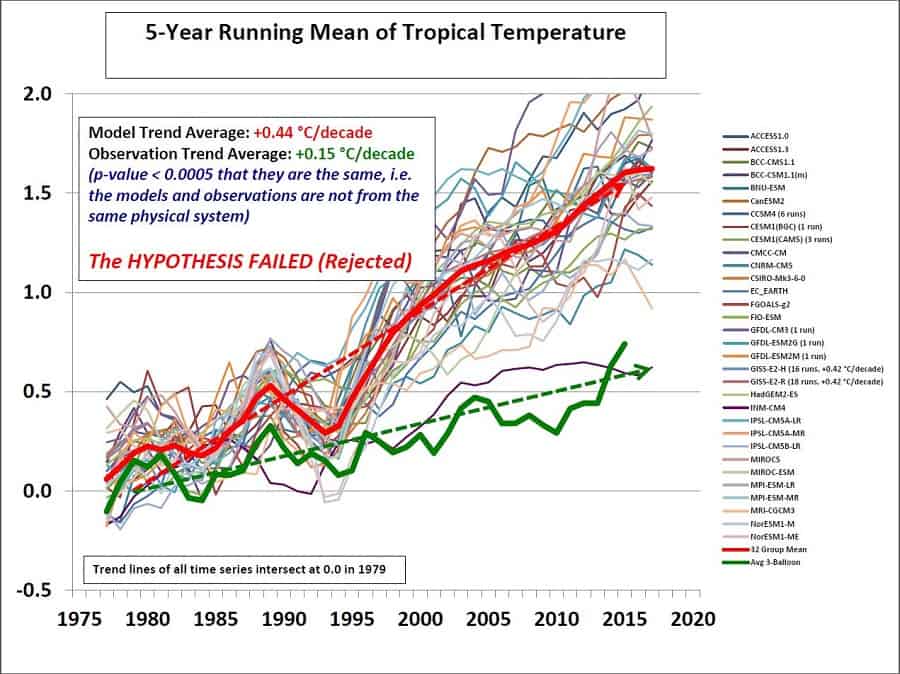
To put this another way, the average sensitivity of the CMIP5 models is 3.2°C. The average sensitivity in recent (2011-2017) studies, using empirical data to constrain estimates of climate sensitivity, is below 2°C.
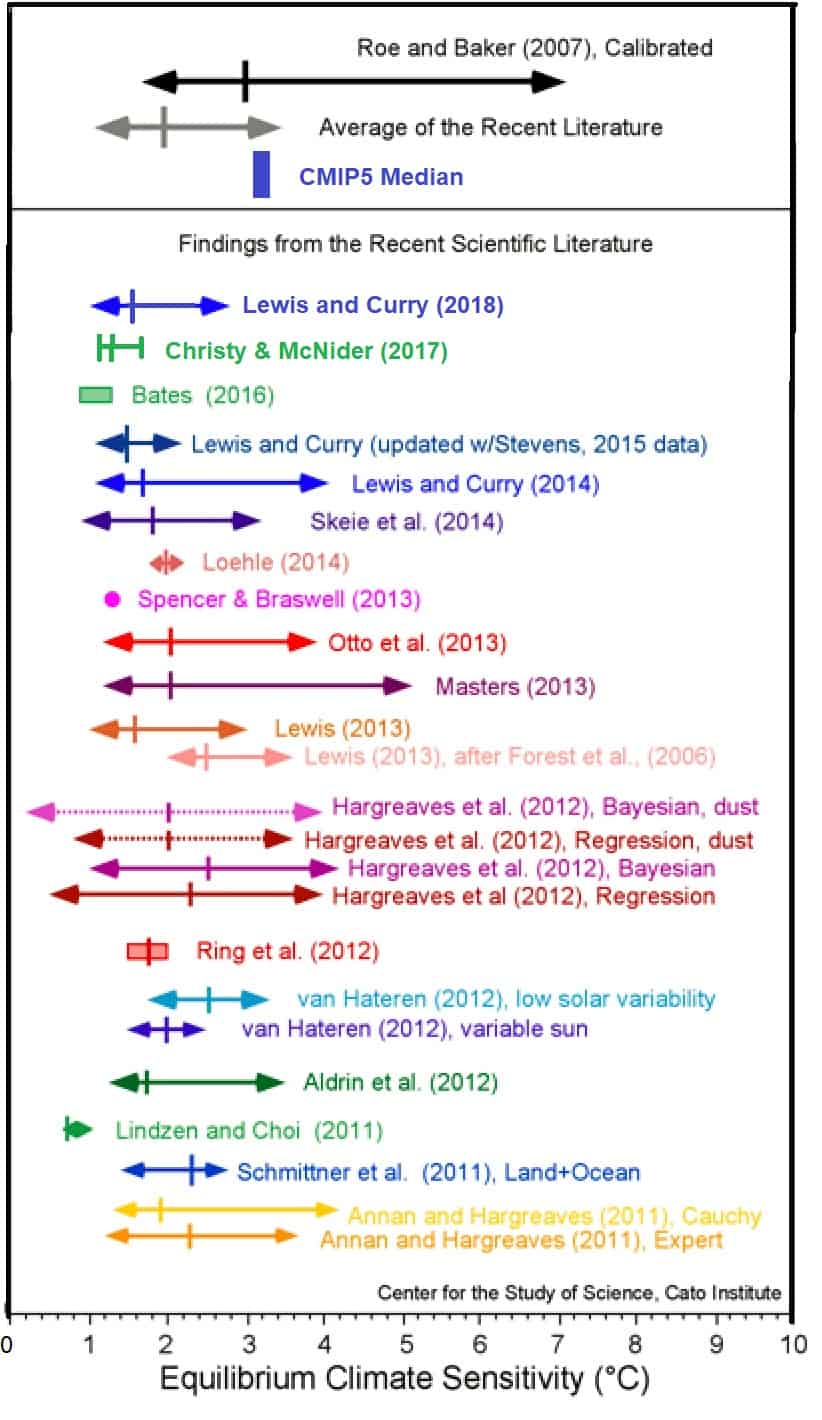
Figure 3 source: Patrick Michaels and Ryan Maue
The divergence between the CMIP5 model mean and observed temperatures is evidence that most climate models overestimate climate sensitivity. Among the CMIP5 models, only the Russian INM-CM4 accurately tracks observed temperatures from 1979 to 2017, notes Cato Institute climatologist Patrick Michaels. All the rest run too hot, as can be seen in Figure 2 above.
Michaels puts this in perspective. When meteorologists forecast the weather for a particular region, they use the model or models that actually get things right, not the average of all models regardless of their lack of predictive skill. A national climate assessment worthy of the name should only use models with demonstrated predictive skill. Such an assessment would project significantly less warming and smaller climate change impacts than the National Climate Assessment did.
The “Baseline” Is Actually a Worst-Case Scenario
Although the U.S. Global Change Research Program used all four RCPs to model potential climate change impacts, the NCA report “focuses on RCP8.5 as a ‘higher’ scenario, associated with more warming, and RCP4.5 as a ‘lower’ scenario with less warming” (p. 6). Predictably, the majority staff briefing memo fixates on warming levels and impacts associated with RCP8.5.
Although the National Climate Assessment does not call RCP8.5 a “baseline” emission scenario, readers are left with the overwhelming impression that RCP8.5 represents business-as-usual—the global emission levels that will result absent “significant global mitigation action.” However, as this blog post and several other commentators have pointed out, RCP8.5 is not a realistic emissions baseline. It projects higher emission levels in 2100 than about 90 percent of baseline scenarios in the literature. RCP8.5 belongs in the category of worst-case scenarios.
RCP8.5 derives from an older scenario, known as A2, developed for the Intergovernmental Panel on Climate Change’s 2007 Fourth Assessment Report (AR4). According to its authors, the A2 “story line” contains the following elements:
- Coal use increases almost 10-fold by 2100 and there is a continued reliance on oil in the transportation sector.
- Population increases continuously (does not peak) in the 21st century, resulting in a global population of 12 billion by 2100.
- Per capita income growth is slow and both internationally as well as regionally there is only little convergence between high and low income countries.
- Because economic development is slow, there is little progress in energy efficiency. Combined with the high population growth, that leads to rapid energy demand growth.
- Despite high energy demand, international trade in energy and technology is limited and overall rates of technological progress are modest.
- Reflecting the slow rate of technological change, the long-term reduction in the energy-intensity of production slows to from 1 percent to 0.5 percent annually.
Every assumption of RCP8.5 is dubious or implausible. Writing on Judith Curry’s blog, economist Kevin Murphy takes a deep dive into the authoritative study by Dutch scientist Detlef P. van Vuuren and colleagues, “Representative Concentration Pathways: An Overview.” According to Murphy:
Figures published in the paper identify where each RCP’s assumptions lie within the literature available at the time they were developed. Those taken for RCP8.5 lie at limits of 90th or 98th percentile bands (1% to 5% probability). The population projection is at the high limit of United Nations scenarios. Its primary energy consumption projection lies at the 99th percentile through most of this century. Energy intensity of the economy (energy/GDP) aligns with the 99th percentile from the literature. Improvement in RCP8.5’s carbon factor (CO2/energy) is minimal and at the 95th percentile, reflecting heavy reliance on fossil fuels.
Murphy next spotlights RCP8.5’s most unrealistic assumption:
Coal comprises nearly 50% of RCP8.5’s energy mix, something which has not been seen since early in the last century. RCP8.5 has consequently been called a “return to coal” scenario (Why do climate change scenarios return to coal?). This is inconsistent with natural long-term sequential evolutions of energy technologies that project a declining share of the energy mix for coal.
Indeed, the U.S. Energy Information Administration’s 2018 International Energy Outlook projects that global demand for all energy sources will increase through 2040—except for coal (p. 6). Similarly, the International Energy Agency’s New Policies Scenario, which “aims to provide a sense of where today’s policy ambitions seem likely to take the energy sector,” forecasts a dramatic departure from the coal- and oil-led growth of the past 25 years, “with the lead now taken by natural gas, by the rapid rise of renewables and by energy efficiency.”
Whereas RCP8.5 leads to an atmospheric carbon dioxide concentration of 936 parts per million (ppm) in 2100, Murphy sees concentrations rising to between 565 ppm and 658 ppm. In other words, the forcing effect of a realistic “no action” baseline lies between RCP4.5 and RCP6.0, which the IPCC and National Climate Assessment assume are unachievable absent new mitigation policies.
In any event, climate campaigners’ enthusiasm for a return-to-coal “baseline” clashes with their boasts that wind and solar power are already competitive with or cheaper than new fossil generation and even cheaper than existing coal generation. Do they really not know how silly RCP8.5 is? Or do they continue to misrepresent it as a baseline scenario in order to frighten the children?
Extreme Weather Blather
The majority staff briefing memo continues:
According to the assessment, Americans are already experiencing increased frequency and intensity of extreme weather, heat waves, wildfires, and flooding due to climate change.
America is a big country with 325 million people. Extreme weather is bound to affect some significant fraction of Americans every day of the year. Separating the effects of climate change from plain old climate is no mean feat. Heat waves, wildfires, flooding, and violent storms have afflicted mankind since time immemorial. As technology develops, scientists become more capable of detecting and measuring extreme weather.
Separating the effects of climate from those of development can also be difficult. When people move into or build in flood plains, hurricane zones, or wildfire areas, they are more likely to encounter extreme weather. High levels of population growth and development occur in such areas.
It is intuitively plausible that as the world warms, heat waves will become more common. However, careful analysis of data is still required to confirm the hypothesis. All weather is local, and in Alabama, for example, daily maximum temperatures have actually declined slightly since the 1880s.

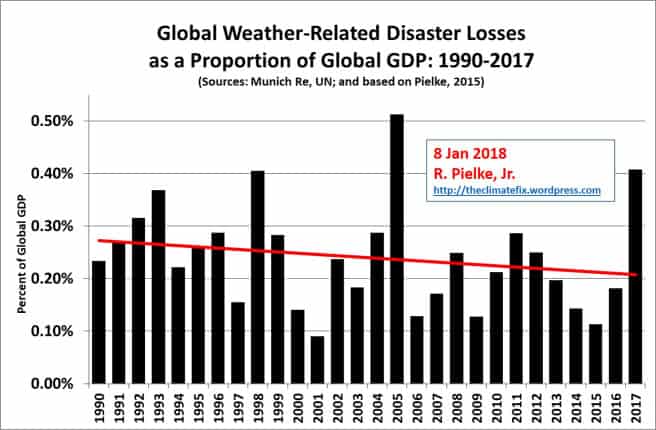
In any case, as University of Colorado professor Roger Pielke, Jr. documents in the updated (2018) edition of The Rightful Place of Science: Disasters & Climate Change, there is no solid evidence that greenhouse gas emissions are making natural disasters more costly. In fact, the relative impact of extreme weather on global GDP has declined significantly during the past several decades.
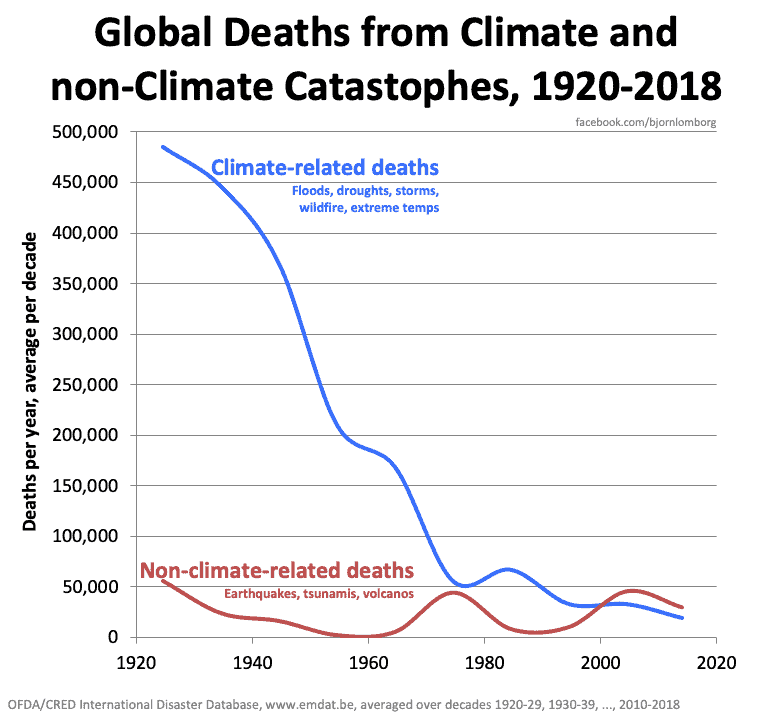
More importantly, global deaths and death rates related to extreme weather have hugely declined over the past century, thanks to the ever-increasing wealth and technological prowess of our largely fossil-fueled civilization.
Economic Impacts of Climate Change
It’s tough to make predictions, especially about the future (as Yogi Berra said). Nonetheless, I boldly predict that at least one majority witness or committee member will claim that the “costs of inaction” are so high we cannot afford not to act.
In this vein, they may rattle off the National Climate Assessment’s estimates of the cost of inaction. As summarized in the majority staff briefing memo, “By 2090, lost wages will reach $155 billion, mortality from extreme temperatures will surpass $140 billion, and coastal property damage will approach $120 billion. All told, the U.S. economy could lose more than ten percent of its GDP under the worst-case scenario.”
This is all exceedingly dubious. The jobs of the 2090s should be at least as different from today’s jobs as those are from the jobs of the 1950s. Partly because the world is getting warmer and hot weather is more frequent, U.S. heat-related mortality has declined decade-by-decade since the 1960s. In fact, millions of Americans vote with their feet every year to live in the warmest parts of the country. Many do this to enhance their health and welfare. Coastal property damage goes with the territory. The $120 billion damage estimate assumes the high-end warming and sea-level rise projections ginned up by applying CMIP5 to RCP8.5, so it has little credibility.
What about the claim that the U.S. economy could lose more than 10 percent of GDP under an RCP8.5 scenario? It doesn’t add up, as Reason science correspondent Ronald Bailey discovered. A chart in the National Climate Assessment totes up all the U.S. climate damages projected under RCP8.5.
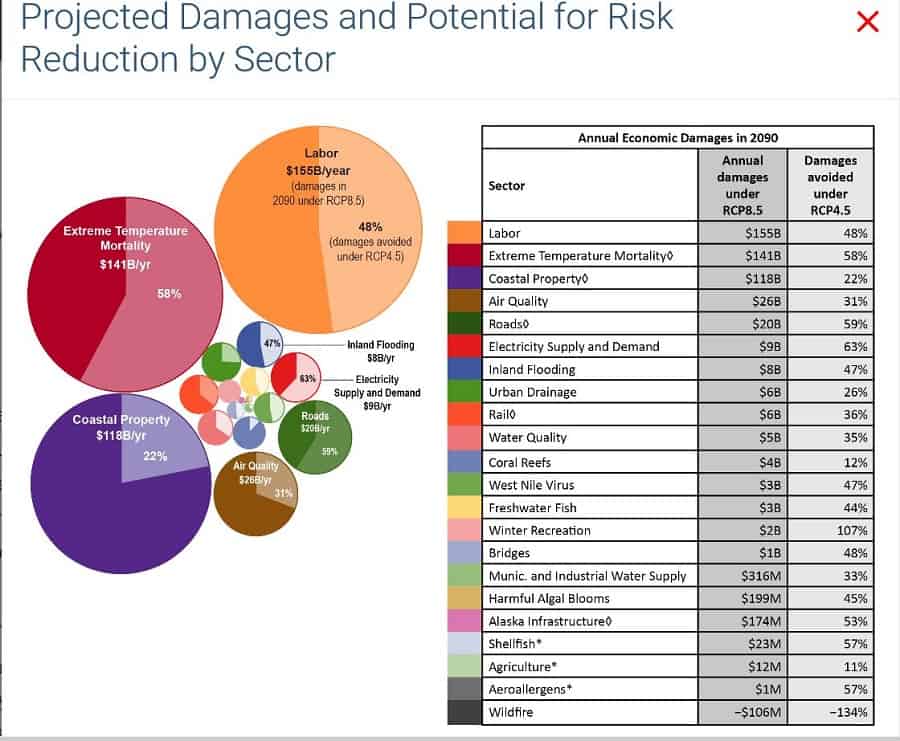
The total annual damage attributed to climate change comes to a bit over $500 billion. But, notes Bailey, “Today’s $20 trillion GDP, growing at a 3 percent rate, would rise to $226 trillion by 2100.” A $500 billion hit on an economy of that size would reduce GDP by only 0.2 percent, not 10 percent.
Even if climate change did reduce the GDP by 10 percent, the economy would grow to $203 trillion. “Americans living at the end of this century would be about 10 times richer on average than we are now, albeit in a much warmer world,” Bailey comments.
However, the question remains: how did the National Climate Assessment calculates a 10 percent loss in GDP when its own aggregate sector-by-sector damage estimate is 45 times smaller?
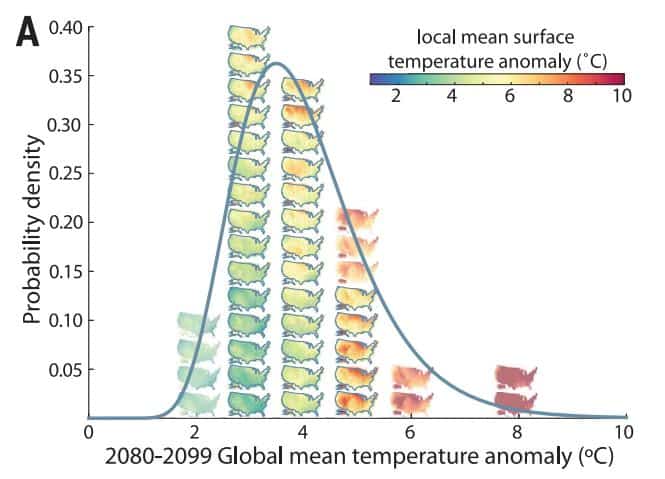
The source of the estimate is a study by Berkeley researcher Solomon Hsiang and colleagues published in Science in 2017. The researchers assume that an RCP8.5 forcing trajectory could push average global temperatures 8°C (14°F) higher relative to 1980-2010 levels. Bailey calls that “an absurdly farfetched increase in average temperature.”
All the study proves is that if modelers run an inflated emission scenario with overheated models, some model “realizations” will be at the far end of the distribution. But even under RCP8.5, and even using models that already overshoot observed warming, the probability of an additional 8°C warming by the end of the 21st century is only 1 percent.
Conclusion
Today’s hearing will likely be an echo chamber for climate alarm and energy rationing, with progressive committee members and witnesses excoriating President Trump for not heeding the advice of his “own agencies,” i.e., those that produced the National Climate Assessment.
If committee conservatives have their wits about them, they might actually have some fun. They could take turns challenging the premises of the National Climate Assessment—assumptions the majority probably accept on authority or have never even thought about.
The goal would be to popularize the big takeaway from Patrick Michaels’s comment letter on the National Climate Assessment. To wit: the next assessment should use a realistic emission baseline and the only climate model that actually works.
The punchline? “If one assumes, as the International Energy Agency does, that natural gas is going to continue to replace large amounts of coal energy, 21st century warming predicted by INM-CM4 is approximately 1.5⁰C, a value so low that the social costs of carbon become the social benefits of lukewarming.”