Hyping the Whirlwind
Photo Credit: Getty
A new Nature paper on hurricane decay rates that was published on November 11 by Lin Li and Pinaki Chakroborty (hereafter, LC20) is receiving a ton of press coverage.
It is also horrendously flawed. According to Roger Pielke Jr. of the University of Colorado, it suffers from an “absolutely massive error.” Make that plural.
LC20 found—horrors—that the decay rates of landfalling hurricanes are decreasing, resulting in increased damages. Pielke Jr. has repeatedly demonstrated, using both insurance company and U.N. data, that there isn’t any increase, after adjusting for coastal population and property value increases.
LC20 looks at hurricane strikes (they actually include mere tropical storms, too) when the center crosses a U.S. coastline, and then the subsequent time it takes to weaken. Unlike yours truly, the Pielkes (Jr. and Sr.), and the concatenated worldwide network of hurricane geeks, the authors don’t seem to know the individual storms very well at all. Further, they don’t discount storms that go back out to sea.
This is a very common behavior for storms that strike the most hurricane-prone place on the Atlantic Coast, which is the North Carolina Outer Banks including Cape Hatteras. A large number of storms are travelling northeast when they hit there (or nearby) and soon—usually between six and 24 hours later, they are back out to sea and soaking up heat from the often-torrid Gulf Stream. They either maintain strength or actually increase. Unbelievably, the authors treat this process as hurricane decay.
Let’s start with their raw data, plotted up by Pielke Jr.
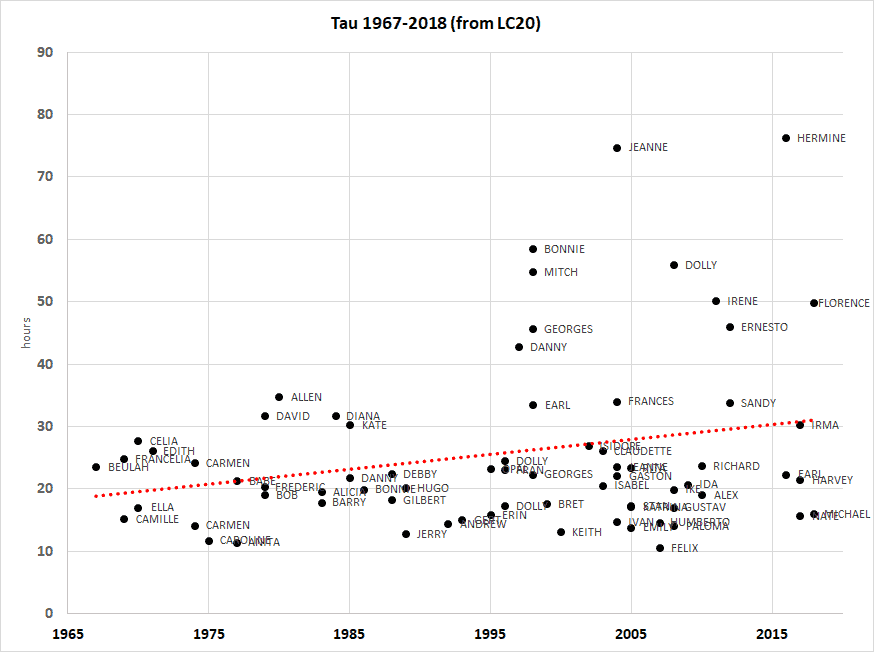
Figure 1. Number of hours until ultimate storm decay from LC20. Below, we’ll look at some of their analytical faux-pas that resulted in an apparently increasing trend. Then we’ll re-plot the data. Guess what happens. Courtesy Roger Pielke Jr.
To see the “absolutely massive error,” have a look at 1998 Hurricane Bonnie. Figure 1 shows nearly 60 hours to decay once it hit land. But it didn’t stay over land for long, and within 24 hours it was back out at sea. Further, it was never very far inland (and it was a physically large hurricane), so much of its circulation was over the ocean with hurricane-feeding temperatures.
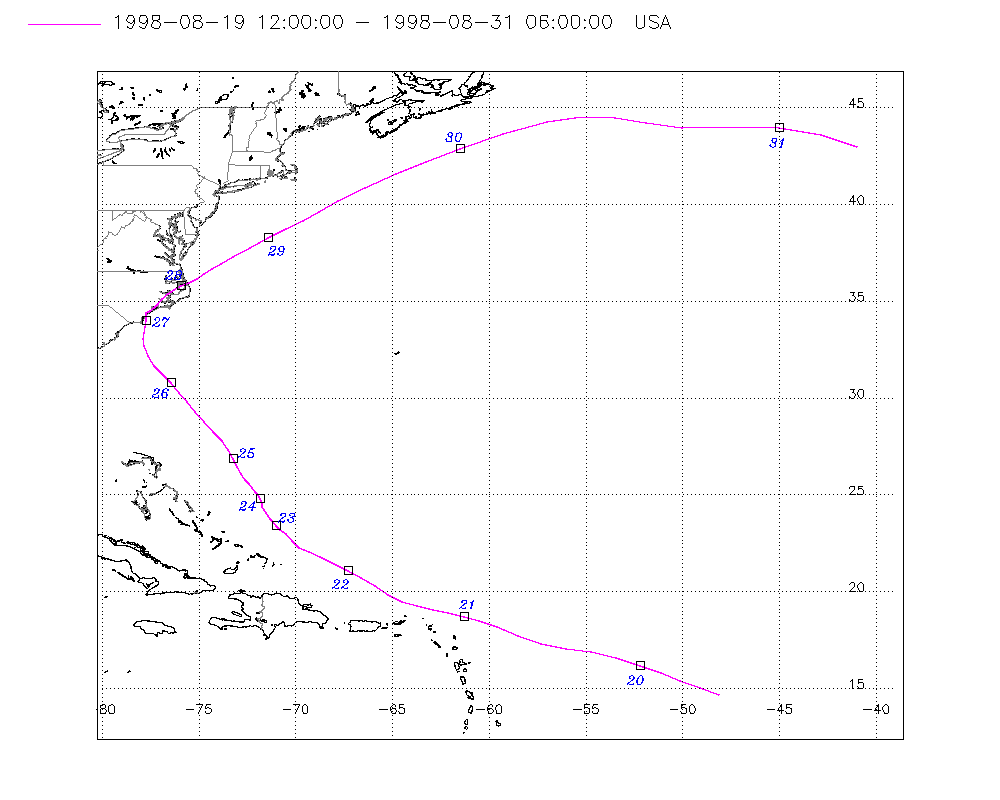
Figure 2. Hurricane Bonnie track, 1998. It spent only 24 hours over land, while very close to the coast, and then it reemerged over the ocean and the toasty Gulf Stream. LC20 count this as “decay.”
While LC20 says Bonnie took nearly 60 hours to decay (see Figure 1), it wasn’t going to decay much over warm water.
Decay figures for 2012 Hurricane Ernesto are inflated. It hit the Yucatan Peninsula, then reemerged over the extreme southern Bay of Campeche around 24 hours later before striking Mexico again. But the decay clock started with the first landfall and kept running until it dissipated.
Figure one also includes the memorable 2012 Hurricane Sandy, which struck the New York-New Jersey Bight on Halloween. Except it wasn’t a hurricane. It was a big old, mean and very strong common cyclone that was a hurricane. Hurricanes don’t produce snow, but Sandy buried West Virginia and spread some of the white stuff up through Jersey and southern New England. Trick or Treat.
2011 Hurricane Irene hit around Cape Lookout, North Carolina, around 8 am on Saturday August 10, 2011. LC20 gives the landfall as much further northeast around New York City. That was at 9 am on Sunday, and by 11 pm, a mere 14 hours later, the National Hurricane Center’s last advisory on the storm said “Satellite imagery … radar data … and surface observations indicate that Irene has lost tropical characteristics.” But, as shown in Figure 1, LC20 clocked Irene at a 50-hour decay time. They must have actually started the decay clock when it hit North Carolina. Like hurricane Hermine (below), much of Irene’s circulation was over warm water as it made its way up the coast. An individual storm track is a weather event, not evidence of climate change.
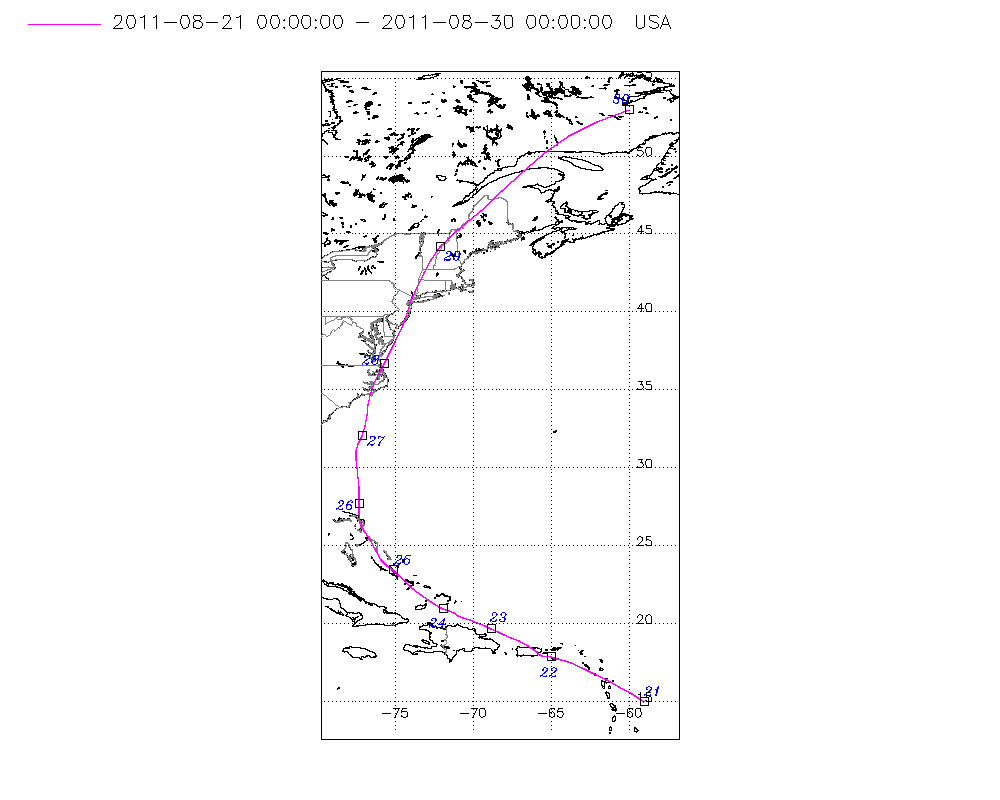
Figure 3. Hurricane Irene (2011) made landfall around Cape Lookout NC (Latitude 35⁰N) but LC20 say it was at 41⁰, New York City, by which time it was a tropical storm that lost tropical characteristics in 14 hours, according to the National Hurricane Center. LC20 gave it 50 hours.
Technical Sidebar: Cyclones, tropical and otherwise
Away from the Arctic Ocean, there are two types of cyclones (organized low-pressure systems). Tropical cyclones are generally symmetrical with a central core that is warmer than the surrounding atmosphere. The warmer they are, the stronger they become. In fact, they’re sometimes referred to as “warm core” cyclones. They tend to form where there is a lot of warm ocean available to evaporate moisture that is carried aloft and generates massive areas of dense and thick clouds. The condensation of moisture in this process releases heat into the environment which, among other things, contributes to the warm core. They’re actually pretty simple storms.
All other cyclones are referred to as extratropical. Yeah, you can quibble about the nomenclature, because it seems to imply that they are all out of the tropics, which isn’t true. At any rate, the hallmark of extratropical storms is that the core is cold and driven by processes aloft rather than the evaporation of surface moisture. So, when the National Hurricane Center announces that a tropical system has gone extratropical, the central core has shifted from warm to cold.
The vast majority of the world’s cyclones are extratropical disturbances that are form along some horizontal surface temperature discontinuity, or “front.”
The top two storms in decay time are also highly suspicious. The champion is 2016 Hurricane Hermine, at about 77 hours. It came ashore in north Florida around 2 am on Friday, September 2, and by 5 pm on Saturday it emerged back over the ocean, about 39 hours later. But between 12 and 18 hours after its Florida landfall, Hermine was hugging the coast (see Figure 4), so much of its circulation was drawing in coastal and Gulf Stream energy. Its persistence has little to do with climate change and a lot to do with its track, which again would be “weather.” When it exited land for good, the National Hurricane Center said “Hermine has the look of an extratropical cyclone.” As can be seen in Figure 4, Hermine was out to sea for days afterward, but not as a tropical system (see the sidebar above for a bit more explanation).

Figure 4. Most of the “decay” time for 2016 hurricane Hermine was when it was an extratropical cyclone that was over the ocean.
The runner-up for decay time is 2004 Hurricane Jeanne, at 75 hours. But, as can be seen in Figure 5, about 30h of those were because the storm brushed the north coast of Hispaniola. It subsequently spent seven days meandering over very warm water before making final landfall in southern Florida around 1 am on Sunday, September 26. The actual decay time once it hit the U.S. would therefore be around 45 hours—still a relatively high number but not spectacularly so.
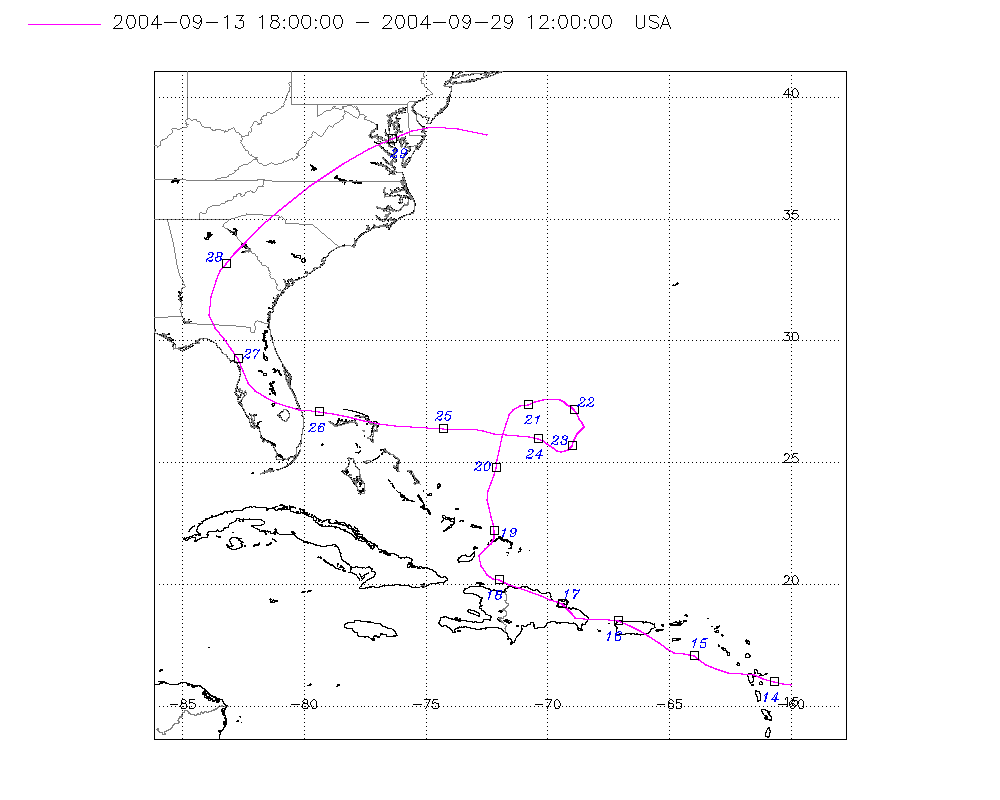
Figure 5. Hurricane Jeanne (2004) hit land twice. The first strike, along the extreme north coast of Hispaniola was so close to the coast that it remained intact during the approximately 30-hour passage. It landed in southern Florida about a week later and remained a tropical structure until it exited into the Atlantic off the Maryland eastern shore.
Much of the decay data is both subjective and suspicious. LC20 correctly states that 1969 hurricane Camille was considered spent a mere 14 hours after making landfall as the second category 5 strike on the U.S. in the 20th century. But 48 hours later, Camille unleashed (at the time) the most intense rainstorm in modern memory, putting down an official 27 inches of rain over the central Virginia foothills in a mere six hours (thereis an unofficial report of 31 inches, also). That is hardly what would be expected of a decayed system. That would put Camille’s datapoint up to around 50 hours, really changing the impression of the early LC20 data.
Hereis the result if we leave Camille as is, but knock out all storms that made land and then reemerged over a favorable ocean (and dump the extratropical Sandy).
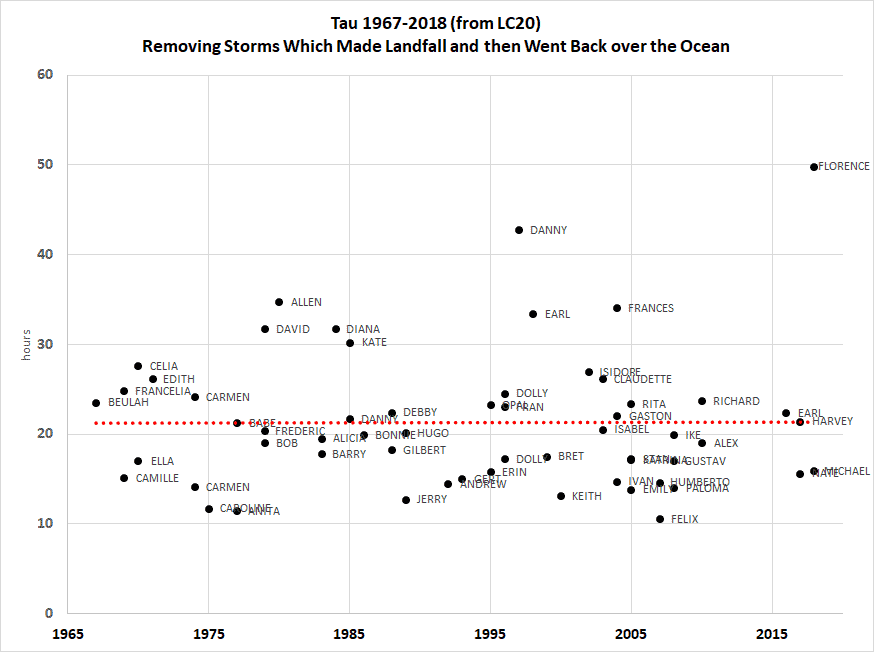
Figure 6. Here is the result if the storms that reemerged over a favorable ocean are removed. No trend remains in the subsequent LC20 data. Note the 1969 hurricane Camille remains as is even though it is obvious that it was intact enough to produce the most intense six-hour rain recorded in the U.S. Courtesy Roger Pielke, Jr.
In summary, a couple of items stand out concerning LC20. The most glaring problem is that the methodology produces inflated results when a storm touches land and then reemerges into a favorable marine environment. Hurricanes that hit near Cape Hatteras are especially prone to having overestimated decay times. We have detailed some of the problem storms here, and we can confidently state that different reviewers of this paper (perhaps Yr. Obt. Svt. or either Pielke) would have probably required major changes prior to publication, or perhaps it would have never seen the light of day because of major methodological problems.