Less is More – EPA’s Methane Rule and the Social Cost Paradox

Photo Credit: Getty
CEI this week submitted comments on the Environmental Protection Agency’s (EPA’s) proposed rule to establish new and more stringent methane emission standards for the oil and gas sector. The comments, co-authored by Heritage Foundation chief statistician Kevin Dayaratna and your humble servant, advise the EPA to withdraw the proposal for two reasons. First, the rulemaking will impose huge compliance costs in the pursuit of illusory climate benefits. Second, the EPA’s estimated climate benefits derive from “social cost” metrics that are too speculative, and too prone to political manipulation, to inform regulatory decisions.
Illusory Benefits
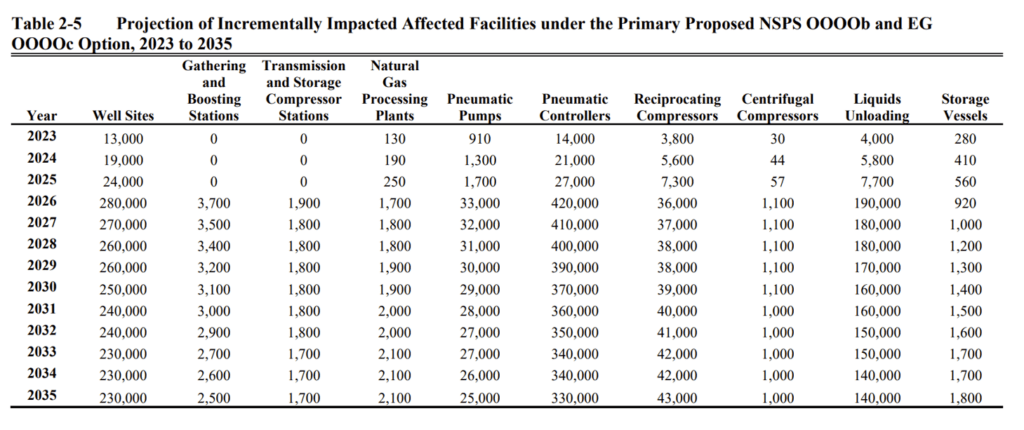
The proposed rule would dramatically expand monitoring, performance testing, reporting, enforcement, and compliance expenditures across the sector-wide “supply chain” comprising natural gas exploration, production, storage, processing and transmission. In 2026, a staggering 968,320 links in this critical supply chain would be subject to new or more stringent regulatory requirements.
The EPA estimates the rule will generate $55 billion in climate benefits, $13 billion in compliance costs, $7.2 billion in net compliance costs (i.e. $13 billion minus $5.5 billion in recovered product sales), and net benefits of $48 billion—a fabulous benefit-cost ratio of 7.6 to 1. That is not credible.
All the proposal’s climate benefits are attributed to a projected 920 million metric ton (MMT) reduction in carbon dioxide-equivalent (CO2e) methane (CH4) emissions during 2023-2035. How much global warming would that avert? The EPA does not say. Why not? Perhaps because the optics are not flattering.
Federal agencies (and many researchers) use a model called MAGICC to estimate the temperature effects of emission scenarios under different equilibrium climate sensitivity assumptions. Equilibrium climate sensitivity (ECS) is a term used to describe how much warming results after the climate system fully adjusts to a doubling of CO2e greenhouse gas (GHG) concentrations.
MAGICC projects the following temperature effects from a 920 MMT reduction in CO2e methane emissions:
- 4.5°C sensitivity, 0.005°C reduction by 2050, 0.014°C reduction by 2100
- 3.0°C sensitivity, 0.004°C reduction by 2050, 0.011°C by 2100
- 2.0°C sensitivity, 0.003°C reduction by 2050, 0.008°C by 2100
Such effects are too small for scientists to detect. The associated social impacts (if any) would also be too small for anyone to experience. Effects that can be neither detected nor experienced are “benefits” in name only. Illusory benefits should not be weighed in the same scales with compliance costs that verifiably impose measurable burdens on identifiable people and businesses.
The EPA claims its monetized benefits estimate is solely for the purpose of complying with Executive Order 12866 regulatory accounting procedures and did not inform the determination of emission standards (87 FR 74843). Respectfully, the issue is not so cut-and-dried. E.O. 12866 itself serves a more basic rule of reason. Imposing billions of dollars in compliance costs for trivial environmental benefits is not reasonable. A regulation that does more harm than good incurs legal risk (Michigan v. EPA, 2015, Slip. Op. p. 7).
Morphing Small Effects into Big “Benefits”
The EPA’s climate benefits projection is based on a metric called the social cost of methane (SC-CH4), an estimate of the cumulative climate-related damages caused by one ton of methane emissions released in a given year. By implication, the SC-CH4 is also an estimate of the benefit of reducing one ton of methane emissions in that year.
The proposed rule’s SC-CH4 estimates are those developed by the federal government’s Interagency Working Group on the Social Cost of Greenhouse Gases (IWG). The IWG published those estimates, along with its estimates of the social cost of carbon dioxide (SC-CO2) and nitrous oxide (SC-N2O), in its February 2021 Technical Support Document (TSD).
According to the TSD, one ton of methane emitted in 2020 causes $1,500 in cumulative climate damages (assuming a 3% discount rate). The SC-CH4 increases over time as atmospheric GHG concentration and global warming increase. For example, the SC-CH4 is $2,000 in 2030 and $3,100 in 2050. Basically, the EPA got $55 billion in climate benefits by multiplying the SC-CH4 by the millions of tons of methane emissions the proposal is projected to reduce during 2023-2035.
The IWG uses three “integrated assessment models” (IAMs), abbreviated DICE, FUND, and PAGE, to estimate the climate effects of CO2, CH4, and N2O emissions and the associated economic impacts.
It all looks very scientific. In fact, estimating the social cost of greenhouse gases (SC-GHG) is a highly speculative, assumption-driven exercise. Running IAMs with reasonable alternative inputs regarding climate sensitivity, discount rates, analysis period length, CO2 agricultural benefits, human adaptive capabilities, and baseline emissions projections can change the magnitude of the estimates and even their sign.
For example, when the FUND model is updated with empirical information regarding climate sensitivity and carbon dioxide agricultural benefits, the SC-CO2 drops to very low numbers with substantial probabilities of being negative through 2050. A negative SC-CO2 is another way of saying a net benefit. Note, the updated FUND model projects low and even negative SC-CO2 values even when FUND is run with the IWG’s lowest discount rate (2.5%).
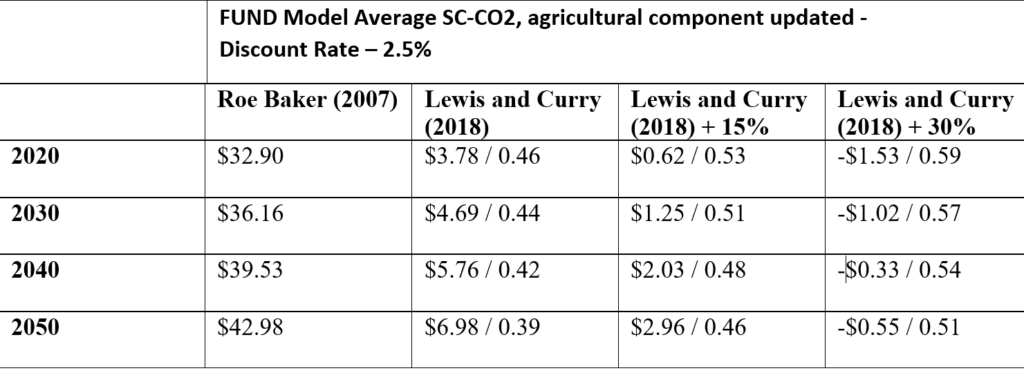
Figure Source: Dayaratna et al. (2020). FUND model’s CO2-fertilization coefficients updated to increase agricultural benefits by 15 percent and 30 percent and run with the updated equilibrium estimate sensitivity (ECS) distribution of Lewis and Curry (2018).
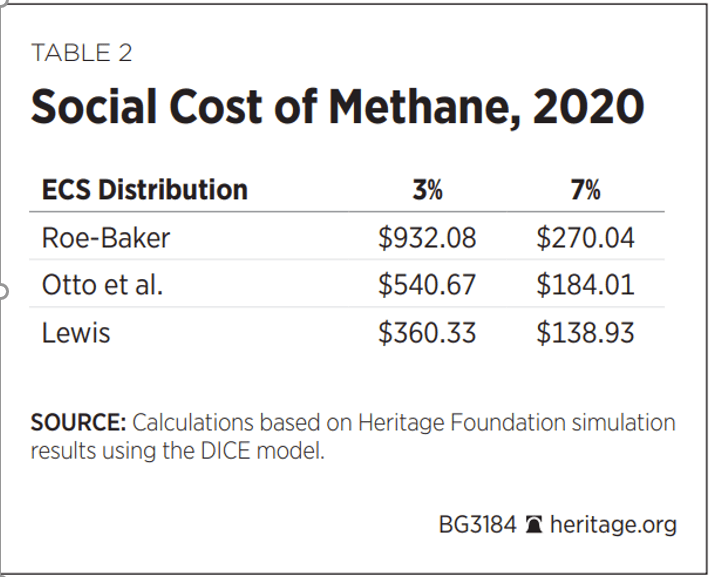
Reasonable alternative inputs also decrease SC-CH4 estimates. The IWG runs the IAMs with the ECS probability distribution calculated by Roe and Baker (2007), and uses a 3% discount rate for its central estimates. In a 2017 Heritage Foundation study, Dr. Dayaratna found that when the DICE model is run with the empirically-based ECS distribution of Lewis (2013) and a 7% discount rate, the SC-CH4 for 2020 drops from $932.08 to $138.93—a reduction of 85 percent.
Biases Galore
As a general observation, SC-GHG estimates are too speculative, and too easily manipulated for political ends, to inform regulatory decisions. The IWG exercise is a prime example, as all its core methodological choices work to inflate SC-GHG values.
Such choices include:
- Run the IAMs with below-market discount rates (the lower the discount rate, the higher the present value of future climate damages and emission reductions, and vice versa).
- Use climate sensitivity estimates derived from models that persistently overshoot observed warming.
- Project cumulative damages over a 300-year period—well beyond the limits of informed speculation.
- Minimize the agricultural benefits of atmospheric CO2 fertilization by averaging the results of three IAMs, two of which (DICE and PAGE) do not estimate such effects.
- Include an IAM (PAGE) that unrealistically assumes adaptation cannot mitigate the cost of climate change impacts once 21st century warming and sea-level rise exceed 1°C and 10 inches, respectively.
- Ignore the dramatic ongoing declines in climate-related mortality and climate-related losses per exposed GDP.
- Run the IAMs with implausible baselines that assume the world repeatedly burns through all fossil fuel reserves.
Social Cost Paradox
The last bullet point raises interesting questions. Since the first TSD published in 2010, the IWG has run the IAMs with five emissions scenarios that on average project 17,195 GtCO2 during 2000-2300. A chart from the Electric Power Research Institute’s 2014 review of the 2010 and 2013 TSDs reveals that the IWG’s mean CO2 emissions baseline exceeded estimated fossil fuel reserves by 2.4 to 4.6 times. That wildly implausible projection still underpins the IWG’s SC-CO2 estimates.
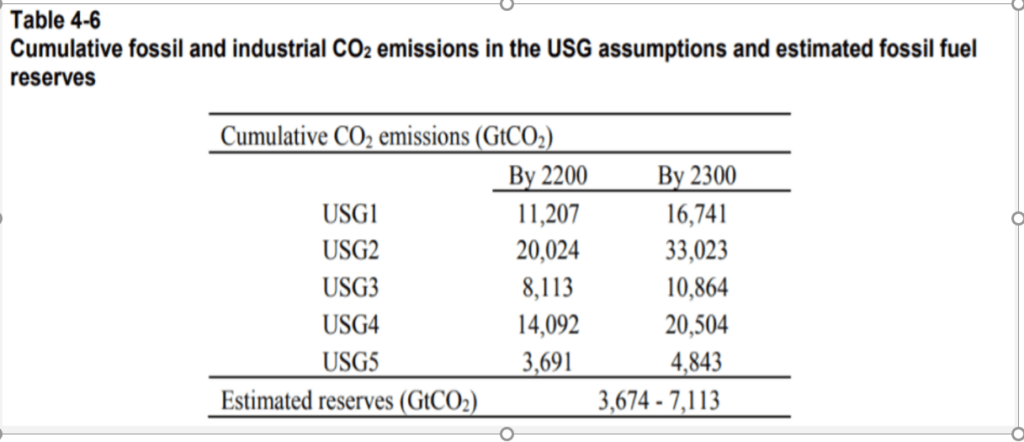
Figure Source: EPRI (2014). 17,195 GtCO2 is the average tonnage projection of the five USG baseline scenarios.
In October 2021, a team of researchers led by Kevin Rennert of Resources for the Future (RFF) published a report on advances in methods for calculating the social cost of carbon. The EPA’s September 2022 Draft Report on the Social Cost of Greenhouse Gases praises the RFF’s work, stating that RFF’s socioeconomic and emissions projections “stand out as being most consistent with the National Academies’ recommendations.”
I emailed Dr. Rennert and asked if he could compare the CO2 emission tonnages in the IWG and RFF baseline projections. He kindly produced and sent me (a complete stranger) the following chart:
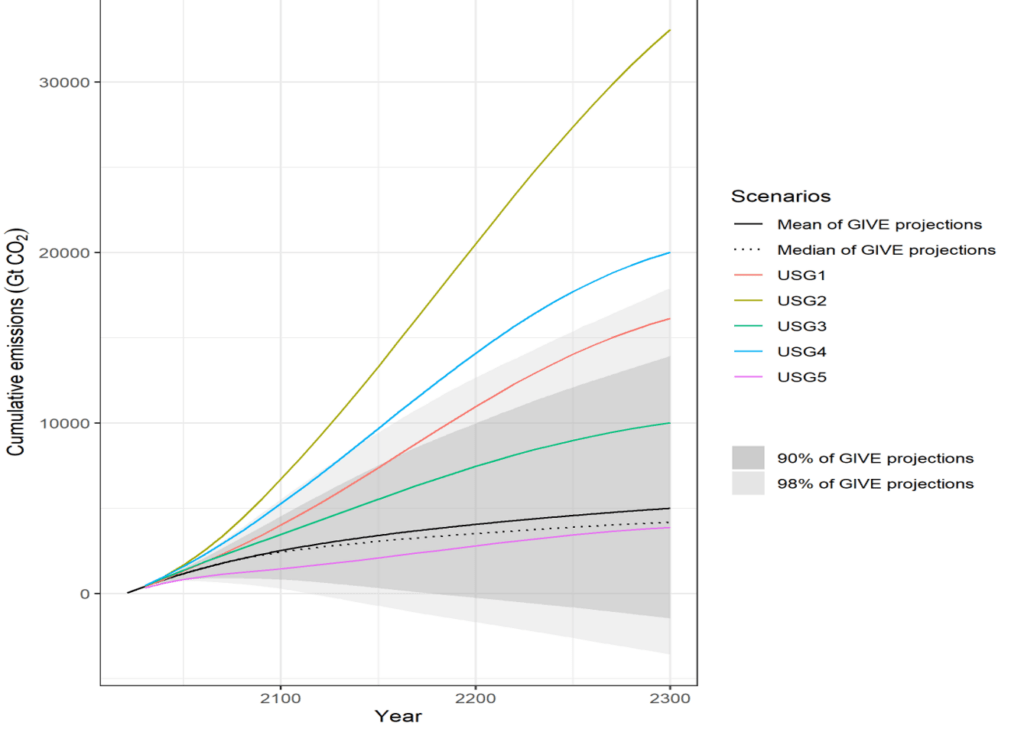
Figure Source: Kevin Rennert, December 2, 2022.
What the figure shows is that the RFF’s updated, more accurate mean baseline projection is 5,000 GtCO2—less than one third of the IWG’s mean projection.
Perhaps you are wondering what CO2 emission baselines have to do with SC-CH4 estimates. CO2 emissions are the main contributor to the overall anthropogenic greenhouse effect and, thus, to the warming projections used by IAMs to estimate climate-related damages from any greenhouse gas, whether CO2, CH4, or N2O. Inflated CO2 emission baselines inflate SC-CH4 values and, thus, any associated regulatory benefits calculation.
Dr. Dayaratna and I wondered whether the RFF’s mean baseline projections for CH4 and N2O were also lower than the corresponding IWG baselines. In this case, quantification eluded us. The 2010 TSD has a chart showing the “non-CO2 forcing” (warming pressure) projected in the five scenarios. However, the chart provides no information on the relative contributions of the component gases—CH4, N2O, and fluorinated gases. Moreover, the IWG never reported the emission tonnages implied in those non-CO2 forcing projections.
Nonetheless, a comparison between the IWG’s non-CO2 forcing baselines and RFF’s CH4 and N2O baselines suggests that the IWG baselines are too high, further inflating the climate benefits calculation in the EPA’s proposed rule.
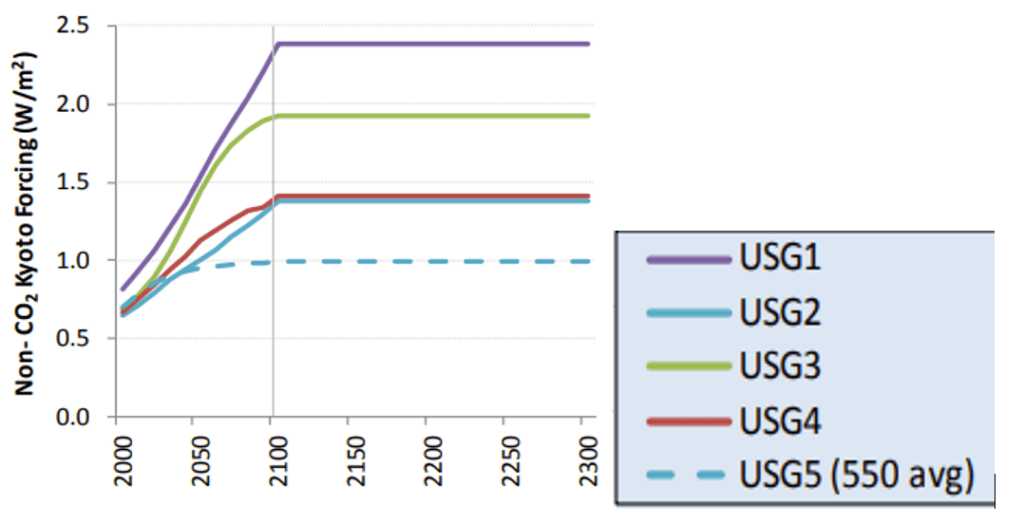
Figure Source: EPRI (2014), p. 4-6.
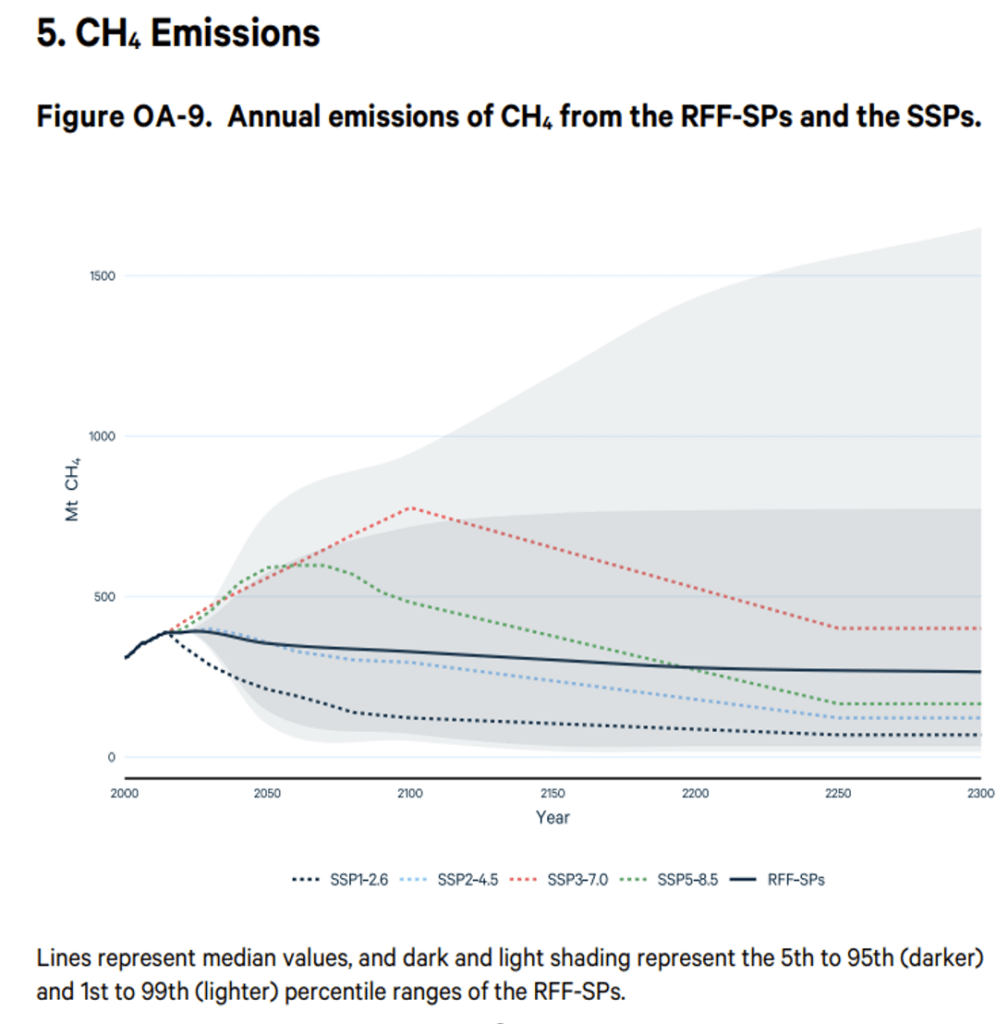
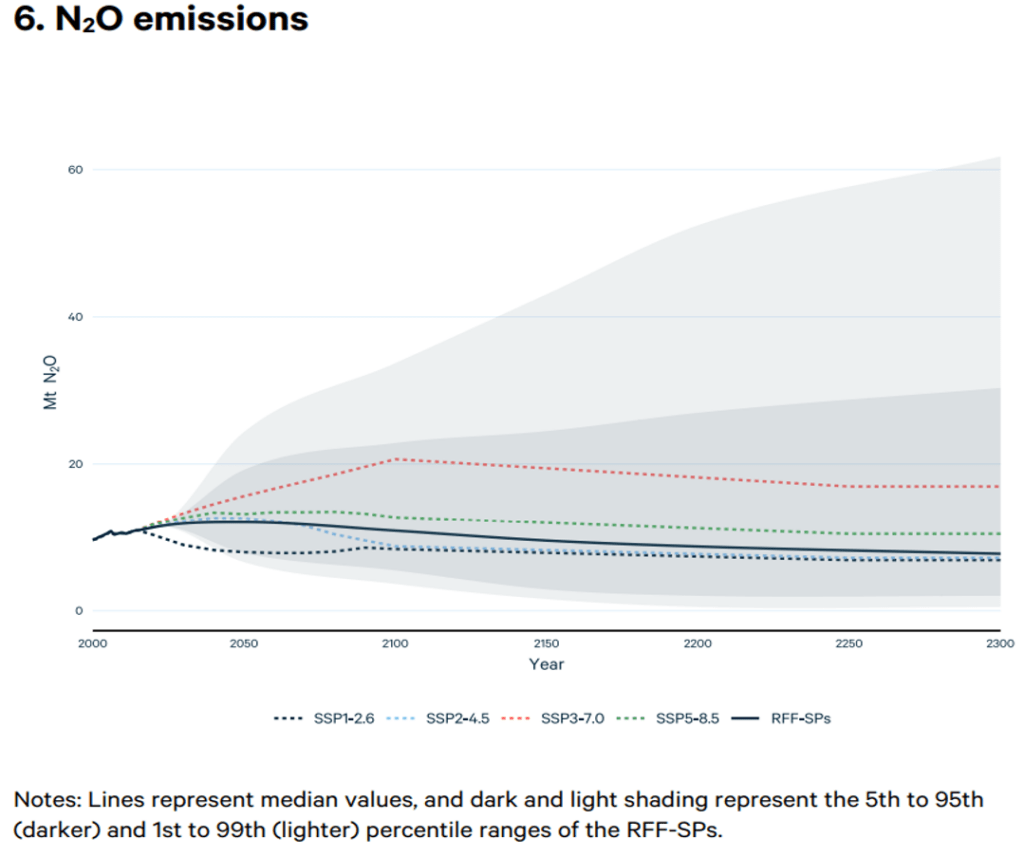
Figure Source: Rennert et al. (2021)
All five IWG scenarios show significant increases in non-CO2 forcing during 2000-2100, after which forcing remains constant through 2300. In the RFF baselines, CH4 and N2O emissions decline after 2050, return almost to 2000 levels in 2100, and decline gradually after 2100.
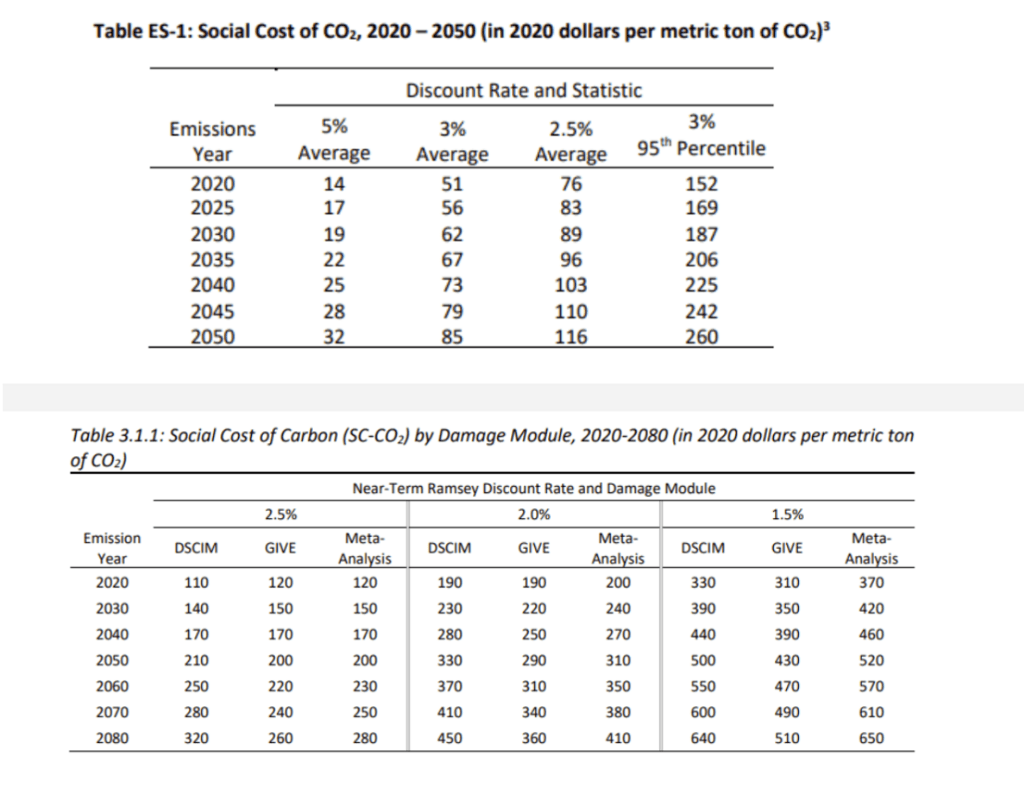
Although the RFF CO2 baseline projection is less than one-third the size of the IWG projection, and the EPA uses the RFF baseline in its September 2022 Draft Report, SC-CO2 values in the Draft Report are more than three times larger than those in the 2021 TSD. For example, the Draft Report’s central SC-CO2 estimate is $290-$330 per ton in 2050 compared to $85 per ton in the 2021 TSD.
Similarly, the Draft Report’s central estimate of the SC-CH4 for 2050 is $4,200—35% higher than the 2021 TSD’s estimate of $3,100. Yet, as shown above, the RFF methane emissions baseline appears to be significantly lower than the IWG baseline.
The EPA’s Draft Report gives a whole new meaning to the phrase “less is more.” As projected emissions go down, projected climate damages go up.
Whatever else might be said about this paradox, the Draft Report is consistent with the political imperative to find that climate change is “worse than we thought.” Indeed, SC-GHG estimation is the perfect handmaid of that imperative. As MIT Professor Robert Pindyck observed years ago, IAM developers have so much freedom to choose the inputs and assumptions that “these models can be used to obtain almost any result one desires.”