Skepticism about EPA’s PM2.5 Rule Is Healthy
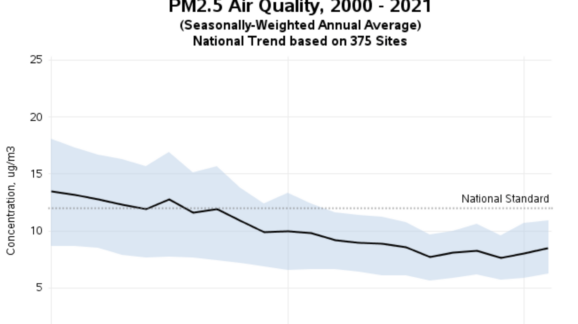
Photo Credit: Getty
The Environmental Protection Agency (EPA) recently proposed to tighten the annual national ambient air quality standard for fine particulate matter. My colleague Daren Bakst and I submitted comments on behalf of CEI. We challenge the proposal as arbitrary and capricious. Daren’s blog post of April 5 calls out the EPA’s rush to scrap the current NAAQS only 13 months into the five-year period such standards normally remain in effect. He also deplores the EPA’s purge of its Clean Air Scientific Advisory Committee (CASAC) to ensure agreement with the agency’s agenda. The present post discusses the weakness of the EPA’s core scientific premise that fine particle pollution kills tens of thousands of Americans every year.
Quick Background
The Clean Air Act requires the EPA to set both primary (health-focused) and secondary (welfare-focused) national ambient air quality standards (NAAQS) for air pollutants emitted by numerous or diverse mobile or stationary sources. The primary NAAQS are typically more stringent, as they must be set at a level “requisite to protect public health” with an “adequate margin of safety.” The Act also requires the EPA to review the NAAQS at five-year intervals.
When describing particulate matter (PM), subscripts are used to denote particle size. Thus, fine particulate matter, or PM2.5, includes airborne particles with diameters of 2.5 micrometers (µm) or less, while coarse particulate matter, or PM10, includes particles with diameters of 10 µm or less.
The EPA sets both annual (long-term exposure) and 24-hour (short-term exposure) primary NAAQS for particulate matter, calibrated in micrograms per cubic meter (µg/m3). The current annual and 24-hour standards for PM2.5 are 12 µg/m3 and 35 µg/m3, respectively. The EPA is proposing to decrease (tighten) the annual standard from 12 µg/m3 to 9 or 10 µg/m3 while taking comment on alternative annual standards down to 8 µg/m3 and up to 11 µg/m3.
Scientific Issues
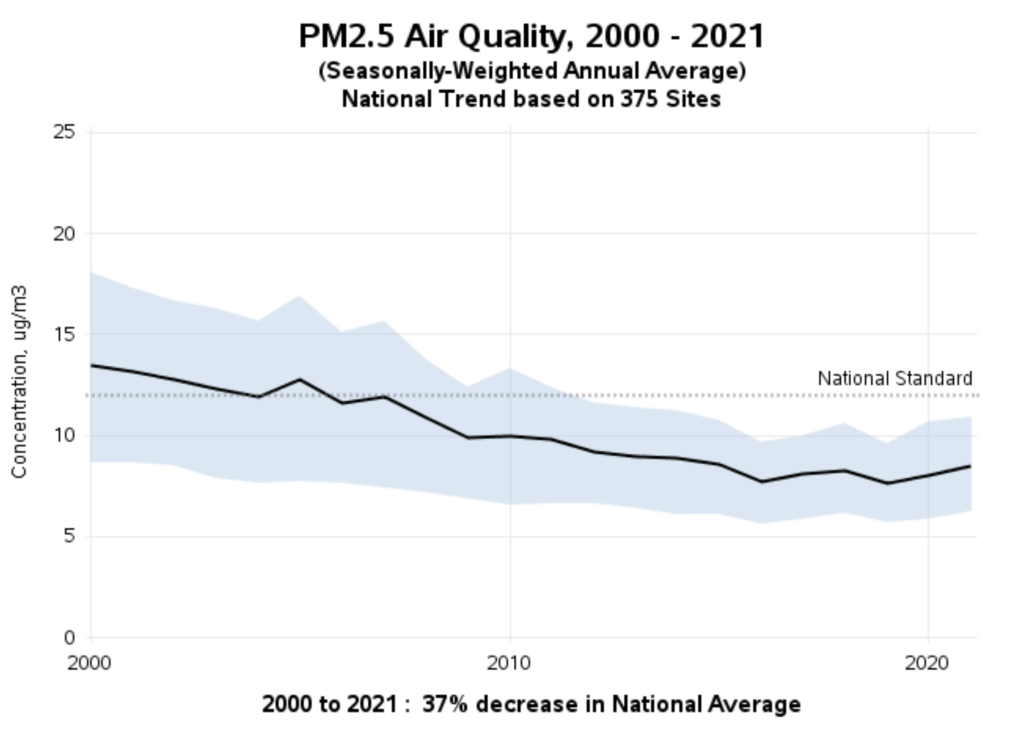
The EPA’s rush to regulate lacks a coherent scientific rationale. According to the agency’s data, between 2000-2021, the national average concentration levels for PM2.5 declined by 37 percent. National average concentration levels have been about 8.0 µg/m³ since 2016—well below the current NAAQS. The long-term trend is downward and is expected to continue declining under current policy.
The EPA’s proposal reviews two main types of PM2.5 health effects studies: experimental and epidemiological. The agency acknowledges that experimental studies using laboratory animals and human volunteers do not provide evidence of significant mortality risks from PM2.5 exposures at today’s historically-low levels. That is because the dosages in experimental studies (120 to 149 µg/m³ in human clinical trials and 400 to 1000 µg/m³ in lab animal tests) are much higher than ambient levels even on peak exposure days.
In this context, it is not impertinent to mention that no coroner’s report has ever listed PM2.5 exposure as the cause of death. All PM2.5 mortality “data” is inferred from epidemiological studies, which look for correlations between exposures and effects that may or may not have a causal basis.
Such associations are more likely to reflect causality when exposure to an uncommon pathogen correlates with high rates of a rare malady. Therein lies the problem. PM2.5 is ubiquitous, meaning almost everyone is exposed to it almost all the time. Moreover, researchers look for associations between PM2.5 exposures and total (“all cause”) mortality—a condition that eventually befalls everyone—or between exposures and common causes of death, such as cardiovascular disease. Consequently, correlations between PM2.5 exposure and death are generally weak.
Moreover, the correlation may be due to other factors (known as “confounders”) overlooked or not adequately considered by the researchers.
For example, in early April 2020, four researchers at the EPA-supported T.H. Chan School of Public Health published a study purporting to link long-term PM2.5 exposures to COVID-19 deaths. The authors did not wait for peer-review before releasing the study, which made a media splash. The study estimated that each 1 µg/m3 increase in long-term PM2.5 exposures accounts for 15 percent (later revised to 8 percent) of all U.S. COVID-19 deaths. That’s huge!
The researchers claimed they had controlled for all relevant confounders. However, they ignored one of the most obvious: transit ridership. Daily commuting in crowded trains and buses increases one’s exposure to airborne viruses. Two studies published by the National Bureau of Economic Research in June 2020 (here and here) found that COVID mortality is more strongly associated with public transit use than with PM2.5.
The EPA’s proposal spotlights a handful of recent epidemiological studies finding associations between PM2.5 and mortality at exposures below the current NAAQS. However, neither the proposal nor the accompanying technical documents discuss studies finding no association. CEI’s comments list and link to 19 such studies for the EPA’s consideration.
At a minimum, the EPA should have discussed Enstrom (2017) and Young et al. (2017). Retired UCLA epidemiologist James Enstrom’s reanalysis of the American Cancer Society cohort study by Pope et al. (1995), a foundational study for the EPA’s regulation of PM2.5, finds “No significant relationship between PM2.5 and total mortality in the CPS [Cancer Prevention Study] II cohort . . . when the best available PM2.5 data were used.” Enstrom contends that Pope’s finding of a “positive association” is due to “selective use” of both cohort and PM2.5 data.
Statistician S. Stanley Young and colleagues examined mortality and air quality data on both PM2.5 and ozone in the eight most populous California air basins during 2000-2012. Their database comprised 2 million deaths over 13 years and 37,000 exposure days. Despite performing extensive sensitivity analyses with alternative statistical models, Young et al. were “unable to find a consistent and meaningful relationship between air quality and acute death in any of the eight California air basins considered.”
When an agency overlooks peer-reviewed assessments that run counter to its views, it fails to consider “an important aspect of the problem.” Such partiality is arbitrary and capricious, according to the Supreme Court.
CEI’s comments also note the incongruity between other health information and the EPA’s killer PM2.5 narrative. Consider the following examples.
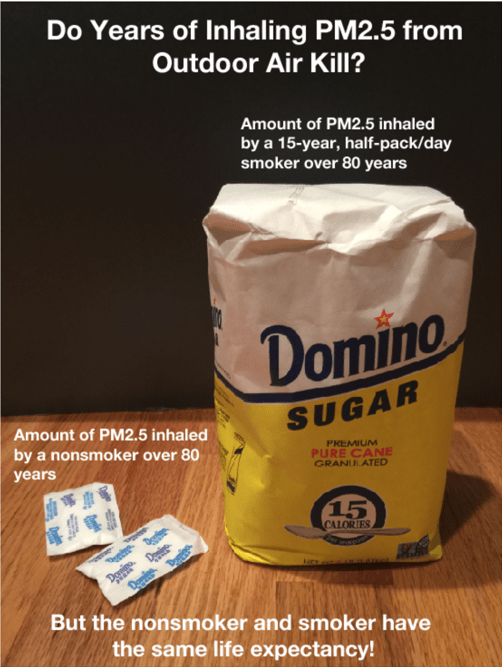
Prabhat Jha et al. (2013), a study published in the New England Journal of Medicine, finds that smokers who quit before age 35 have life expectancies virtually identical to persons who have never smoked. Citing that study in a CEI policy paper, regulatory analyst Steve Milloy notes that a person who smokes a half pack a day over 15 years and then quits before age 35 inhales about 4 lbs. of PM2.5. In contrast, the never smoker inhales only a few ounces of PM2.5 from the ambient air. “What does it say about the lethality of PM2.5 on a long-term basis,” Milloy asks, “if a non-smoker and smoker can have the same life expectancy despite the vast differences in PM2.5 inhaled—a sugar packet versus more than a sugar bag’s worth, respectively?”
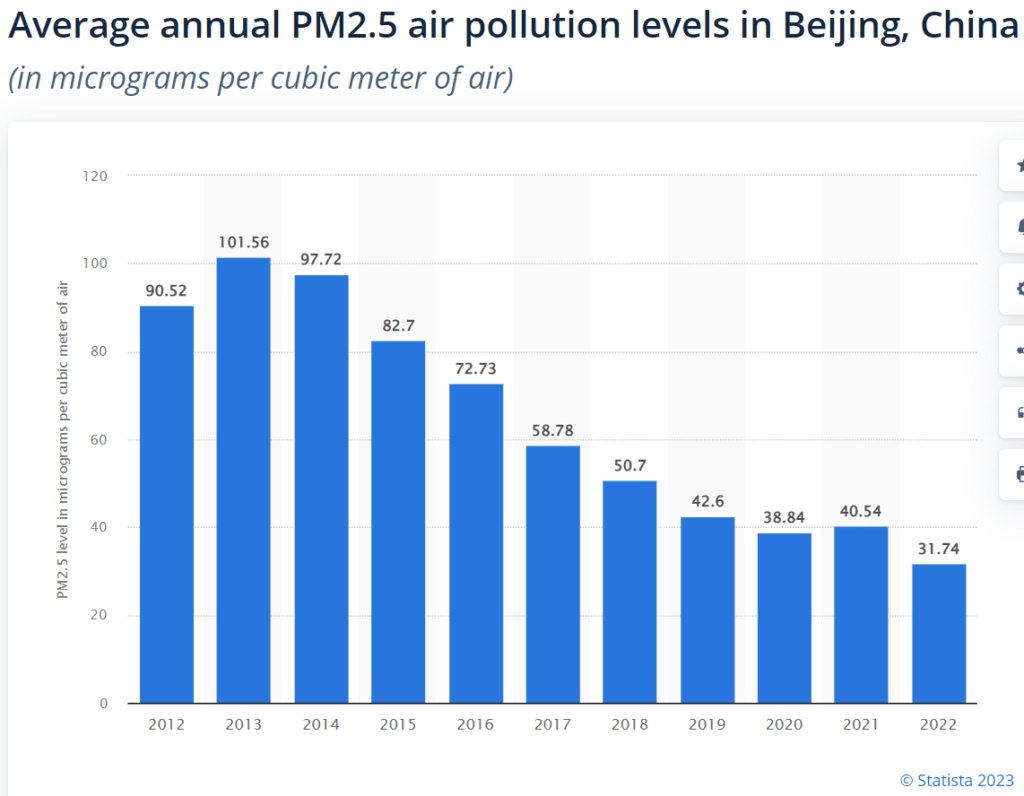
PM2.5 levels in China’s major urban centers are much higher than the current NAAQS. Yet, life expectancy in Beijing (82.2 years) is roughly equal to that of Arlington, County, Virginia (82.6 years), where PM2.5 levels have been lower than the NAAQS for more than a decade.
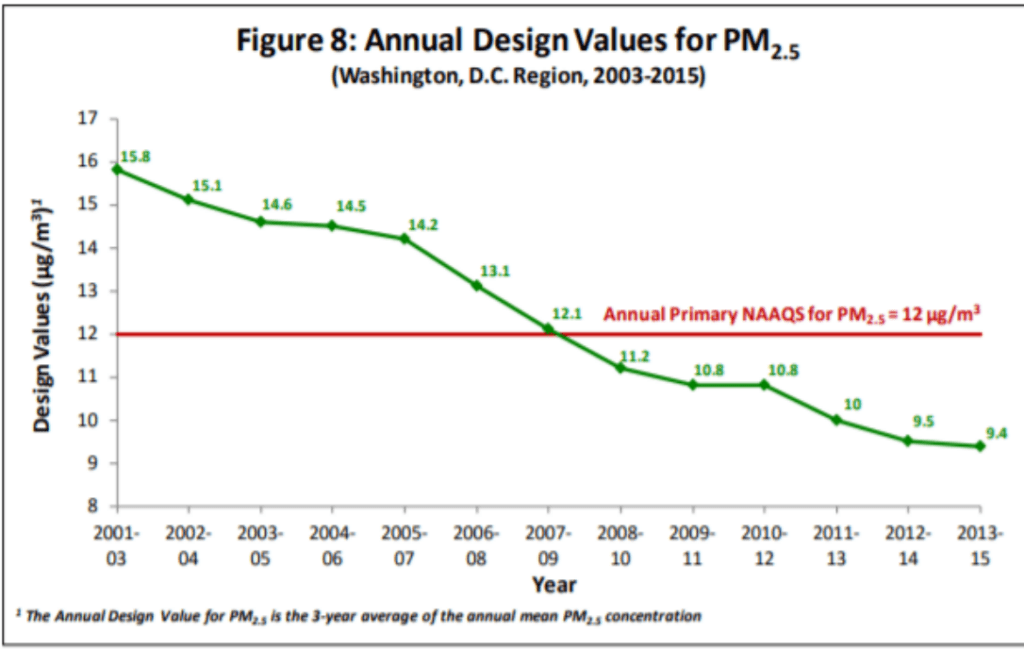
PM2.5 levels in Beijing were about five times higher than the D.C. Metro area in 2021 (~8 µg/m3) and were 9-12 times higher in the early 2010s. Clearly, the elderly in Beijing have been breathing very high ambient concentrations of PM2.5 for many years. If PM2.5 is as deadly as the EPA claims, with life expectancy declining by 0.35 to 0.61 years for every 10 µg/m3 increase in ambient concentration (88 FR 5581), why do Beijing residents live about as long residents of affluent Arlington County?
Comparisons between the U.S. and other countries raise similar questions. Almost every country in the world has higher PM2.5 concentrations than the United States, yet some industrialized countries with higher PM2.5 levels also have higher life expectancies than the U.S.
For instance, according to the World Health Organization, in 2019, U.S. PM2.5 levels averaged 7.18 µg/m3 compared to 9.52 µg/m3 in Great Britain, 10.73 µg/m3 in Germany, 10.46 µg/m3 in France, and 14.22 µg/m3 in Italy. Yet those countries have higher life expectancies than we do. Average life expectancy at birth in the U.S. is 80.2 years compared to 82.05 years in Great Britain, 81.7 years in Germany, and 82.79 years in both France and Italy.
Obviously, such comparisons do not disprove PM2.5 health effects because many socioeconomic and environmental factors influence all-cause mortality risk. Nonetheless, the numbers suggest that further reductions in U.S. PM2.5 levels may not yield discernible improvement in public health.
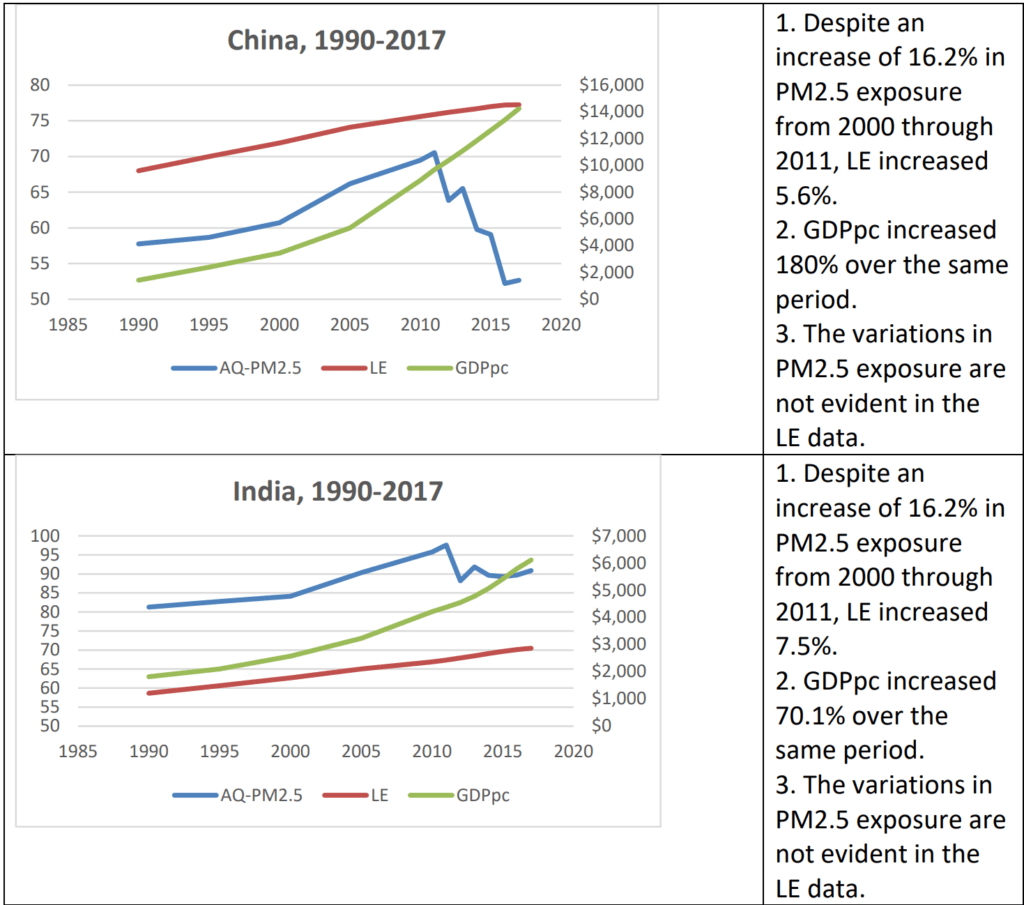
Economist Indur Goklany makes a complementary point in a recent commentary on the University of Chicago’s Air Quality Life Index (AQLI) report. The AQLI report describes PM2.5 pollution as the greatest risk to human health, reducing global life expectancy by 2.2 years. The authors estimate that reducing PM2.5 levels to the World Health Organization’s guideline of 5 µg/m3 would increase life expectancy in Bangladesh, India, Nepal, and Pakistan by five years, and in China by 2.5 years.
Goklany examines whether life expectancies in those countries are inversely correlated with PM2.5 exposures. He finds that life expectancy has “improved more or less continuously in each country, at least from 1990 onward regardless of whether PM2.5 exposures went up or down.” He also finds that life expectancy “correlates far better” with per capita GDP (GDPpc) than PM2.5 exposure. Indeed, life expectancy (LE) data are not correlated with either increases or decreases in PM2.5 exposure.
Goklany illustrates those findings separate graphs for each of the five countries. Here are his graphs for China and India.
Conclusion
Whether the EPA’s proposed revision of the primary PM2.5 NAAQS would yield significant health benefits to the American people is doubtful. What is beyond dispute is that public alarm about PM2.5 translates into political support for the EPA and the regulatory academic complex it leads and funds.
That is a big topic and beyond the scope of this post. For an in-depth examination, see University of Virginia Law School professor Jason Johnston’s chapter, “The EPA’s Conflicted ‘Science’ on Fine Particle Mortality,” in Patrick J. Michaels & Terence Kealey’s book Scientocracy: The Tangled Web of Public Science and Public Policy (Cato Institute, 2019).