Chapter 4: The Unknowable Costs of Regulation and Intervention and a $1.939 Trillion Estimate
The federal government undertakes little review of federal regulation to ensure that regulations individually do more good than bad each year, and it performs no assessment whatsoever of regulatory burdens as a whole.
The last aggregate annual estimate of the cost of the regulatory enterprise, a task required by law, was performed in 2002. Although it might be unfair to say Washington does not know how to count, one can say Washington refuses to do so. There is the small number of counted regulations but also the uncounted, the uncountable, the omitted, and the ignored, each awaiting disclosure.
The federal escalations of the past three years vastly expanded the scope and cost of existing regulatory enterprises that were already uncaptured and untabulated in cost estimates, and they added new ventures atop them. In law but not in practice, the sole official reckoning citizens receive regarding the scale and scope of regulatory costs is an annual Office of Management and Budget (OMB) survey of a subset of regulatory costs and benefits, the Report to Congress on the Benefits and Costs of Federal Regulations and Agency Compliance with the Unfunded Mandates Reform Act.
These reports, not seen in years, contain a limited overview of significant rules and a suspect partial monetary quantification of costs and benefits of a handful of executive agencies’ rules during the current fiscal year and the most recent 10 years.
OMB’s Report(s) to Congress on the Benefits and Costs, for fiscal year (FY) 2020, FY 2021, FY 2022, and now FY 2023 have yet to appear. The 2017 edition covering FY 2016 Obama-era rules and regulations arrived years overdue in December 2019, a delay unprecedented up until that time. During the Trump administration, a surge to catch up brought forth a truncated Draft Report combining the overdue FY 2018, FY 2019, and FY 2020 reports in one abbreviated volume the day before Christmas Eve in 2019, along with supplemental tables in electronic format, but without the 10-year look-backs that had become standard after the aggregate estimate required by law was abandoned. Undated final reports for those years, covering the period through FY 2019, appeared on OMB’s website with its URL indicating a January 2021 upload. At least during the Trump years, the public did get year-end status reports on Trump’s one-in, two-out Executive Order 13771 directive on agency regulations. These have now been purged from the OMB website on which they should continue to reside as historical material (the now-delinked URL
is https://www.reginfo.gov/public/do
/eAgendaEO13771).
OMB’s last 10-year survey—that of FY 2016 in the 2017 Report to Congress—conveyed that federal executive agencies published 36,255 final rules in the Federal Register, of which OMB reviewed 2,670 under Executive Order 12866 (independent agencies are exempt from this process). Of those OMB-reviewed rules issued between 2006 and 2016, 609 were considered “major.” As typical, OMB claimed high net regulatory benefits, pegging the cumulative benefits of a selection of 137 major rules at between $287 billion and $911 billion (in 2015 dollars). By comparison, the estimated range for the decade’s costs was declared to be $78 billion to $115 billion. The 16 rules subjected to both benefit and cost analyses during FY 2016 added annual costs in the range of $4.3 billion to $6.4 billion.
The Trump era (and final to date) composite report covering fiscal years 2017–2019 encompassed a handful of major rules with reported total costs and benefits of only a few billion each:
- FY 2017: $6.9 billion to $11 billion in annual benefits; $2.5 billion to $3.7 billion in annual costs (2016 dollars)
- FY 2018: $0.2 billion to $0.6 billion in annual benefits; $0.1 billion to $0.3 billion in annual costs (2017 dollars)
- FY 2019: $0.2 billion to $3.7 billion in annual benefits; up to $0.6 billion in annual costs (2018 dollars)
The cumulative high end for costs in the three recent fiscal years is about $4.6 billion, compared with about $105 billion for the prior 10 years, for an average of $8.4 billion in costs added every year for the past 13 years. Although OMB’s reports did not tally an additional swathe of rules with costs but not benefits tabulated, such rules are presented as well. Going back to 2002, there are dozens of such “cost-only” rule disclosures, with high-end cost estimates that add another $54 billion to the cumulative totals.
The foregoing assessments do not capture all regulatory costs, and they are not objective third-party assessments. Agencies grade their own homework, as OMB acknowledges in the 2018–2020 Report to Congress: “As has been the practice for many years, all estimates presented … are agency estimates of benefits and costs, or minor modifications of agency information performed by OMB.” Ultimately, the regulators themselves decide what counts as major and is worth the trouble of cost–benefit analysis. OMB’s report “does not purport to demonstrate all costs or benefits from federal regulation; instead, the report summarizes the anticipated costs and benefits that the Regulatory Impact Analyses (RIAs) of individual final rules reported for those rules.” The report acknowledges an “often-overlooked detail”—that “the totals listed … include only the benefits and costs for the minority of rules for which both those categories of impacts were estimated.”
Overall, the 2018–2020 consolidated Report to Congress encompasses only 145 major rules, a small number compared with the more than 9,500 rules—from large to inconsequential—issued during the time frame. Of the 145 major rules, the three-year report featured only 30 rules with both benefits and costs “quantified and monetized” and another 28 with costs alone quantified, in some cases partially. OMB asserts the major rules it reviews, including budget rules, “represent approximately one-fourth” of the significant regulatory actions reviewed by OMB.
The bottom line is that of the few hundred major rules issued by executive agencies since 2001, a relative handful received OMB-reviewed quantified cost analysis, let alone cost and benefit analysis. Overall, about 38 percent of these rules had quantitative cost estimates. When one looks beyond the self-designated major rules, the proportion of all rules with any cost analysis averages less than 1 percent.
On the Unified Agenda’s Advanced Search page, there exists a radio-button selection for “Agency has reported Compliance Cost Information,” which a pop-up defines as “the estimated gross compliance cost of the action.” Only one active 2022 item is flagged, a holdover Defense Department regulation. No completed or long-term actions reported any cost information.
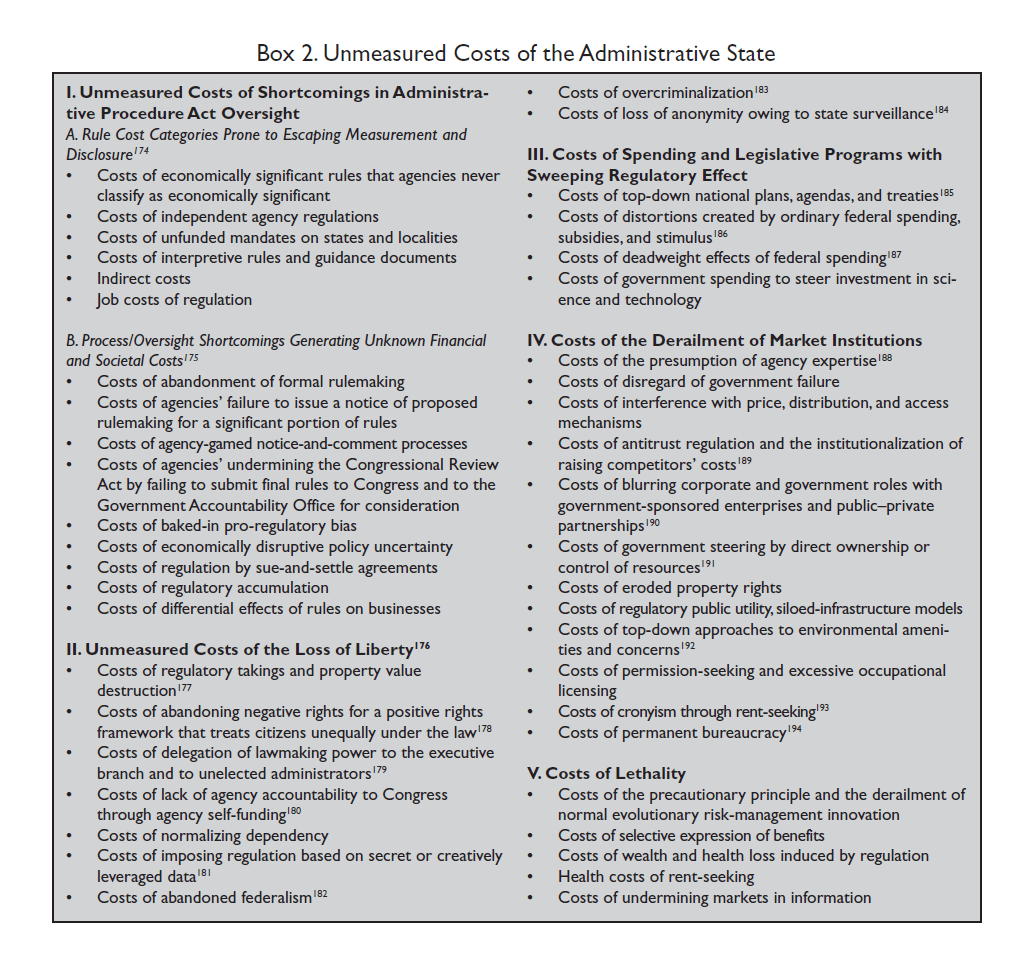
OMB claims the major rules it reviewed account for the bulk of regulatory costs. That is not even close to being true. Earlier OMB reports admitted this. OMB analysts do not review independent agency rules, which include major agencies such as the Federal Communications Commission and financial regulatory bodies whose regulations can have multibillion-dollar economic effects. The OMB review ignores entire categories of economic and social regulation, as depicted in Box 2 later in this report. Even the Unfunded Mandates Reform Act, which is also surveyed in the Report to Congress, exempts a great deal of regulatory intervention from critical analysis.
Transfer and budget programs, for example—unless directly related to national defense or criminal justice—are inherently interventionist and regulatory in nature. Federal medical programs have altered the medical market to such an extent that single-payer insurance is now contemplated as an alternative to skyrocketing, regulation-driven costs. Yet the costs and market distortions caused by such federal spending are not counted. Nor are the deadweight effects of such budget rules, even when the federal government has taken over a substantial portion of retirement and health care funding. Washington’s expansion of middle-class dependency on federal government transfers is about as fundamental as social regulation gets, yet it is not counted among costs.
The fundamental problem with the regulatory Report to Congress is that net-benefit analysis helps fuel indefinite government expansion. Creative regulators can alternate between maximizing net benefits—as in OMB’s 19-year-old “Circular A-4” guidance on regulatory analysis instructs—and claiming that benefits “justify” costs as specified in Executive Order 12866.
In addition, costs of regulatory dark matter—such as agency memoranda, guidance documents, bulletins, circulars, and manuals—do not appear in OMB’s annual assessments. Nor does OMB analyze executive orders’ effects. OMB ignores most of the regulatory universe.
In contrast to the traditionally narrow OMB focus, a 2019 report from the Trump-era Council of Economic Advisers, The Economic Effects of Federal Deregulation, pointed to hundreds of billions of dollars in direct and indirect annual savings from changes not just in a set of rules removed, but also in approaches to regulation as follows:
The Council of Economic Advisers (CEA) estimates that after 5 to 10 years, this new approach to Federal regulation will have raised real incomes by $3,100 per household per year. Twenty notable Federal deregulatory actions alone will be saving American consumers and businesses about $220 billion per year after they go into full effect. They will increase real (after-inflation) incomes by about 1.3 percent. … This new approach to regulation not only reduces or eliminates costly regulations established by prior administrations but also sharply reduces the rate at which costly new Federal regulations are introduced. The ongoing introduction of costly regulations had previously been subtracting an additional 0.2 percent per year from real incomes, thereby giving the false impression that the American economy was fundamentally incapable of anything better than slow growth.
In touting deregulatory actions and their purported benefits in July 2020, the White House claimed, “President Trump has signed 16 pieces of deregulatory legislation that are expected to result in a $40 billion increase in annual real incomes.” The administration’s deregulatory actions would save additional billions not entirely captured in the year-end updates on the one-in, two-out process. For example, the White House claimed that the “implementation of the SAFE [Safer Affordable Fuel-Efficient] Vehicles Rule is estimated to increase the real incomes of Americans by $53 billion per year over the 2021–2029 period.”
During the coronavirus outbreak, CEA also estimated the savings from regulatory streamlining related to pandemic recovery:
The total value of more widespread adoption of telemedicine would be approximately $325 billion per year. Reducing FDA approval times by relaxing overly burdensome impediments to drug development would have a net present value of $1.9 trillion if approval times are sped up by one year, $3.9 trillion if sped up by two years, and $5.9 trillion if sped up by three years. Expanding occupational licensing deregulation for nurse practitioners nationwide could result in $62 billion in cost savings for patients annually.
Many such changes, including the SAFE Vehicles Rule, are on the Biden administration’s chopping block. The CEA approach admits that far greater costs exist that can be attributed to regulation than the annual Report to Congress has ever addressed. That perspective would include, for example, greater attention to the ways regulation and infrastructure spending affect not only current jobs, but also entrepreneurs’ inclination to create new jobs in the future.
If regulatory liberalizations reduced costs, it is also reasonable to presume that prior increases in regulation added billions of dollars in costs. Massive whole-of-government spending and steering like that of the past three years are also a form of regulation. Even grants and subsidies come with strings attached, as with the paid child-care requirements attached to CHIPS Act subsidies.
The federal bureaucracy, with all the vast resources at its disposal, has not fulfilled its duty to assess the aggregate effects of regulation and intervention in which it engages. The Small Business Administration last published an assessment of the federal regulatory apparatus in 2010. It estimated 2008 regulatory compliance costs at $1.75 trillion. That discontinued report was never replaced.
The primary purpose of the Small Business Administration report series was never to give an aggregate cost estimate, but to focus on regulatory burdens on small firms, which suffer higher per-employee regulatory costs than larger ones. Rival official aggregate assessments from OMB and the Government Accountability Office dating back to around the turn of the 21st century also found aggregate annual costs in the hundreds of billions of dollars, some in excess of $1 trillion in the 2013 dollars depicted in Table 2. Such surveys traditionally conveyed regulatory costs in the following categories:
- Economic regulatory costs (for example, market entry restrictions and transfer payments, such as price supports)
- Workplace regulatory costs
- Environmental regulatory costs
- Paperwork costs
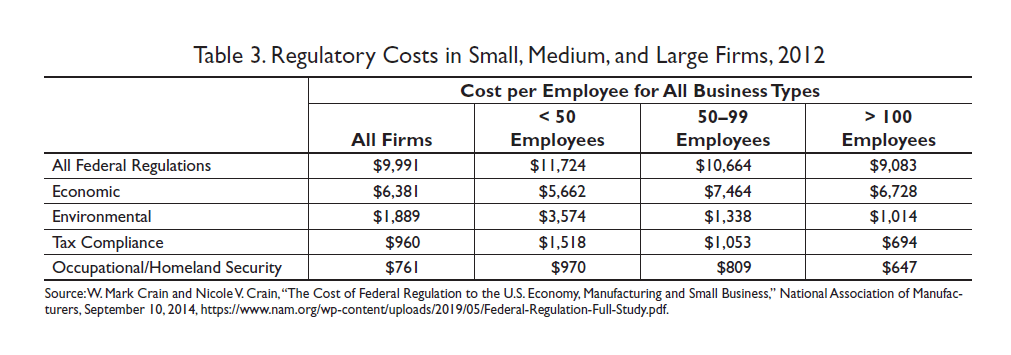
All of these categories have increased since these surveys were done. Private entities have attempted to quantify regulatory costs as well. In a 2014 report, the National Association of Manufacturers (NAM) tallied 2012 total annual regulatory costs in the economy of $2.028 trillion (in 2014 dollars). Unsurprisingly, the NAM report was criticized by progressive academics and consultants for agencies. The NAM report found average annual per-employee regulatory costs to firms to be $9,991, but to vary by firm size in a way that hurt small businesses. The smaller the firm, the larger the per-employee regulatory costs.
As shown in Table 3, NAM found that per-employee regulatory costs for firms with fewer than 50 workers can be 29 percent greater than those for larger firms—$11,724 for smaller firms, compared with $9,083 for larger ones. These figures have not been updated in some time, but the fact that regulation can more heavily fall on small businesses highlights the urgent need for reform.
Academics have also weighed in. A report from 2013 by economists John W. Dawson of Appalachian State University and John J. Seater of North Carolina State University investigated the long-term reduction in economic growth caused by decades of cumulative opportunity costs imposed by economic regulation, positing dozens of trillions of dollars in lost gross domestic product (GDP) annually. The authors contended that rules affecting growth rates compound and that Americans are less than half as rich as they would be in the absence of much of the regulatory state.
A 2016 report by the Mercatus Center at George Mason University used a microeconomic model to determine “how much regulation distorts the investment decisions of firms and thus hampers long-run economic growth.” Using a 22-industry data set covering 1977 through 2012, the report concluded that, had regulatory burdens remained constant since 1980, the 2012 U.S. economy would have been 25 percent larger. Put another way, the 2012 U.S. economy was $4 trillion smaller than it would have been in the absence of cumulative regulatory growth since 1980. That represents a loss in real income of approximately $13,000 per American per year. Seemingly inconsequential regulations accumulate and generate unintended effects and costs that ought not be ignored.
Box 2 illustrates a wide range of regulatory and administrative state interventions that generally go unacknowledged.
Just as the economic calculations necessary to enable central economic planning are impossible, so are regulatory costs impossible to calculate. Disclosure is an important part of regulatory reform, but an important caveat is that the best possible guess for overall regulatory costs is an “idiosyncratic guesstimate.” For several years, this report had used a baseline for across-the-board costs of federal regulation intervention of roughly $1.9 trillion annually, encompassing compliance costs, economic and GDP losses, social costs, and other costs.
Given the emergence of the recent 2017 and 2018–2019 OMB Report(s) to Congress, an additional $10.93 billion annually was added for rules since 2016 that have partial quantification of both costs and benefits and another $14.08 billion for rules that featured only cost analysis. That additional $25.01 billion through FY 2019 brought last year’s total cost estimate to $1.927 trillion.
And there it stopped. No official annualized cost estimates from FY 2020 to FY 2023 are available. One can make a conservative estimate for the years 2020–2022 based on the years of annualized costs the government did bother to present, in context with what one knows of overall costs added in recent years. The American Action Forum maintains a Regulation Rodeo database depicting aggregate regulatory costs as well as paperwork costs by year using the agencies’ own cost reporting in their rulemakings. These figures are substantial, including costly new moves on fuel economy and Treasury investment ownership reporting requirements, for example, There are 922 rules from the past three fiscal years alone presenting total costs (not annualized costs) of $333.3 billion according to American Action Forum:
- 2020: 445 rules; $14.7 billion
- 2021: 283 rules; $201.5 billion
- 2022: 264 rules; $117.1 billion
This report noted earlier that, an average of $8.4 billion in costs were noted by OMB in its not-all-encompassing Report to Congress every year for the past 13 years through FY 2019. For the missing three years, this report will employ half that, or $4 billion annually, which adds $12 billion in the tentative gross estimate.
Figure 1 presents the updated tally for regulatory intervention of $1.939 trillion annually. These figures, until OMB releases updated reports, are housed in “All other” in that diagram.
This estimate is based on a nonscientific, disclaimer-laden, amalgam of GDP losses and compliance costs derived from available official data and other accessible sources. It recognizes that significant figures are indeterminate not only in the millions and billions place figures, but also in the trillions place figure. This report is not alone in finding itself in this predicament.

The government also cannot round with exactitude on even easier matters, like paperwork reduction information as required by the Paperwork Reduction Act. As of January 22, 2023, OMB reported that government-wide totals for “Active Information Collections” imposed a “total annual cost” of $143,731,031,418 (notice those fantastical significant amounts down to the ones place figure) and take up 10,419,273,111.45 hours. One might note with amusement the three-quarters-of-an-hour precision.
This assessment has effectively been stuck at a $2 trillion undercount for 10 years. A central government nonchalant about $31 trillion in debt will likely be so regarding off-the-books impositions of the sort that Box 2 begins to capture. This report’s assessments do not capture numerous other categories of costs, such as the costs of antitrust, common-carriage telecom network regulations, federal health care spending, predominance of public–private partnerships in large-scale infrastructure projects, resource-use restrictions on western lands, a “too big to fail” stance toward large financial institutions, the permanent war economy, surveillance of private citizens, overcriminalization, monopolization of airport security, influence on the housing market and financing, and much more—now including the entire Biden compulsory reset agenda.
There will never be exact agreement on the magnitude of regulatory costs and benefits. Despite the overwhelming difficulty of calculating regulatory cost estimates, it is crucial for policymakers to force OMB to perform comprehensive assessments and to disclose estimated costs of aggregate burdens to the extent possible. In the meantime, subsequent reports from this quarter will incorporate new fiscal years’ partial tallies incrementally, should OMB make them available.
Although escalation of government debt from the COVID-19 pandemic and new measures like the bipartisan infrastructure bill will show up in federal budget figures, the public faces the great hurdle that other interventions rooted in recent legislation, such as costs of the eviction moratoriums, may never appear in anything presented by OMB. Costs attributable to the federal government’s contribution to inflation and supply-chain disruption are extraordinarily difficult to assess.
Douglas W. Allen of Canada’s Simon Fraser University remarked in September 2021, “It is possible that lockdown will go down as one of the greatest peacetime policy failures in modern history.” Costly lockdowns are a metaphor for any regulation shrinking the production frontier and well-being, and nothing here captures federal abuse of crisis and the enabling of states that did the same. After all, some business literature finds mere routine distractions and interruptions in the workplace to cost hundreds of billions each year. Post-lockdown, the redirecting of private-sector resources toward government-chosen ends via spending, procurement, and contracting will involve trillions in compounded ripple effects, leading to opportunity costs unlikely to show up in any yearly regulatory assessment like that of OMB.
With respect to the pandemic’s effect on GDP estimates in 2021, the U.S. Bureau of Economic Analysis stated, “The full economic effects of the COVID-19 pandemic cannot be quantified in the GDP estimate for the fourth quarter because the impacts are generally embedded in source data and cannot be separately identified.” With its century-plus of neglect and omissions, problems of measuring regulation are worse than those confronting GDP measurement.
Regulatory Cost Burdens Compared with Federal Spending and the Deficit
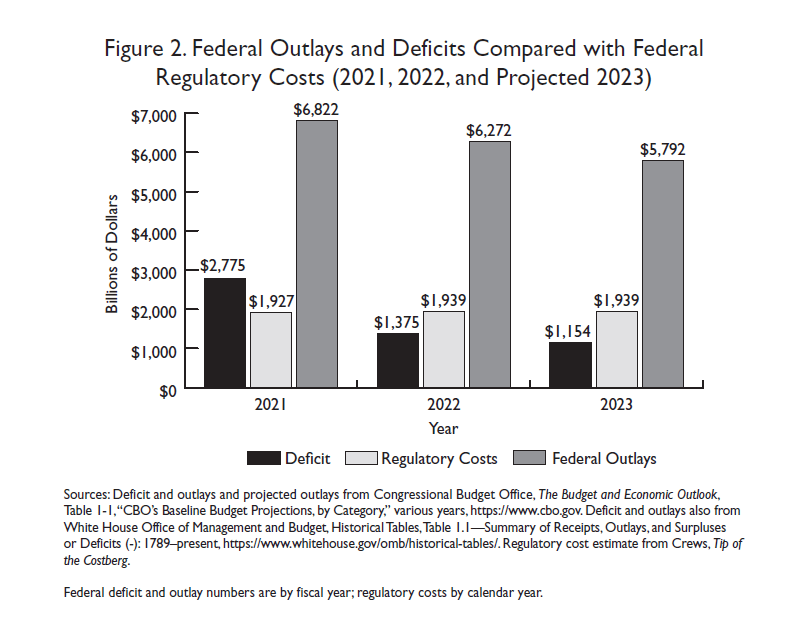
Comparing regulatory costs with federal taxation and spending helps place the numbers in perspective. According to the newly released Congressional Budget Office (CBO) Budget and Economic Outlook, covering FY 2022 and projections for FY 2023–FY 2033, the U.S. federal government posted $6.272 trillion in outlays and a deficit of $1.375 trillion in FY 2022, on revenues of $4.05 trillion. Biden calls this the “largest ever decline in the federal deficit.”
According to CBO, outlays will cross the $7 trillion mark by 2026 and will reach just short of $10 trillion annually by 2033. Deficits persist as far as the eye can see, wobbling up and down a little but still passing $2 trillion in 2030.
Figure 2 compares deficits and outlays for fiscal years 2021 and 2022, and projected amounts for FY 2023, with regulation. When costs of regulation have tended to hover around 40 percent of outlays in pre-COVID-19 years, the skyrocketing spending of 2020 resulted in costs of regulatory interventions of about 28 percent of budgetary outlays of $6.822 trillion. Regulation now stands at about 31 percent of outlays and easily exceeds 2022’s $1.375 trillion deficit.
However, while spending and debt are tracked, official measurements to capture likely increased regulatory costs generated by highly regulatory legislative enactments are not prioritized. Unremitting projected deficits can also increase pressure to regulate instead of spend.
Regulatory Costs Compared with Income Taxes and Corporate Profits
This report’s regulatory cost estimate is larger than combined individual and corporate income tax receipts in recent years, up until the pandemic spending. For example, in 2020, individual and corporate taxes taken as a whole stood at $1.8 trillion. With both individual and corporate tax receipts rising while the regulatory estimate has remained largely the same, it was inevitable that tax collections would catch up to the regulatory estimate, pandemic or no.
Income tax collections for individuals that were $1.6 trillion in FY 2020 have surged to an estimated $2.26 trillion for FY 2022. The implication is not so much that outstripping is taking place, but rather that regulations are not being measured officially as should be done. Federal activity that is mapped in spending should also be mapped in disclosures of the burdens of regulatory interventions, but is not.
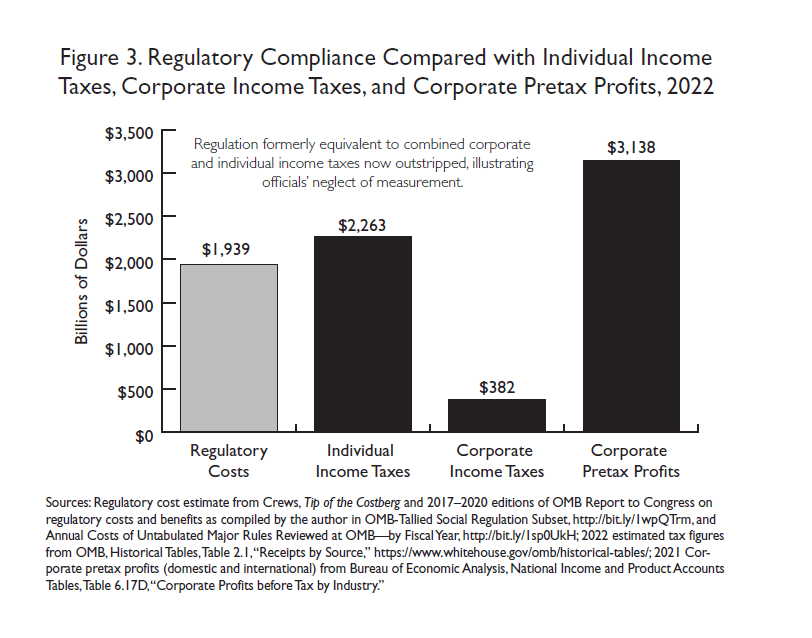
As Figure 3 shows, regulatory costs no longer surpass individual income tax revenues, estimated at $2.26 trillion for FY 2022. Corporate income taxes collected by the U.S. government—an estimated $382 billion for FY 2022—remain dwarfed by regulatory costs but still shot up over $110 billion over the past two years. The sum of the two—$2.64 trillion—now handily tops this report’s regulatory cost estimate of $1.939 trillion.
Regulatory costs as depicted here not long ago approached the level of pretax corporate profits, which were $2.4 trillion in 2020. Those profits in 2021 surged to the $3.1 trillion shown in Figure 3.
Regulatory Costs Compared with U.S. Gross Domestic Product
In January 2023, the Commerce Department’s Bureau of Economic Analysis estimated U.S. current-dollar GDP for 2022 at $25.46 trillion. The total regulatory cost figure of $1.939 trillion annually is equivalent to approximately 8 percent of that amount. Combining regulatory costs with federal FY 2022 outlays of $6.272 trillion (see Figure 2), the federal government’s share of the economy stood at some $8.2 trillion in 2022, or roughly 32 percent of GDP (see Figure 4). None of these metrics include state and local spending and regulation.

U.S. Regulation Compared with Some of the World’s Largest and Freest Economies
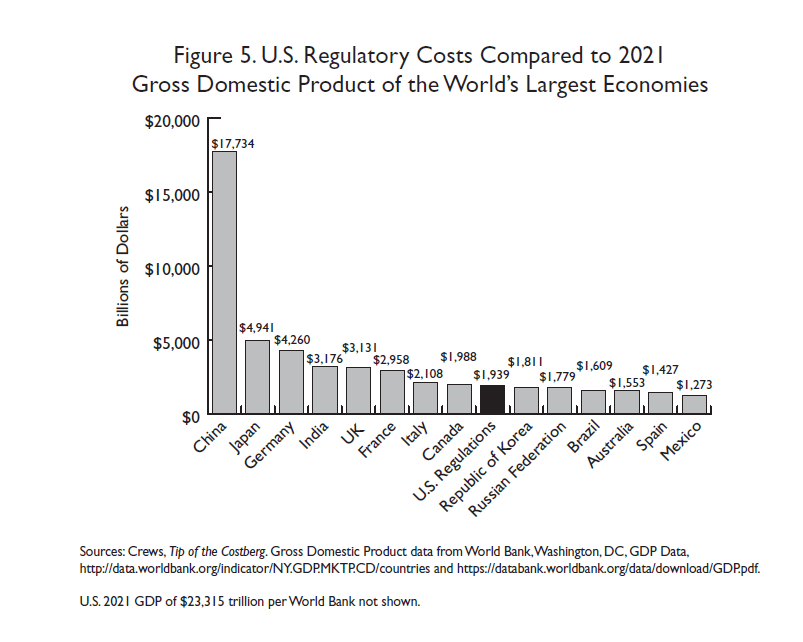
U.S. regulatory costs fall just short of Canada’s 2021 GDP, at $1.988 trillion, and surpass Mexico’s $1.273 trillion. If U.S. regulatory costs of $1.939 trillion were a country, it would be the world’s ninth-largest economy, ranking behind Canada and ahead of the Republic of Korea (see Figure 5).
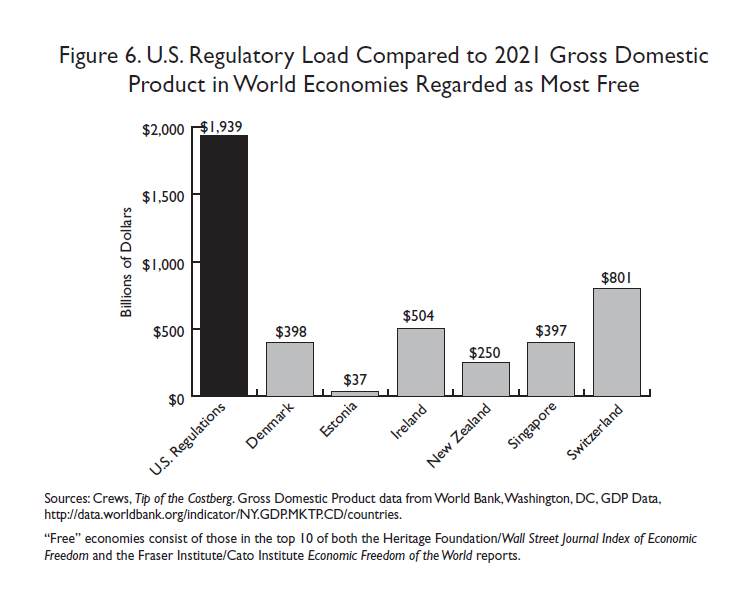
The U.S. regulatory figure of $1.939 trillion not only exceeds the output of many of the world’s major economies, but also greatly outstrips even those ranked as the freest economically by two prominent annual surveys of global economic liberty. Figure 6 depicts the 2021 GDPs of the six nations ranked in the top 10 in both the Heritage Foundation Index of Economic Freedom and the Fraser Institute/Cato Institute Economic Freedom of the World report. The Fraser/Cato index ranks the United States 7th, whereas the Heritage report ranks the United States 25th, a drop from the 20th spot of a year ago.
Regulation: A Hidden Tax on the Household Budget
Taxes can seem more immediate and present than regulation. Taxes are itemized on pay stubs, whereas most regulatory costs are baked into prices, without separate charges on receipts. Regulations are more hidden. Many regulations have opportunity costs, which are invisible and impossible to calculate. They can affect households directly or indirectly, such as when businesses will pass some regulatory costs on to consumers just as they do the corporate tax. Other costs of regulation will find their way to workers and investors. Many consumers are also workers and owners through their stock and mutual fund holdings.
There is no way to know the true incidence of regulatory costs. But by assuming a full pass-through of all regulatory costs to consumers, one can look at American households’ share of regulatory costs and compare it with total annual expenditures, which are compiled by the Department of Labor’s Bureau of Labor Statistics.
For America’s 133.6 million households, the average 2021 pretax income was $87,432 (over the prior year’s $84,352). If one were to allocate annual regulatory costs, assuming the full pass-through of costs to consumers, U.S. households “pay” $14,514 annually in embedded regulatory costs ($1.939 trillion in regulation divided by 133,595,000 consumer units), or 17 percent of an average income before taxes, and of course more as a share of after-tax income.
This hidden regulatory tax exceeds every annual household budgetary expenditure item except housing (see Figure 7). Regulatory costs amount to up to 22 percent of the typical household’s expenditure budget of $66,928. That expense budget represents a major jump for 2021 over the $61,334 of a year earlier, greater percentage-wise than the jump in income, and presumably reflecting inflation. The average U.S. household spends more on hidden regulation than on health care, food, transportation, entertainment, apparel, services, or savings. Recall here that this report is imputing only a tiny increase in a compliance and intervention that has gone largely unchanged in the past decade, even as taxes, deficits, the debt, incomes, and expenses have all increased.
A small piece of regulatory costs is not hidden. Consumers pay for regulatory agencies and administration budgets more directly through taxes, as described in the next section.
Administrative and Enforcement Costs of Regulation
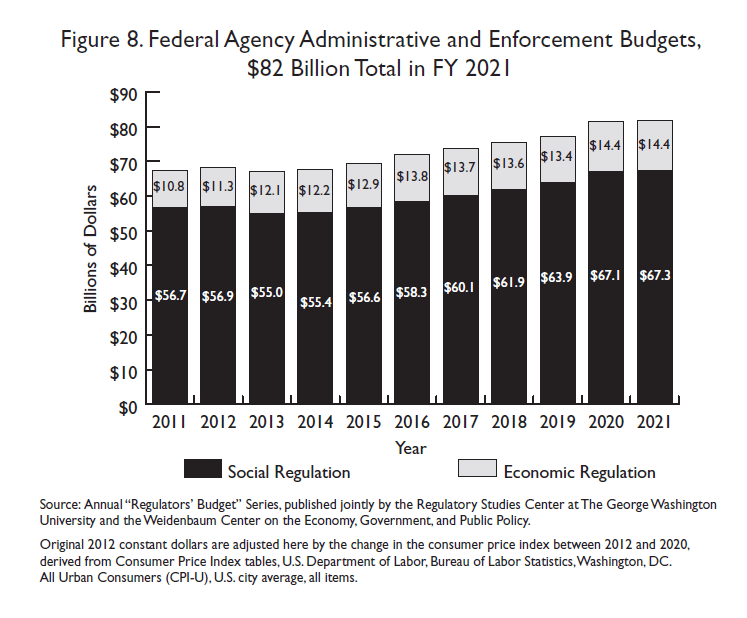
Regulatory cost estimates inadequately capture compliance, deadweight, and other costs experienced by the public. But administrative costs do get captured. These are the on-budget amounts federal agencies spend to issue and enforce rules. The Weidenbaum Center at Washington University in St. Louis and the George Washington University Regulatory Studies Center in Washington, DC, examine presidents’ annual budget proposals to compile the administrative costs of developing and enforcing rules.

According to the latest compilation, estimated FY 2021 enforcement costs incurred by federal departments and agencies stood at almost $82 billion (in constant 2021 dollars, here adjusted from original 2012 dollars) (Figure 8). Of that amount, $14.4 billion was incurred on administering economic regulations. The largest amount, spent on writing and enforcing social and environmental regulations, was $67.3 billion. The $82 billion in regulatory agency enforcement costs helps envision the administrative apparatus, as these costs come on top of other estimates of regulatory compliance and economic burdens. In current dollars, the Environmental Protection Agency alone spent an estimated $5.236 billion in this category in 2021, accounting for over 6 percent of total reckoning of expenditures by all regulatory agencies. EPA formerly accounted for the lion’s share of government administration and enforcement costs, but the Department of Homeland Security’s costs, at an estimated $39.7 billion, now account for 48 percent.
The Weidenbaum Center and the Regulatory Studies Center also estimate the number of full-time-equivalent administrative and enforcement staff at 288,409 in FY 2021. The number of federal employees has increased by more than 100,000 since 2001, when staffing was 173,057. Much of the post-2001 surge may be attributable to the then-newly created Transportation Security Administration’s hiring of thousands of airport screening personnel. Policymakers might take interest in metrics like government employees per capita and contractors per capita.
Costs are one way to attempt to capture the size and scope of the federal regulatory enterprise. Another is to assess the production of paper—the regulatory material that agencies publish each year in sources like the Federal Register.