Chapter 8: The “Regulatory Plan and Unified Agenda of Federal Regulatory and Deregulatory Actions”
Along with the Report to Congress, Federal Register, and Code of Federal Regulations, another vehicle for regulatory disclosure is the spring and fall editions of the “Regulatory Plan and Unified Agenda of Federal Regulatory and Deregulatory Actions.” Agencies outline regulatory goals and intentions in the Unified Agenda, particularly in the fall Regulatory Plan component.
The Unified Agenda is not a complete compendium of all rules like the Federal Register, but rather it presents a cross-section of regulatory priorities from over 60 federal departments, agencies, and commissions along three categories:
- Active actions: prerule measures and proposed and final rules in the production process
- Completed actions: rules finalized (or withdrawn) during the previous (roughly) six months since the prior Agenda
- Long-term actions: rulemakings anticipated to take place beyond a 12-month horizon

The Unified Agenda’s contents and bulk reflect the divergent priorities of administrations and political considerations such as rulemaking pause during election years. Agencies are not required to limit their regulatory activity to the material published in the Unified Agenda unless an administration instructs otherwise. Rather, the Agenda “reflect[s] what the agency wants to make public, not necessarily all activity under consideration, and some highly controversial issues may be withheld.” The Biden administration’s pursuit of regulatory net benefits contrasts with the “one-in, two-out” streamlining mindset reflected in the semiannual Agendas between 2017 and 2020, when hundreds of entries were deemed deregulatory.
Most rules in the Unified Agenda are not new but represent carryovers from prior editions as they advance through stages, sometimes slowly. In the fall 2023 edition, 320 active rulemaking actions appeared for the first time, compared with over 400 in both Biden’s first year and Trump’s last.
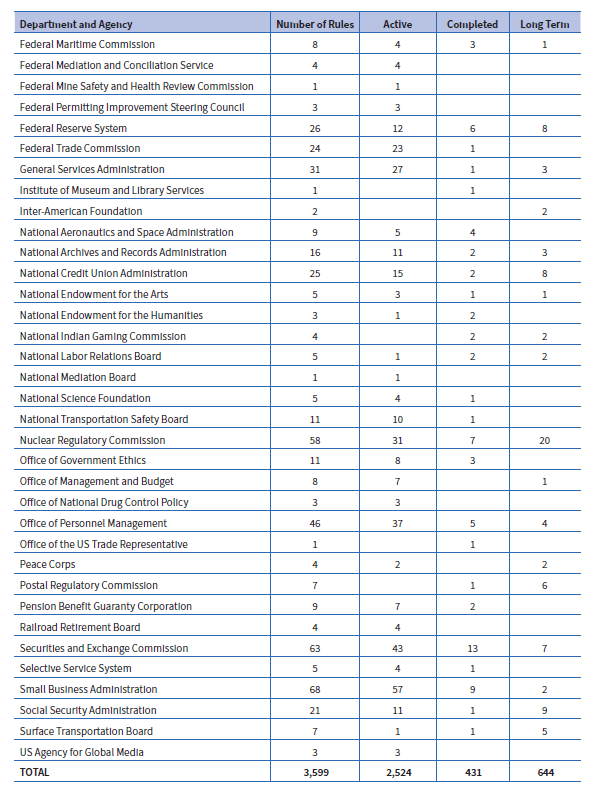
The fall 2023 “Regulatory Plan and Unified Agenda of Regulatory and Deregulatory Actions” found 69 departments, agencies, and commissions listing 3,599 rules in the active (prerule, proposed, and final), recently completed, and long-term stages, many of which had been in the pipeline for some time. The top bars are comparable to recent years, as seen in Figure 18. Table 6 breaks out by department, agency, and commission the 3,599 rules in the active, completed, and long-term stages.
Biden continues a longstanding tradition of reporting well over 2,000 rules in the active phase, the exception being a dip to 1,977 in 2017 under Trump that also contained 448 entries deemed deregulatory. Notably, as Figure 18 indicates, Biden’s long-term rule planning stands well above Obama-era levels. Historically, the Agenda often exceeded 4,000 active, completed, and long-term rules through 2013. Unified Agenda counts were highest in the 1990s, peaking at 5,119 rules in fall 1994 before a series of mid-1990s regulatory reforms. The fall 2017 Agenda pipeline of 3,209 contained the fewest rules since 1983, even without counting that edition’s 540 deregulatory entries. (For a history of the total numbers of rules in the Unified Agenda from 1983 to the present, see Appendix I.)


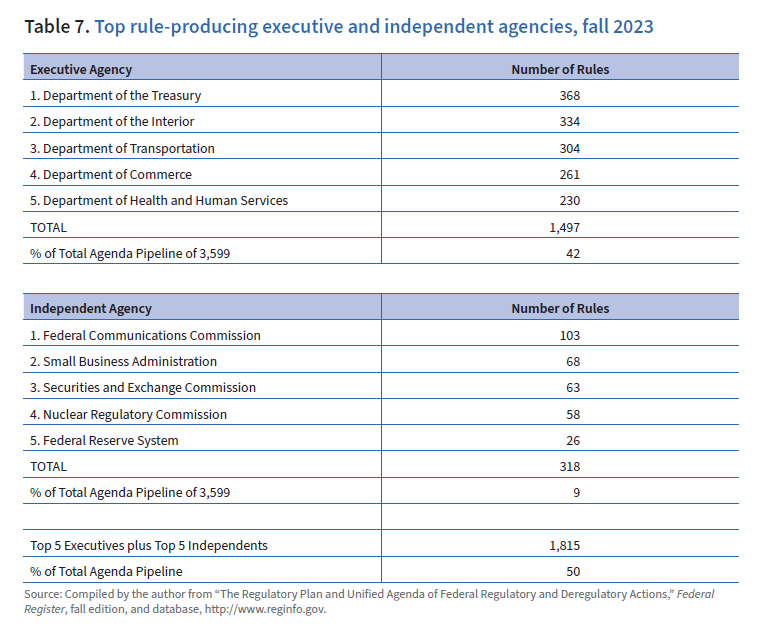
A relative handful of executive branch agencies each year account for the greatest number of rules in the pipeline. In the fall 2023 Agenda, the Departments of the Treasury, the Interior, Transportation, Commerce, and Health and Human Services are the most active (see Table 7). These top five, with 1,497 rules among them, account for 42 percent of the 3,599 rules in the pipeline. The Environmental Protection Agency, with 209 rules, takes sixth place. The Federal Communications Commission, with 103 rules, leads the pack among the independent agencies.
The top-five independent agencies in the Unified Agenda pipeline by rule count (excluding the multiagency Federal Acquisition Regulations System) are the Federal Communications Commission, Small Business Administration, Securities and Exchange Commission, Nuclear Regulatory Commission, and the Federal Reserve System. Their total of 318 rules accounts for 9 percent of the 3,599 rules in the fall Agenda. Combined, the top-five executive and independent agency components, numbering 1,815, make up 50 percent of the total.

Biden’s high-significance rules in the Unified Agenda
Until April 2023, and as reflected in the spring 2023 Unified Agenda, a subset of the Agenda’s rules were classified as economically significant, referring to agency and OMB assessments that a rule was accompanied by attendant yearly economic effects of at least $100 million. Biden’s EO 14094 raised the cost threshold for a significant regulatory action to $200 million, in the process eliminating the longstanding economically significant designation and replacing it with a Section 3(f)(1) Significant designation (or S3F1). OMB now refers to economically significant in the past tense:
This term [economically significant] was used for regulatory actions reviewed between September 30, 1993, when EO 12866 was issued, and April 6, 2023, when the Modernizing EO was issued. The term referred to a regulatory action as determined under Section 3(f)(1) of EO 12866, that will have an annual effect on the economy of $100 million or more or will adversely affect in a material way the economy, a sector of the economy, productivity, competition, jobs, the environment, public health or safety, or State, local, or tribal governments or communities.
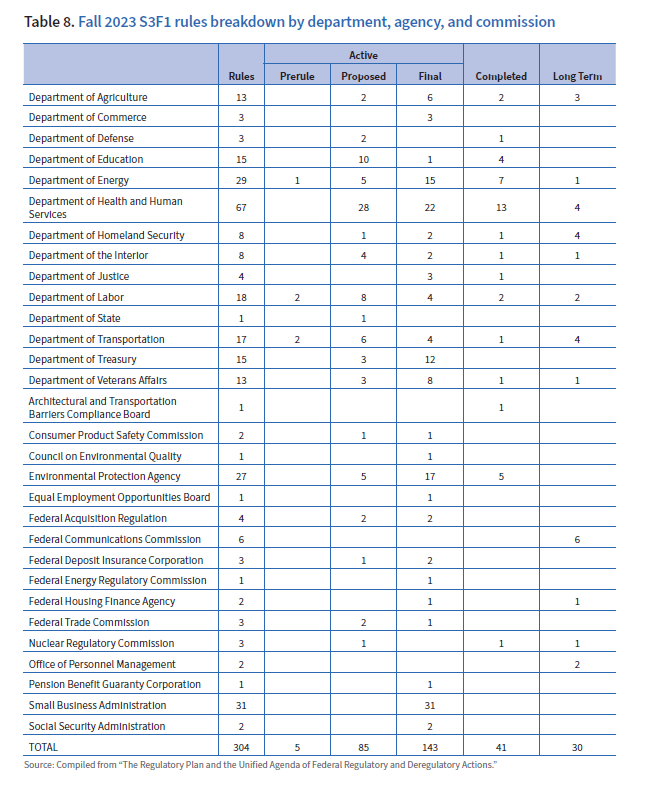
One might have expected a substantial drop in high-significance rules from the spring 2023 Agenda count of 297 economically significant rules when the $100 million threshold still applied, but the number instead increased. As Figure 19 shows, 304 rules in the pipeline are designated as having $200 million in annual economic impact. That implies eventual combined annual effects of nearly $61 billion, which is notable in the context of the $59 billion in annual regulatory costs being added over the past three fiscal years (Table 3). Of these, 233 are active, 41 recently completed, and 30 long-term. Table 8 presents an inventory of these 304 rules by the 30 issuing departments and agencies.


Figure 19’s depiction of fall 2023’s 304 Section 3(f)(1) Significant (S3F1) rules includes those designated economically significant over the prior nine years. Although the 304 rules in the pipeline mark an 8 percent drop from the previous year (fall 2022) as might be expected given the higher threshold, the new count nonetheless stands well above earlier years depicted. Note particularly the active S3F1 component compared with prior years’ merely economically significant rules. The 233 active $200 million rules in play at year-end 2023 stand 95 percent above the corresponding count of five years ago, and 77 percent above the active count of 10 years ago when high-significance meant only $100 million in costs. Appendix J contains the full list of S3F1 rules—233 active and 30 long-term—that agencies affirm to be in production right now.
Recognizing that overlap occurs in transition years after elections, here are calendar-year breakdowns of yearly average high-significance active rules in play under recent administrations in their fall Agendas:
- Barack Obama (eight years): average 133 per year
- Donald Trump (four years): average 120 per year
- Joe Biden (first three years): average 227 per year
Figure 19 represents flows of the fall Agendas. That represents a thorough year-end snapshot as far as active and long-term rules are concerned, but incorporating the spring Agendas is necessary for the full picture when it comes to the completed subset. Figure 20 captures the 27 completed economically significant rules in the spring of 2023, plus the fall of 2023’s 41 completed S3F1 rules. High-significance completed rules are down to 68 from 89 in 2022, perhaps in part due to the new threshold. However, the aforementioned higher number of active rules makes this category important to monitor.
Recognizing that overlap occurs in transition years after elections, here are calendar-year breakdowns of completed highly significant rules under recent administrations. Biden’s average is highest at 87 completed per year, even with the shift to the higher $200 million threshold.
- George W. Bush (eight years): average 49 completed economically significant rules per year
- Barack Obama (eight years): average 69 completed economically significant rules per year
- Donald Trump (four years): average 72 economically significant rules per year (includes over 50 deregulatory during term)
- Joe Biden (first three years): average 87 highly significant rules per year
Box 1 excerpts for examination the combination of the spring economically significant and fall S3F1 completed actions for the year.
The emphasis on the high-cost rule subsets should not distract policymakers and analysts from the remaining bulk of rules in the annual pipeline of over 3,000, many of which can and do have substantial costs or effects in their own right.
