Marlo Lewis Comment to the SEC on Climate Risk Disclosure

Comments of the Competitive Enterprise Institute, Caesar Rodney Institute, Committee for a Constructive Tomorrow (CFACT), Energy and Environment Legal Institute, FreedomWorks, Heartland Institute, National Center for Public Policy Research, and 60 Plus Association
Thank you for the opportunity to comment on Acting Chair Allison Herren Lee’s questions on climate change disclosures.[i] Our comments are broadly responsive to the foundational issue raised in Question 2. Please address any inquiries about this letter to Marlo Lewis, Senior Fellow, Competitive Enterprise Institute ([email protected]).
Introduction: Climate Risk Quantification and Measurement
Among other queries, Question 2 asks:
“What information related to climate risks can be quantified and measured?”
That is the foundational question. ESG and climate activists believe corporations should be required to report the magnitude and probability of the financial losses they could incur due to the physical impacts of climate change. They also want companies, especially fossil-fuel companies, to report their “transition” and “liability” risks—the losses they may incur as climate policies devalue and strand their assets and courts compel them to pay compensation to climate change victims.
However, objective quantification and measurement of such risks is often impossible. Climate risk assessments typically depend on multiple assumptions fraught with uncertainties. Speculative risk guestimates are of little financial value to investors.
Boston University professor Madison Condon’s “Market Myopia’s Climate Bubble” (MMCB), a recent influential paper advocating mandatory disclosure and quantification of climate change risks, describes some of the epistemological challenges:
Evaluating climate risk involves forecasting macroeconomic energy demand, guessing on the success of carbon regulation and future technologies, modeling the relationship between atmospheric gas concentrations and global temperatures, predicting how temperature rise will change the earth’s climate systems, and calculating how those changes impact physical economic assets. The task requires skills beyond that of a typical financial analyst, colossal amounts of data, and models that have only begun to be built. Each step of estimation adds layers of uncertainty to risk projections. In some cases, particularly those longer-term and macroeconomic, the estimation of the economic impact of climate change may be dwarfed by this uncertainty.[ii]
Another level of uncertainty arises from the vagaries of politics and litigation: “No amount of regulatory or corporate governance intervention can give shareholders and managers the ability to foresee the future—the outcomes of national elections, for example, are both largely uncertain and hugely influential in determining the strength of future climate policy.”[iii]
MMCB therefore cautions against an “overemphasis on false precision provided by complicated models.” The author prefers the use of “fine-grained asset-level” analysis focused “on climate risks at the scale of individual corporations and investors and their horizons.” She suggests companies should at least be able to report on the “climate-related impacts we have already been experiencing.”[iv]
In practice, however, it is often hard to distinguish what component of current risks is due to climate change rather than just plain old climate. Even when assessing current impacts, speculative modeling often comes into play. Consider Lights Out: Climate Change Risk to Internet Infrastructure,[v] the featured study in MMCB’s introduction. MMCB summarizes:
In 2016, a duo of computer scientists undertook the laborious task of creating a map of U.S. Internet infrastructure, indicating where cable was laid and where colocation centers were based. . . When one of the researchers showed the results of his work to his wife, a climate scientist, she immediately remarked that much of the infrastructure was located in coastal regions at risk to be inundated by sea-level rise as soon as the coming decade. All three scientists then worked together, publishing a study showing that thousands of miles of fiber optic cable, and more than a thousand nodes of key Internet infrastructure, could be underwater in the next 15 years.[vi]
In an allusion to Lights Out a few pages later, MMCB criticizes “the continued neglect of assessing companies’ exposure to foreseeable climate risks,” describing “global sea-level rise over the next 15 years” as a phenomenon that “can be predicted with some certainty.”[vii]
In fact, Lights Out is a cautionary tale of how dubious climate risk analysis can be. The study is explicitly based on a long-term (2018-2100) sea-level rise projection, and not just any projection but the “highest”—i.e. “most extreme.” The study assumes sea levels will rise 6 feet by 2100 and 1 foot by 2030:
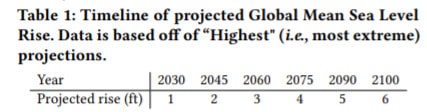
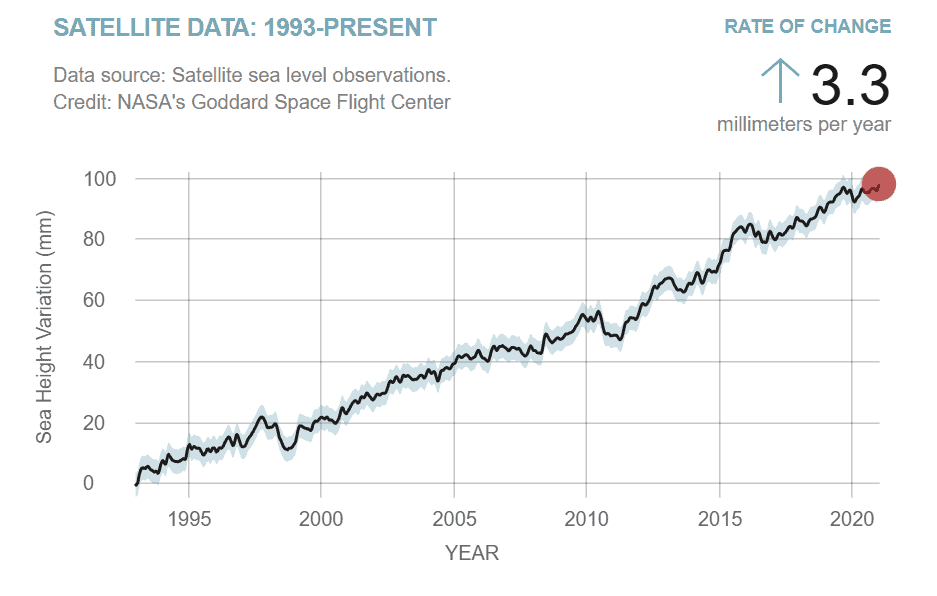
Global mean sea-levels have risen 8-9 inches (21-24 centimeters) since 1880.[viii] The Internet infrastructure risks forecast in Lights Out materialize only if there is almost twice as much sea-level rise during 2018-2030 as there was in the preceding 138 years. The current annual rate of global mean sea-level rise is 3.3 millimeters, according to the National Aeronautics and Space Administration (NASA).[ix] Lights Out assumes a 15-year rate of about 20.3 mm/year—more than six times faster.
The lesson here is the need for due diligence before citing climate impact assessments. Lights Out sources its “extreme” sea-level rise projection to “a collection of projected sea level rise scenarios, flood exposures, and affected coastal counties, and is amassed from a number of partner organizations.” However, the accompanying footnote takes us not to sea-level rise scenarios, models, or data but to the Web sites of 827 partner organizations.[x] The study is literally non-auditable.
Despite the plea for “fine grained” analysis, nearly all assessments of the physical risks of climate change rely on speculative models and emission scenarios.
Overview
The remainder of the comment letter develops the following points. Advocates of climate risk disclosure:
- Favor assessments based on warm-biased models run with warm-biased emission scenarios.
- Often attribute to climate change damages that chiefly reflect societal factors such as increases in population and exposed wealth.
- Overlook the increasing sustainability of our chiefly fossil-fueled civilization.
- Assume away the power of adaptation to mitigate climate change damages.
- Misbrand efforts to decapitalize companies as “protecting shareholder value.”
- Ignore the vast potential of climate policies to destroy jobs, growth, and, thus, shareholder value.
- Downplay the economic, environmental, and geopolitical risks of mandating a transition from a fuel-intensive to a material-intensive energy system.
- Downplay the regulatory impediments to building a “clean energy economy.”
- Ignore what may become the biggest transition risk—the creation of a mandate- and subsidy-fueled “clean energy” bubble.
Warm-Biased Risk Assessments
In all model-based climate change assessments, the potential magnitude of the risks depends chiefly on two variables—the model’s estimate of climate sensitivity and the forcing trajectory (emissions scenario) with which the model is run.
Climate sensitivity is typically defined as the rise in global mean annual temperature after the climate system fully adjusts to a doubling of atmospheric carbon dioxide-equivalent (CO2e) greenhouse gas (GHG) concentration. Radiative forcing is the difference, measured in watts per square meter (W/m2), between the amount of incoming shortwave solar radiation and the amount of outgoing longwave infrared radiation.
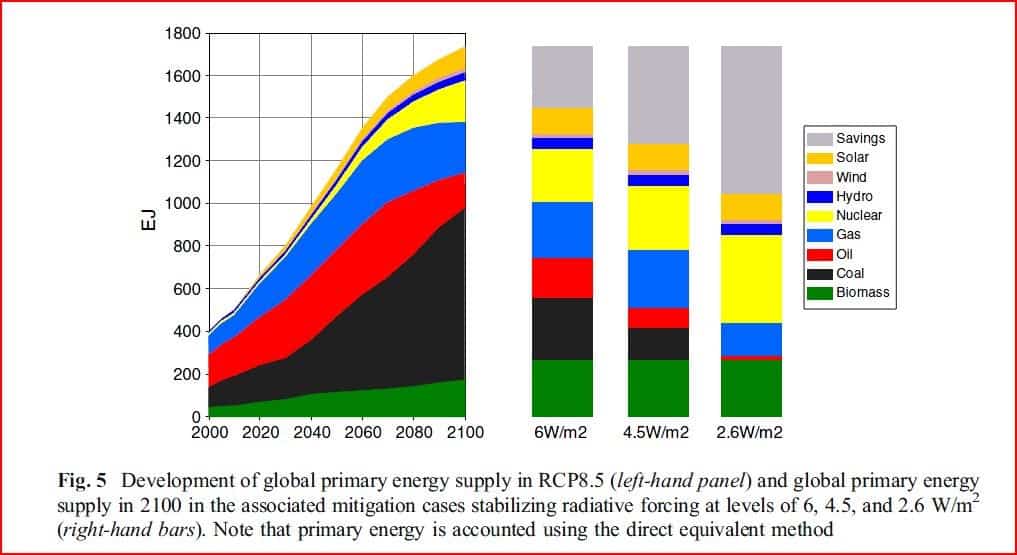
For its Fifth Assessment Report (AR5), the U.N. Intergovernmental Panel on Climate Change (IPCC) used an ensemble of models called CMIP5.[xi] The IPCC ran the models with four representative concentration pathways (RCPs), which plot changes in emissions, concentrations, and forcing from 2000 to 2100. RCPs are called “representative” because each forcing trajectory corresponds to at least some published socio-economic development scenarios. From coolest to hottest, the four pathways are RPC2.6, RPC4.5, RPC6.0, and RCP8.5, each numbered for its W/m2 forcing.
In such analyses, the big-scary warming projections and associated physical impacts come from running CMIP5 (or models estimating similar or higher sensitivity) with RCP8.5.[xii] This methodology is doubly biased towards high-end warming and climate damage projections.
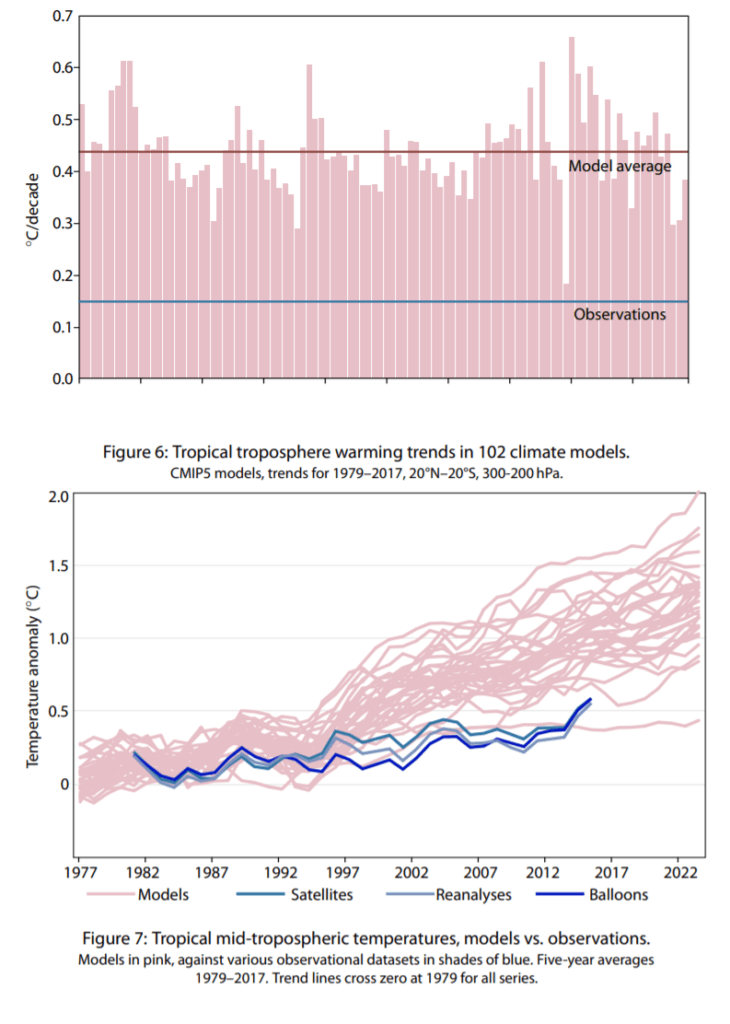
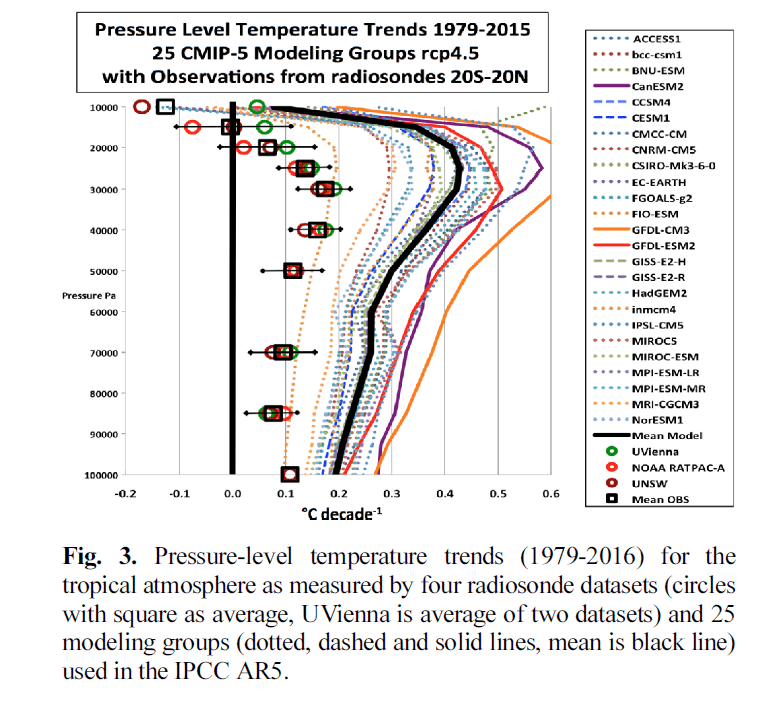
On average, CMIP5 models hindcast a warming rate of 0.44°C per decade in the tropical mid-troposphere since 1979. The average observed warming rate from satellites, weather balloons, and re-analyses[xiii] is 0.15°C per decade—roughly one third the model average.[xiv]
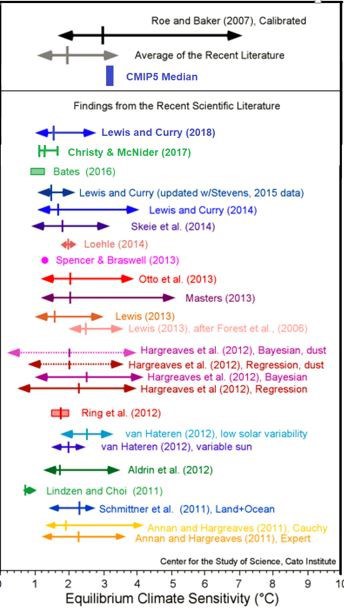
A reasonable inference is that most CMIP5 models overestimate climate sensitivity and project too much warming from whatever emission scenario is fed into the models. The following chart[xv] compares the sensitivity estimates of 24 empirically-constrained studies[xvi] with the climate sensitivity probability distribution (Roe-Baker 2007) used by federal agencies to estimate the social cost of carbon dioxide[xvii] and the CMIP5 mean climate sensitivity. The average sensitivity in the 24 studies (2°C) is 37.5 percent lower than the average in CMIP5 (3.2°C). Or, conversely, the CMIP5 mean sensitivity is 60 percent higher than the mean of the 24 studies.
Although often described as a “business-as-usual” scenario, RCP8.5 is actually a high-emission, worst-case scenario.[xviii] For RCP8.5 to be a realistic projection of future CO2 emissions and concentrations, coal consumption would have to increase approximately tenfold during 2000-2100,[xix] achieving market shares not seen since the 1940s.[xx] There is no evidence the world is on the verge of a “return to coal.”[xxi]
This dubious methodology taints many climate risk exposure analyses, even those with a granular, asset-specific focus. One such study, cited in MMCB, examines the impact of climate change on the structural integrity of aging U.S. bridges.[xxii]
The study reports that four of ten highway bridges in the National Bridge Inventory (NBI) “are 50 years or older, reaching or even exceeding their design life,” and that 54,560 bridges (about 9 percent of the total NBI) are considered structurally deficient. Incidentally, this is clearly not a study of climate impacts already experienced. The study identifies only two highway bridge collapses in the past 60 years (the Silver Bridge over the Ohio River in 1967 and the Mianus River Bridge in Connecticut in 1983), and authors do not hypothesize that climate change was the straw that broke the camel’s back.
Nonetheless, the unsafe condition of many bridges is widely accepted and weather obviously affects the long-term structural integrity of infrastructure. To most people, that means we have an aging bridge problem. However, the bridge study presents it as a climate change problem, and MMCB presents it as a climate risk disclosure problem.
To determine the potential impact of global warming on the expansion joints connecting bridge spans, the authors ran RCP2.6, RCP6.0, and RCP8.5 with the Geophysical Fluid Dynamics Laboratory GFDL-CM3 model. By sheer coincidence, GFDL-CM3 is among the most sensitive of the CMIP5 models.
The chart below shows the divergence of model projections and observations through the depth of the tropical atmosphere during 1979-2016. The GFDL-CM3 projection is the warmest and least accurate.[xxiii]
The bridge study, which projects the thermal stress on expansion joints under the three RCPs in 2040, 2060, 2080, and 2100, argues that such research can help decisionmakers “prioritize the allocation of funds for maintenance and replacement.” MMCB takes it a step further, suggesting that such information is important to investors generally: “The businesses (and their shareholders) whose supply chains rely on these bridges are likely unaware of their heightened risk exposure.”[xxiv]
However, such granular information would appear to be of more interest to companies that build and repair bridges than to shareholders of the vast number and variety of companies that ship goods via the U.S. highway system. Moreover, on-site inspections would seem to be a more accurate way to determine bridge construction priorities than extrapolations from an overheated climate model.
BlackRock’s influential April 2019 report, “Getting Physical: Scenario Analysis for Assessing Climate-Related Risk,” also pairs hot models with RCP8.5.[xxv] BlackRock’s modeling was done by the Rhodium Group,[xxvi] who supplemented CMIP5 with “simple climate models” designed to capture “tail risk.” The effect is to increase the probability of warming projections beyond the CMIP5 “likely” range. Rhodium explains:
The CMIP5 models substantially underestimate the 95th-percentile projections from the probabilistic methods. We find that by the end of the twenty-first century there is a 5 percent chance that annual CONUS temperature change could be as high as ~8°C over 1981–2010 levels—roughly 1°C warmer than the hottest CMIP5 model projection (RCP 8.5).[xxvii]
For perspective, the warming rate of the global lower troposphere since January 1979 has been 0.14°C per decade,[xxviii] which implies an additional 1.1°C rise in global mean temperature by 2100—seven times less than Rhodium’s 8°C scenario. Although the observed warming rate may increase, there has been no acceleration over the past four decades. Somehow that never factors into climate impact projections.
Click here to read full comments.