Reforming Surface Transportation for Long-Term Sustainability
How Restructuring Federal Highway Funding Can Prepare us for Future Transportation Challenges
EXECUTIVE SUMMARY
When policy makers are asked to assess the condition of highway infrastructure, their responses tend to break between calls for greater funding or for halting new route construction to first make repairs. Currently in the United States, 7 percent of bridges are structurally deficient, and 19 percent of major highway pavements have deteriorated. Yet, our existing financing structure has few tools to address the looming reconstruction challenges facing existing infrastructure. Meanwhile, the last large surge of federal “stimulus”-backed repair funding from the American Recovery and Reinvestment Act of 2009 largely went to simple pavement surface mill-and-fill projects that will soon need to be replaced from the ground up. Congress needs to address the inadequacy of existing legacy programs and answer the question of how to support economic growth while conserving existing infrastructure.
In the United States, infrastructure investment occurs through a variety of methods, a situation that leads to confusion when one tries to compare results. The most common method is a publicly leveraged investment, where taxes are collected on the use of a broad base of resources and then devoted to competitive federal programs to finance certain projects selected on economic rankings.
The Interstate Highway System is financially leveraged in this manner through the collection of excise taxes on motor fuel, which is largely burned while driving on surface streets that are funded primarily through local property taxes.
Shareholder-led investments—for which revenues must pay financial operating costs and eventually a shareholder return—are now the default method of building and maintaining mainline railroads and utilities.
Hybrid investments, such as public–private partnerships, involve shareholders buying into a defined leveraged public financial investment along with design, innovation, construction, and some operating risk before earning a return, such as through a toll road concession.
For more than a decade, the federal Highway Trust Fund has disbursed outlays in excess of dedicated fuel tax and other user tax revenue, leading to a cumulative $141 billion taxpayer-funded bailout by Congress, paid with general revenue funds even after leveraging. This increasingly unsustainable status quo threatens the long-term maintenance of the national highway network going forward, especially given the uncertain long-term viability of highway funding dominated by fuel tax revenue in a possible future of partial electrification of the nation’s vehicle fleet.
This paper estimates a long-run average cost of the U.S. Interstate Highway System using six decades of historical financial records. It then nets out the marginal revenue collected for system use. At some level, a cost and revenue gap often leads to a tragedy of the commons in which no one exercises effective ownership. This outcome has resulted in unreliability and deficient conditions from the lack of a pricing feedback loop.
To provide actionable recommendations for federal policy, this paper analyzes how projects could be throttled for true resource efficiency in contexts from rural intercity travel to urban daily commuting. The recommendations suggest a middle ground between greater general fund spending and new widespread tolls in a political environment built on expectations of public subsidy.
For rural intercity travel, a foundational federal program for infrastructure investment could support nationally significant projects. A “shadow toll” is considered at a level roughly analogous to the current funding gap by person-mile or freight container-mile, after which statelevel sponsorship should advance a project to completion.
Most rural facilities are facing unfunded long-term needs because the current level of incremental tax receipts is barely enough to support periodic maintenance, let alone expansions.
As noted, the overarching goals of federal transportation infrastructure policy should be to promote interstate commerce and to prioritize existing infrastructure asset maintenance over new construction. Federal investments should be structured in a way that proposals for new intercity facilities can be tested by specific metrics, so that only truly nationally significant facilities of reasonable size are built to support the nation’s expanding population and economy.
For urban travel, limits should be placed on the relevant federal programs so that person-trips become the metric of public investment across all transportation modes. This approach would allow for greater local governance and funding to guide these programs while preventing local markets from being overwhelmed by federal subsidies.
Many larger urban facilities support a mix of intercity and local travel, so some consideration should be given to both of these functions. Resilient and responsive local governance through local tax revenue that largely supports local transportation can result in local projects that add value to the regions they serve.
INTRODUCTION
When policy makers are asked to assess the condition of highway infrastructure, their responses tend to break between calls for greater funding or for halting new route construction to first make repairs. Currently in the United States, 7 percent of bridges are structurally deficient, and 19 percent of major highway pavements have deteriorated.1 Yet, our existing financing structure has few tools to address the looming reconstruction challenges facing existing infrastructure. Meanwhile, the last large surge of federal “stimulus”-backed repair funding from the American Recovery and Reinvestment Act of 2009 largely went to simple pavement surface mill-and-fill projects that will soon need to be replaced from the ground up. Congress must address the inadequacy of existing legacy programs and answer the question of how to support economic growth while conserving existing infrastructure.
In the United States, infrastructure investment occurs through a variety of methods, a situation that leads to confusion when one tries to compare results. The most common method is a publicly leveraged investment, where taxes are collected on the use of a broad base of resources and are then devoted to competitive federal programs to finance certain projects selected on economic rankings.
The Interstate Highway System is financially leveraged in this manner through the collection of excise taxes on motor fuel that is largely consumed while driving on surface streets, which are funded primarily through local property taxes. This mismatch—that fuel tax revenue to support the Interstate System is largely generated through non-Interstate road use—is expressed as the “quant” in this paper. At the onset of the Interstate System, the economic rankings were stretched by planners to show financial justification for these projects.2 They now most commonly value net in-vehicle time savings, a hypothetical decrease in travel time from increases in speed over current conditions that is monetized at a level near the nationwide average wage rate.3 (See Figure 1)
The other methods deserve study in the context of the broader economy. Shareholder-led investments—for which revenues must pay financial operating costs and eventually a shareholder return—are now the default method of building and maintaining mainline railroads and utilities. Hybrid investments, such as public–private partnerships (P3s), involve shareholders buying into a defined leveraged public financial investment along with design, innovation, construction, and some operating risk before earning a return, such as through a toll road concession.
The federal role in transportation will be debated as the Fixing America’s Surface Transportation Act (known as FAST Act) expires on September 30, 2021. For more than a decade, the federal Highway Trust Fund has disbursed outlays in excess of dedicated fuel tax and other user tax revenue, leading to a cumulative $141 billion taxpayer-funded bailout by Congress, paid with general revenue funds even after leveraging.4 This increasingly unsustainable status quo threatens the long-term maintenance of the national highway network going forward, especially given the uncertain long-term viability of highway funding dominated by fuel tax revenue in a potential future of a partial electrification of the nation’s vehicle fleet.5
Given these challenges, can we return to a marketplace that values incremental infrastructure improvements, respects local governance, balances rural and urban access (although rural segments tend to be more subsidized), and enables personal wealth creation while fixing the trust fund cliff?
To answer this question and determine the most efficient use of funding for safety improvements, policy makers should strive to:
ʺNormalize infrastructure investment to find a missing financial metric, or “quant,” per intercity traveled person-mile and freight container-mile, as well as urban daily person-trip; and
ʺAdjust the long-held economic models for vehicle time saved that are used to select projects to conform to actual consumer time-utility values supported at marketplace rates.
Figure 1. Historical chart of mileage by road type, locally financed roads and leveraged highway
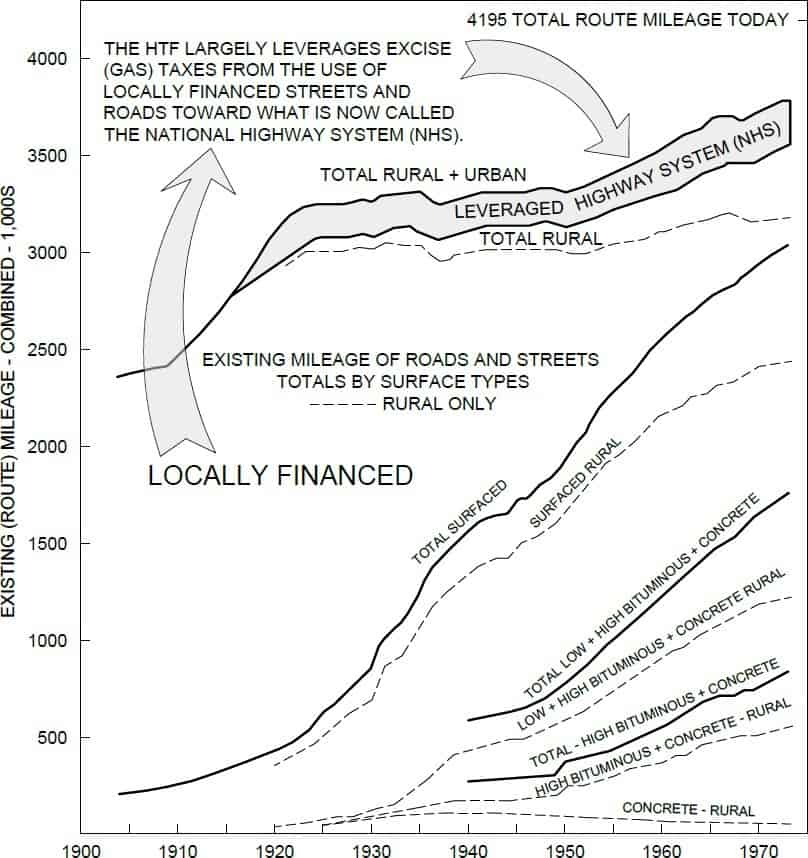
Source: Federal Highway Administration, Office of Highway Policy Information, accessed in 2019 and digitized to show history.
PROPER ROLES FOR FINANCIAL AND ECONOMIC METRICS IN PLANNING
This incremental gap has existed for decades and has created major problems that have only compounded over time. Federal highway funding draws from a bucket of fuel excise taxes collected in the use of a broad base of urban and rural surface streets, which are largely supported by local private property taxes. Oddly, all roads—including neighborhood lanes, city streets, and county roads—are often termed “highways” by the Federal Highway Administration (FHWA) in analysis documents.6 (This might be a way to sidestep the problem noted by Nobel Prize–winning economist Milton Freidman, who lamented the redirection of fuel tax revenue on fuel consumed on city streets as economically inefficient.)7
Initially, federal fuel tax revenue was heavily weighted toward new Interstate routes and largely concentrated within the Interstate Highway System.8 Now many off-system projects are partially federally funded. This leveraging of the Highway Trust Fund is akin to taxing food purchases at all cafés, coffeehouses, convenience stores, grocery stores, and restaurants to build a new restaurant, offering an inexpensive buffet, while only painting the walls at the other existing businesses. Such a scheme could obliquely be called a “food user fee” for “food infrastructure,” just as today’s surface transportation system terms “highway user fees” for “highway infrastructure.”
This leveraging of funds to certain types of projects blatantly distorts the market. The fuel tax, like all excise taxes, is largely a diversion of wealth. The daily unavoidable use of streets and roads, paid for by property and other local taxes, generates a sizable portion of fuel tax revenue de-
posited into the Highway Trust Fund. Certainly, Interstate highways are needed, but so are other forms of transportation or perhaps different ways of arranging sites, buildings, or manufacturing processes. The question the quant seeks to answer is what stabilizing metric can be used as funding increasingly shifts toward general revenue.
This disconnect seems to have arisen because most prior proposals for what became the nationwide Interstate Highway System could not have been supported by tolls,9 nor can many rural intercity routes be now.10 However, the Depression-era highways’ dismal safety and efficiency problems had to be dealt with politically, as they were not marginally priced to reflect usage and thus had become congested. The need for a more nuanced approach had become evident around the time of the 1956 bill that ultimately created the Interstate Highway System. President Dwight D. Eisenhower had called for the Interstate highways to be “self-liquidating … through the assured increase in gas taxes,”11 but he was also concerned that plans for the system called for highways running through central cities to be facilitated by large-scale private property condemnations and clearances.12 In this political environment, he appointed General John Stewart Bragdon to lead a study committee on urban highways and what we might now call land-use and mobility planning.13
In looking at the system’s performance as a whole, the Bragdon Committee projected that urban congestion and a nonfunctional land and transportation marketplace would result in the absence of marginal toll pricing and a consideration of all transportation modes. Unfortunately, that foresight was never fully appreciated at the time. Even so, Bureau of Public Roads Administrator Bertram Tallamy agreed at the time that running untolled Interstate highways into and through cities “is not designed to solve all principal highway traffic problems of cities and metropolitan areas.” However, the policy of not tolling urban Interstates was followed nearly exclusively at first.14
Ultimately, the bureau’s 1961 report to Congress on highway cost allocation—issued after the stunted end of the
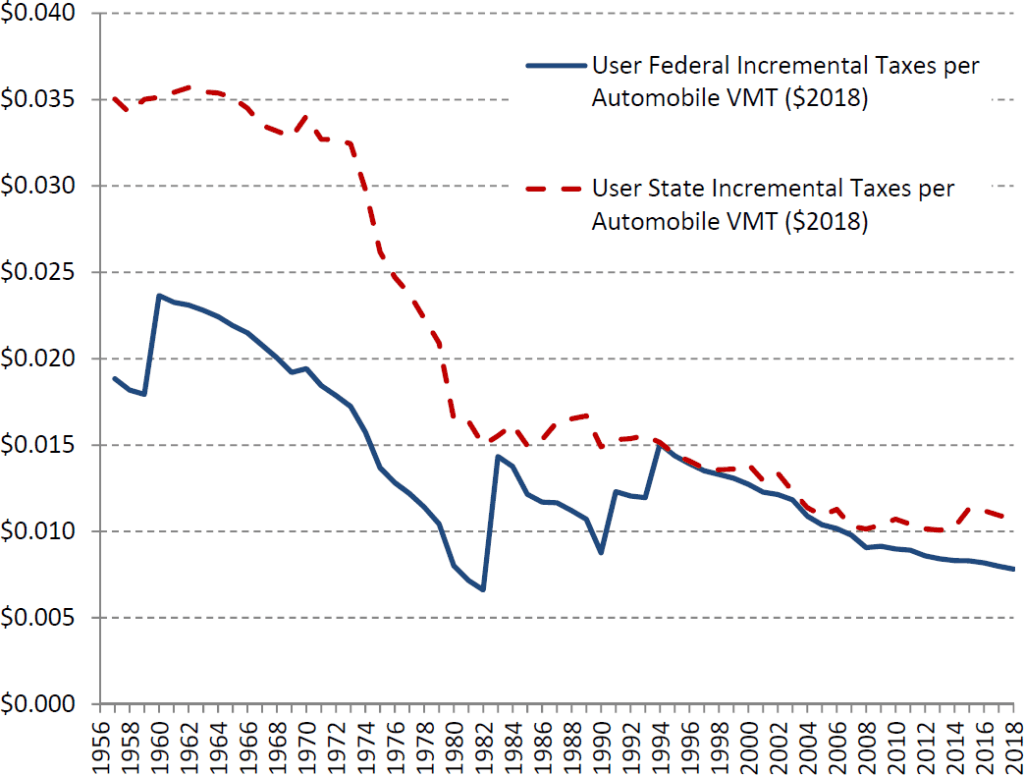
Figure 2. Real marginal revenue (excise tax) per vehicle-mile traveled (VMT) has declined markedly
Bragdon Committee—steered clear of considering the question of the true average financial cost of the new Interstate highways, likely because of the knowledge that tolls could not fund the system.15 Instead, the report was a complicated economics benefit-based argument, with costs of various vehicle classes expressed only as relative percentages of all taxes collected on the larger existing road system. Thus, Congress, by uncritically accepting the recommendations in the bureau’s report, enshrined a type of leveraging for new highway funding that appears to be sustainable only for the first few decades.
DECREASING REAL FINANCIAL REVENUE: EFFECTS OF INFLATION AND CHANGES IN HIGHWAY MILES PER GALLON
With the Interstate Highway System in need of rebuilding, the funds generated by the leveraged fuel excise taxes are far below what is needed to fund reconstruction costs on an incremental basis. Some of this shortage is a result of disagreements over the use of federal and state-level trust fund monies, specifically regarding the efficiency of the work, over the degree to which these taxes should be raised, and over the types of projects to fund. (See Figure 2)
The consensus broke down around the time of the 1970s energy crises, after which stagflation and the increasing demand for fuel efficiency led to significant declines in real tax revenues collected per vehicle-mile traveled (VMT). Current federal and state-level trust fund revenue is less than even the accident costs not directly borne by users. Instead, serious accident costs are supported by various government programs or private health care providers. Should this effect be netted out, then the trust fund would incur negative marginal revenue for each person-mile traveled even before considering any road construction and rebuilding costs.
Another problem associated with this now longstanding expectation of low revenue per mile is the difficulty in funding reconstruction of complicated urban projects. For instance, trying to get back to the early 1980s’ level of federal tax receipts would require almost doubling the per-gallon fuel tax rate because of mile-per-gallon gains, a politically difficult option.
When one studies the projects funded by the federal Highway Trust Fund, most are low-hanging fruit. The majority of capacity bottlenecks and interchanges are simply patched up, because financial resources are insufficient to fund large-scale repair projects. Some large projects in the pipeline have advanced with construction partially funded by bonds to be paid from future tax revenue, but other projects have no clear funding path, as a long-run analysis has been hindered by the lack of a national plan. For this reason, public messaging should strive to explain that expensive highway infrastructure was installed in the past and now needs to be conserved. This efficient conservation can be achieved through pricing in urban environments, where little expansion is economically possible because private property would have to be fully condemned. At the same time, budgets for intercity projects around the nation should be set using financial traveled-mile metrics as a throttle mechanism.
INTERSTATE CASH-FLOW ANALYSIS: BELOW-THE-ROAD LONG-RUN AVERAGE COST AND PUBLIC INTERSTATE INVESTMENT
To determine this financial quant, we used six decades of Federal Highway Administration records with separate tabulations for Interstate highway costs.16 The resulting Interstate cash-flow analysis considers calculated marginal revenue from taxes on fuel expended between onand off-ramps and prorated charges against the cost of construction, rebuilding, and accident financial costs not borne by users (but did not include highway program administrative overhead) to establish a long-run average cost where capital is variable. To calculate the net present value of the gap between revenue and costs, we compared the marginal revenue stream with these costs in a time series going back to 1956, under historical interest rates corresponding to the differing project investment methods.
We chose the AAA corporate bond rate estimate as the comparison rate because it most closely resembles the financing package that P3s might experience for a stable project with sufficient public backing of the up-front costs. As such, it sits between the private shareholder weighted average cost of capital and the government borrowing effective interest rate.
The quant is the difference between marginal revenue and long-run average costs, and thus it can serve as a nationwide metric for the background level of public investment above incremental user revenue. The purpose of establishing the quant is to help policy makers steer infrastructure funding toward where it is most needed. This calculation is backward-looking and likely subject to a plus or minus 30 percent uncertainty, as rural mileage classifications have changed. We have attempted to assign costs for urban route mileage at three times the rural mileage cost for the original construction, which took advantage of now-illegal relocation practices to clear the urban highway rights of way.17
Urban highway rebuilding costs today are many times this estimate for the original Interstate system. One reason is that it is difficult to build under traffic as further expansions will now consume expensive urban land, since many rights of ways are fully built out after previous expansions. Our analysis shows the backward-looking, hard-dollar, leveraged Interstate highway investment to 2018 to be $0.109 per rural automobile VMT, funded by taxing the sale of motor fuel consumed on the relatively unchanging use of locally financed streets, with the tax revenue narrowly directed toward highway projects (Table 1).
The quant considers the leveraged support for highways from taxing the use of the privately installed local roadway base, the costs of which are not considered in federal figures. However, zoning ordinances often require developers and owners to fund both these unpriced local roads and parking. The costs—along with the leveraged support from taxing the use of streets funded by local property taxes—are all passed through to consumers.18
Table 1. Summary of Interstate Cash-Flow Analysis—Interest Rates Corresponding to Ownership Method
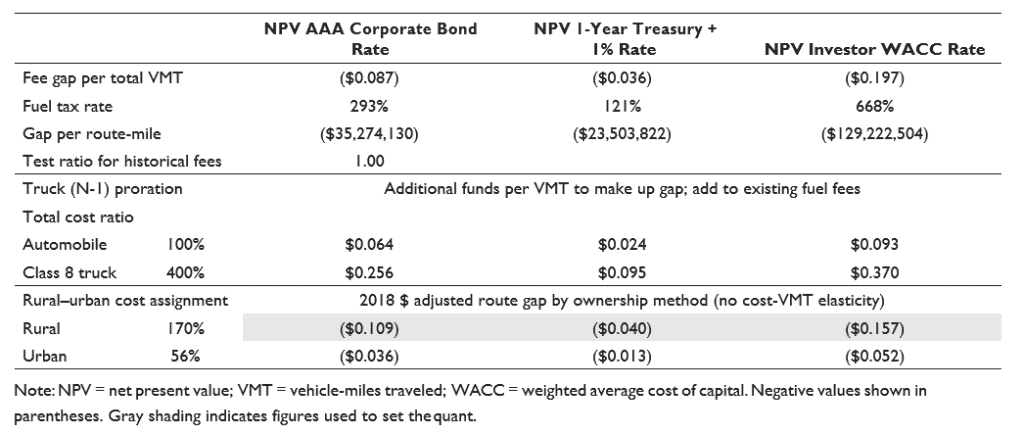
The adjusted route gap of $0.109 per VMT is the amount estimated to come from taxes outside the ramps of the Interstate system. This is the financially leveraged amount the quant attempts to isolate. To back-check, consider that research sponsored by the Texas Department of Transportation recommended a minimum test toll of $0.12 per automobile vehicle-mile in 2004 ($0.16 per vehicle-mile in 2018 dollars) for revenue and traffic studies to see if tolling could pay for conceptual projects.19 Marginal fuel tax revenue generated on untolled new highways was found to equal only about 10 percent to 20 percent of the construction and maintenance costs net of vehicle registration taxes that do not vary with VMT.20 However, many toll road projects cannot charge this amount, as it would result in little traffic. Instead, they now only charge what can be borne by the marketplace and floated with low-interest loans, before dipping into the trust fund for the rest. While many of these are high-occupancy toll lanes, the policy challenge lies in the current inability of politically acceptable tolls or gas taxes to fund the full costs of many facilities.
FROM A VEHICLE-MILES TRAVELED INCREMENTAL FUNDING GAP TO THE QUANT
A state department of transportation might consider this route gap per automobile VMT as a “shadow toll” or “pass-through toll” to advocate for steady highway funding in its budgets, as well as to revise practices to consider lower life-cycle costs, given that financial responsibility ends at the road surface.21 However, different activities will have differing accident costs related to the quality of the built item or, in this case, the condition and design of the infrastructure. Governments should consider the broader financial costs by intercity person-mile or urban person-trip of unpaid accidents, particularly when infrastructure design affects accident rates or travel behavior.
The distinction between an accident’s financial cost, such as unpaid bills covered by federal programs, and economic costs, such as forgone future wages, should be made to explore budgetary changes across various government agencies.
Financial costs of accidents borne by the public (which are explored below) are included at a rate of $0.025 per vehicle-mile with the infrastructure gap, for an equivalent $0.134 per vehicle-mile gap of long-run average costs above marginal revenue. To convert this to a person-mile equivalent, we used the same 1.39 average automobile occupancy that the U.S. Department of Transportation uses for longer trips to find the estimated quant of $0.096 per intercity person-mile for ground infrastructure throughout the broader United States. Newly constructed Interstate-type projects far exceed the original system’s average investment rate, so the quant is merely meant to be a starting point for a life-cycle cost estimate that can provide a realistic reference.
Economic costs of accidents should be included only within a reformed economic benefit–cost analysis that ranks projects by their broader societal effects to explore the correct level of general tax spending. This economic check is done imperfectly in current benefit–cost calculations because safety benefits are typically overwhelmed in the analysis when the value of travel time savings (VTTS) is set too high—far above what willingness to pay in revealed preference studies indicates from toll transactions made to avoid immediate slower travel conditions.22 This problematic feedback loop leads designers to chase higher street design speeds, often decreasing safety. This situation can be corrected as detailed in the time-utility section of this paper.
In short, if we acknowledge that financial leveraging exists, the question of how to steer project design could be solved by doing the following:
ʺ Split away financial methods so they only justify the hard-dollar costs of infrastructure investment backed by the quant, which includes accident costs borne by other budgets; and
ʺ Reform economic methods to examine only societal benefits of safety and determine the resulting consumer use related to the particular qualities of the transportation infrastructure or service.
Such an approach would constitute a significant departure from the current messaging of user fees covering total costs.
PUBLIC ACCIDENT FINANCIAL AND ECONOMIC COSTS: HIGHWAY OPERATING COSTS AT THE ROAD SURFACE
There is a public operating cost for the Interstate Highway System, as several federal programs assume some financial responsibility for the cost of major accidents that can bankrupt individuals, as well as minor crashes. This distinction is periodically analyzed by the U.S. National Highway Traffic Safety Administration as vehicle technology improves, most recently in 2010.23 From this report, accident costs requiring financial payment would be $277 billion for 2,957 billion vehicle-miles on all roads, resulting in $0.094 per vehicle-mile. Of this amount, federal and state authorities and others pay an estimated 23 percent, or $0.022 per vehicle-mile (excluding the value of life at courtroom levels of compensatory values of life). However, that analysis disregards that medical and life insurance, not automobile insurance, is the source of most insurer payouts for accidents. This arrangement effectively leverages this cost onto a larger population—including nondrivers—with no incremental cost feedback. Perhaps up to $0.035 per vehicle-mile is the real cash loss. However, to avoid overemphasis of the effect of using non-automobile insurance as it is estimated, a value of $0.025 per vehicle-mile is used for the quant determination, higher still than fuel taxes. (See Table 2)
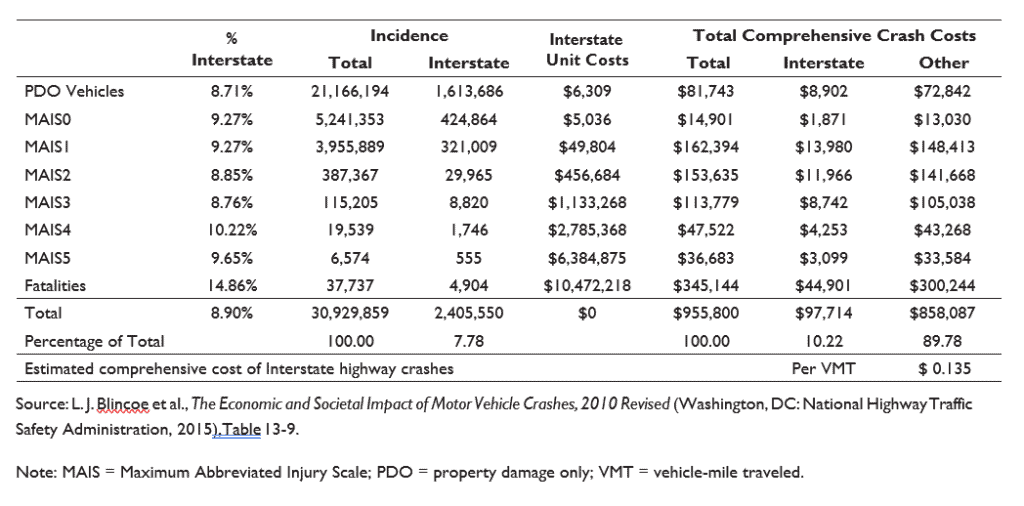
However, the quant metric does not count the substantial accident savings accruing to persons who choose not to drive, drive less, telecommute, or use ridesharing and common carrier travel. Instead, it covers just the financial costs not directly covered by the user that eventually appear in other budgets. The otherwise uncompensated total economic value of lifetime losses from accidents and lost wages is equal to $0.135 per automobile vehicle-mile (see Table 3).
Only common carriers, such as air, motor coach, rail (at much lower rates of occurrence), and ride-hail providers—known as Mobility as a Service, or MaaS, providers in public policy jargon—must assume this financial risk when they sell a ticket. Clearly, Congress and federal agencies—specifically the Department of Transportation—should advance programs supporting safer common carrier ground transportation where possible, and, when provided comfortably, for trip distances in the 200 to 1,000-mile range. Such a distance makes travel by common carrier a feasible alternative to long-distance highway travel but is typically too short for economical commercial air travel.
Table 2. Source of Payment by Cost Category, Millions of 2018 Dollars
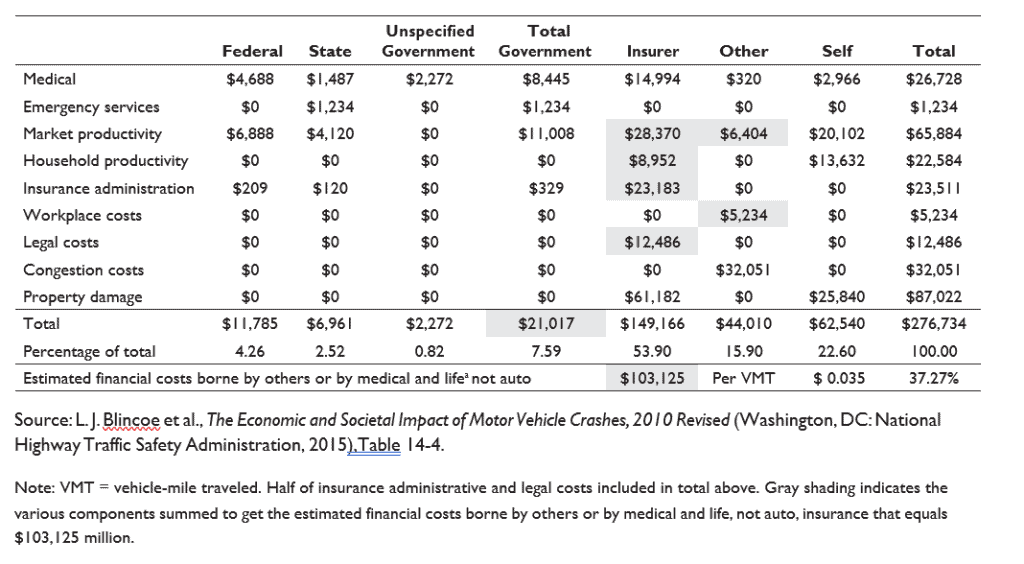
Table 3. Comprehensive Cost of Interstate Highway Crashes, Millions of 2018 Dollars
FUTURE INTERSTATE HIGHWAY INVESTMENT NEEDS PROJECTED TO INCREASE GREATLY TO CATCH UP
A 2019 National Academy of Sciences study on the future needs of the Interstate Highway System highlights the looming crisis. Even after the beneficial leveraging arrangement and $141 billion in additional investment from general funds over the past decade, the Interstate Highway System is still falling behind in its ability to provide today’s level of service into the future. The study estimates an additional $36 billion annually in investment will be needed over 20 years just to meet population growth levels of additional travel (although around half of the vehicle-miles traveled on the system are daily commuter trips, not long-distance interstate trips, and should be viewed as similar to transit programs).24
This study also demonstrates that future Interstate highway congestion will spread beyond urban corridors, stretching far into rural areas, particularly on routes favored by heavy commercial vehicles. A realistic 20-year plan should consider citizens’ ability to choose different options to long-distance driving to escape these conditions. These investments, based on the findings of the future needs study, would increase the historical highway revenue gap quant to 13 cents per intercity person-mile.
PRE-INTERSTATE ACT LEGACY TOLL HIGHWAYS: NOW LARGELY HYBRID FINANCED FACILITIES
For some time, a hybrid financial structure will likely be needed in certain parts of the country, for reasons outlined below. States were reimbursed for some of the original construction costs and future capital maintenance on the pre-1956 legacy toll routes through the disbursements authorized under the 1991 surface transportation reauthorization, as part of the cost-sharing premise of that law.25
The legacy toll routes are in effect now operating as hybrid financed facilities, as they have received leveraged trust fund monies while still collecting direct consumer tolls. The Pennsylvania Turnpike—the earliest facility of the main east–west chain cutting through the mountains— has always been a hybrid facility. The project has benefited from direct grants of 40 percent of costs through Depression-era funding, as well as government assumption of risk on the remaining bonds.26 The Oklahoma toll roads are hybrids as well, benefiting from urban sections built with Highway Trust Fund support that covers the now higher-cost urban segments. Those toll roads act to funnel traffic onto the rural segments.
Today, the rates for shorter-distance automobile trips might hit $0.26 per mile for a trip of just 10 miles on the pre-1956 legacy toll highways, such as the Indiana Toll Road, while the rates for much longer trips average around $0.07 per mile over the same road segment and are nearly universal across the nation.27 The quant effect appears to depress the market rate for a longer trip, as one might be able to shift to a “free” parallel road supported only by leveraged trust fund monies with a relatively small time penalty. This effect, known as diversion from toll facilities, is influenced by the adjacent highways’ relative capacity and speed.
The nationwide problem now is the inability of the Depression-era rural U.S. Routes that are adjacent to Interstate highways to handle the 10 to 20 percent of drivers who might choose to divert to a new route rather than pay a newly applied toll. Some prior proposals have suggested that new tolls could fund the rebuilding and some of the expansion of Interstate highways, while Highway Trust Fund monies continue to support Interstate segments that lack sufficient traffic to support toll finance.28 There are also near-term challenges related to traffic diverting from tolled Interstate highways to untolled routes. For example, on a rural Interstate segment with 30,000 daily vehicles, should 20 percent divert away from the tolled lanes, then 6,000 vehicles would be added to the adjacent two-lane highway, which might already carry 9,000 vehicles, overwhelming traffic lights at grade-level intersections during peak traffic times.
The concern that tolling a facility would keep more drivers on the more dangerous older rural highways was behind Bureau of Public Roads Commissioner Thomas
H. MacDonald’s resistance to tolling ahead of the Federal-Aid Highway Act of 1956, which created the Interstate Highway System. MacDonald argued that tolling a facility would keep more drivers on the more dangerous older rural highways.29 Perhaps a future mileage-based user fee could be employed on all existing routes to keep automobile diversions low, but it remains to be seen how a new value proposition could be developed to avoid the same political backlash that has been seen over fuel tax increases.
THE CONSTRUCTION INDUSTRY NEED NOT FEAR DISCARDING THE USER FEE LANGUAGE
Many in the construction industry are concerned that any shift from fuel taxes to general funds would weaken the primacy of funding priorities conveyed via user fees. However, significant challenges are arising regardless, as vehicles last longer, thus reducing local sales tax revenue, and partial electrification of the vehicle fleet threatens to dry up the federal revenue stream that remains mostly dependent on fuel tax collections.
Marginal revenue directed to the government for each extra mile driven is now less than one-eighth of the long-run average cost for building, rebuilding, and paying for accidents by parties other than drivers on the existing Interstate highways. Many new Interstate highway projects would require a gas tax rate 16 times greater but for the leverage.
That means the current lack of a feedback loop is digging us into a deeper hole, which could require pulling the throttle on expansions, albeit not halting them completely. At the same time, political deals to bail out the federal Highway Trust Fund with general funds from, say, repatriated taxes, may face resistance from both environmentalists and budget hawks in the absence of limits on what may be done with the funds. An expansion throttle may assist in reducing prescriptive environmental rules through the discipline of the marketplace, combined with a feedback loop that allows for only truly needed projects.
For those in the transportation construction industry, the quant could be a much-needed counter to our bailout-to-bailout era. It would justify an orderly nationwide prioritization of investment for both intercity limited-access highways and alternative modes outside congested urban regions, where past reform efforts have sought to impose moratoriums and exclusions.30
The quant would essentially be the starting value for a nationwide system of shadow tolls, or pass-through tolls, which would control how funding is distributed in future legislation, instead of relying only on political funding buckets. It would provide a metric to track the efficiency of both the project design as it relates to the geographic needs of the region and the project team’s execution.
It would apply equally to traditional design-bid-build projects by state transportation departments as well as more innovative project models ranging from design-build to P3 design-build-finance-operate-maintain project concessions. State agencies would have an initial lead with the institutional engineering knowledge necessary for maintaining our declining existing network and its established travel volume. Moreover, state transportation departments would not act as unchallengeable arbitrators in complicated urban projects that require expedited work and unique value-engineered approaches.
This approach could support various project structures and allow the best to win out as long-run average-cost plans are developed for infrastructure assets. Since the owner’s engineer must ultimately be sufficiently experienced to develop the criteria for bidding even a design-build project, the ability for multiple approaches to exist side by side for at least some time may provide the best long-term value.
Hybrid Transportation Infrastructure Project Funding Structure =
Public Leveraged Base Funding (“Quant” Investment per Person-Trip/Mile) + Managed Toll/Ticket (at P3 Performance Risk)
Still, a majority of intercity transportation projects would likely still rely largely on public distributions, from either dedicated fuel taxes or general funds, though regulated by the quant to avoid overbuilding, with no direct consumer revenue per mile traveled. Only projects with significant congestion risk and constrained rights of way would include a managed toll or ticket atop the publicly leveraged funding.
THE PROBLEM OF CHASING ECONOMIC TIME SAVINGS OVER CONSUMER-VALUED TIME UTILITY
Along this path of reform, transportation planning methods used to determine the type, size, and routing of infrastructure should be reconsidered in light of a time-utility economic model that aligns with consumer behavior. Examples include the preference for a crossover sport utility vehicle for seating comfort, daily trip reliability over absolute speed gains, accessible smaller retail and restaurants along daily paths, or beneficial mobile work and rest as a passenger.31
Conceptually, time has different values expressed in our recounting of the quality of an experience. If we say, “We had such a great time at dinner last night; the time just flew,” then the perceived cost of that time was low. If we say, “The line inched along behind the accident backup; the time dragged on forever,” then the perceived cost of time was high. Thus, time could be measured as an economic disutility to each person, relative in both cases to what one wanted to be doing at that time of day, the baseline for time utility.
Ideally, the financial quant should be coupled to such a time-utility economic model, which now is only used to estimate consumer travel behavior, instead of to justify the financial costs of construction to access leveraged Highway Trust Fund monies.
Consumers have demonstrated, through real-world high-occupancy toll road purchases (revealed preferences), a willingness to pay only around $7 per hour for travel time savings (although this will vary by region),32 much less than the conventional U.S. Department of Transportation value of $19 per hour.33 However, they also have shown a willingness to pay around $22 per hour for reliability savings not tied to higher speeds. This factor is concerning from a design rationale standpoint, as these theoretical time savings typically account for most of the public benefits in a transportation economic benefit–cost analysis. Other studies of actual toll transactions have reported willingness to pay at around $2 to $8 per hour of travel time savings among all users, based on the majority deciding not to use the tolled managed lanes and the minority being willing to pay much more. The latter calculation might be the more reliable estimate in this author’s estimation.34
This overemphasis of speed to gain time savings overwhelms safety benefits in current models and limits the exploration of reliability and connectivity benefits that could occur with different network designs and target speeds.
Current models presuppose that we highly value just a few net seconds saved from driving faster, yet farther, on a wide 50 mph (miles per hour) urban arterial collector instead of on a connected 35 mph street.35 This preference is assumed in VTTS methods (despite the potential public discontent regarding the unavailability of a local street grid onto which to detour in the event of accident backups). Concentrating urban daily traffic onto large at-grade arterials—where all traffic is concentrated at surface intersections instead of bridging over—is the default option resulting from road-widening projects pursued at high cost instead of developing grids of many streets. This approach has been a recipe for unreliability for the same reason that a wire rope is made of many strands, not just one.
Such concentrations of traffic on fewer, wider routes:
ʺ Increase urban traveled distances,36
ʺ Decrease proportional capacity in each lane as turning movements take longer to clear the roadway paved width,37 and
ʺ Increase the cost for the now more complicated intersections with large traffic signal masts and multiple turn lane bays.
Urban designs are being advanced for the wrong reasons under VTTS metrics. Instead, given that the construction is actually financed by local property taxes, time-utility economic metrics should be used to design facilities for greater interconnectivity of local travel and enhancement of property values. The next section explores this topic with examples of urban person-trip and intercity person-mile throttling metrics.
URBAN-FOCUSED INFRASTRUCTURE: APPLYING THROTTLING WITH INCREMENTAL CONSUMER FEEDBACK
Rethinking funding programs in light of this shift could produce true budget and resource efficiency. Specifically, it would help guide engineers as they design new road infrastructure to select a reasonable paved width and target speed using an iterative feedback of costs, development value, and economically projected travel, instead of just trying to provide for faster speeds for illusory time savings.
Such a throttle, coupled with intercity person-miles traveled as the denominator, would likely incentivize rural asset preservation over building the next new urban-edge highway absent meaningful cost recovery. Urban highway rebuilding—often languishing except when comprising a quiet mix of trust fund grants and estimated revenue from future high-occupancy toll (HOT) collections— could proceed with a person-trip-based funding boost. Public messaging—freed from trying to pretend that incremental user fees pay for incremental capacity—could shift to justify some prepaid HOT monthly vouchers for the occasional trip, while daily commuters would be tolled at the market clearing rate to ensure stable traffic flows inside expensive urban rights of way.
This approach would require relaxing some of the federal-level prohibitions against tolling existing Interstates, with the caveat that federal policy could encourage early-adopter states to enter into one of the tolling pilot programs when some urban rebuilding is needed as a way to minimize right-of-way takings. As more states participate and evaluate their use of tolling pilot programs, those could be expanded as needed. Such an approach would offer occasional users a reliable option for traveling between cities, going to doctor appointments, or arriving on time at a transportation terminal, while being fair to those who conserve time and resources by living close to work. On the employer side, it might lead to a consideration of the personal time costs of relocating a given employment site.
Consider how an urban per-trip infrastructure investment throttling metric would work for automobile trips given the relative cost of different types of roads. The Federal Highway Administration’s Highway Economic Requirements System38 and the Florida Department of Transportation’s long-range planning39 tables are helpful to start (although these estimates must be adjusted, as some appear to omit costs for right-of-way land, intersections, designs, programs, large structures, and utilities typically reported separately by agencies). One can see that on a person-trip metric, local roads must rely on local general revenue, as gas taxes are netted out; hence, they should enhance the property values of the land that fronts the road.
Table 4. Urban Person-Trip Costs by Automobile to Explore the Relative Efficiency of Road Types
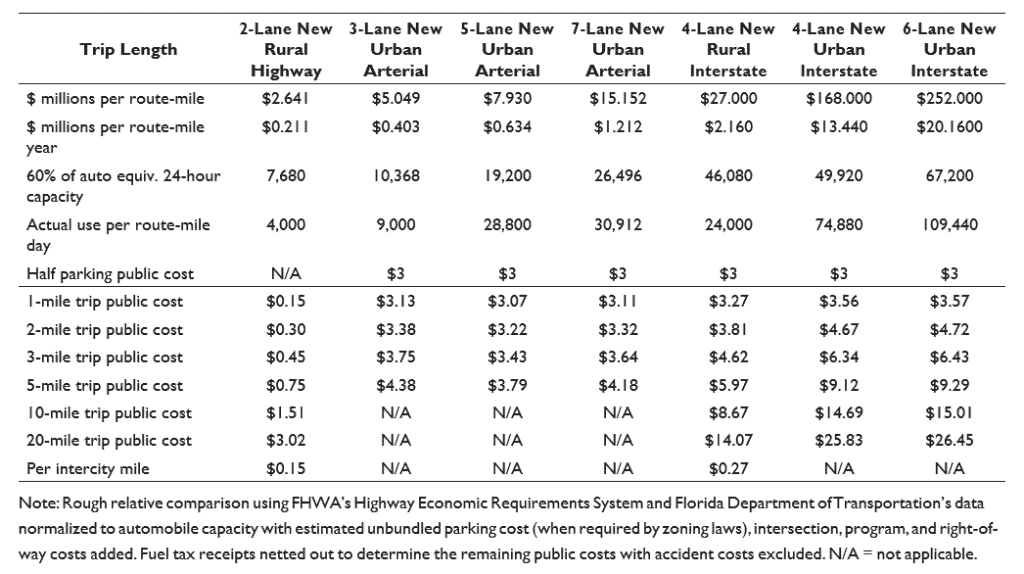
In areas that are beginning to be urbanized, instead of one large seven-lane road, three smaller three-lane roads could be built for the same cost. Yet by increasing road network connectivity, a five-mile trip could be turned into a threemile trip, reducing urban infrastructure unit costs and vehicle miles traveled. Certainly, many documents now exist to guide design for connectivity in what is called a context sensitive solutions approach.40 Yet what is lacking—and what this paper hopes to provide—is a method to define the context in new construction where none exists in light of (a) the financial reality of how roads are funded and (b) the economic reality of what consumers value as they make travel choices. (See Table 4)
However, the current focus is often only set on widening existing suburban and urban roads as they were designated to be on the federal-aid highway system even though they primarily serve local traffic. A federal program that encourages investment in only limited-access highways on the National Highway System,41 along with a more limited federal-aid highway route mileage—which is a program to provide federal funds to larger and faster surface streets42—would also help support robust local property values by eschewing real estate developments on wide, conflicted five and seven-lane arterials. These roads mix faster 50 mph through traffic with slower turning movements for property access at great net public cost, but with little up-front cost to land developers.43 If policy makers recognize the distinction, then sufficient local property tax revenue might remain available to maintain the local street network in good order with locally responsive cost control and governance.
An example of separating daily urban uses and federally funded intercity travel on existing routes as urban populations expand might be a surface boulevard arrangement, with the preexisting limited-access highway retained at a reasonable width at the center, perhaps even reconstructed with a toll. This center highway could then be flanked by new smaller access roads funded by land developers, and perhaps integrated into parking layouts, running closer to buildings to better promote local access rather than high-speed travel for illusory time savings.44 This arrangement could preserve local property tax flows by supporting the eventual redevelopment of the adjacent property for higher use in a second life cycle on what should be a desirable central location.
For urban transportation projects in economically recovered cities, the cost of city-mandated off-street parking on private property as a tax on that property45—along with a shadow toll accounting for the use of existing streets in dense urban areas on a person-trip basis46—should be considered. This could unify the transition point between local and federal funding responsibility, as daily commuting is about half of all travel on the shared Interstate highways, but largely unpriced.
Much of this would undo the mistakes made almost a century ago when the U.S. Department of Commerce promoted the “floor space” theory of intentionally spreading out buildings through zoning laws, increasing road width, and driving farther. This theory—articulated in the 1928 report of the National Conference on Street and Highway Safety—was advanced over city engineers’ concepts regarding efficiency of street use, which were rooted in an attempt to stay inside urban rights-of-way and conserve existing infrastructure.47
NATIONALLY SIGNIFICANT PROJECTS: AN EFFICIENT FEDERALIST BALANCE BETWEEN RURAL INTERCITY TRAVEL AND URBAN COMMUTING
The federal surface transportation program should strive to be more akin to a true post road function of interstate and intercity infrastructure—roads designed for long trips. Such a regime would rely on a system of historical federalism to serve as a public-good bridge over any tragedy-of-the-commons problems that may arise as states compete with one another for a fixed pool of federal resources.
In fact, that is one of the problems the Founders sought to address when they gave the federal government the power to establish general-use post roads under the Constitution. They seemed to have recognized a deficiency in governmental responsibility without these powers.48 Such federal powers derive from the purpose of government to secure preexisting rights, order liberty, and promote the common welfare, while an individual state might have no economic interest.49 Moreover, many modern readers might not realize that “post” also refers to routes on which there was a customary daily distance citizens could expect to travel before seeking lodging at intermediate post houses—in other words, common-use infrastructure.50
This safeguard is needed as federal investments and directives can undermine local governance when they overwhelm local markets that have taken decades to develop. This can occur even when good intentions are the basis, such as in stimulus funding for new infrastructure projects to create jobs or emergency support in an operational crisis.
True interstate and intercity infrastructure projects seeking federal support might qualify with long-run average-cost plans based on the design particulars of the projects, similar to the multidecade cash-flow analysis used to find the quant. Then funds for nationally significant projects, from the Highway Trust Fund or elsewhere, could go to the lowest investment required per intercity person-mile or freight ton/trailer-mile as a shadow toll for performance management. In fact, the Federal Highway Administration has made early attempts to establish this process, for which life-cycle planning51 is part of the asset management maintenance toolbox.52 However, such methods have yet to consider the fuel tax leveraging needed for the original capital funds that the quant seeks to define.
Given the relatively mature network, many of the funds would likely go toward rebuilding facilities to support existing use more efficiently. This could occur with public-private partnership construction arrangements and a public quant investment as the foundation, but with pricing and designed-in reliability to absorb nonrecurring congestion caused by accidents, instead of chasing after higher speeds as though they were the source of funding.
Considering other surface modes, as the Bragdon Committee urged, calls into question the lack of a federal funding formula for intercity freight railway mainline upgrades and the limiting focus on shorter passenger rail corridors. The quant effect, dismissed in prior eras,53 could help resolve these questions using metrics for (a) congested regions and (b) a nationwide incremental extension per person-mile or freight ton/trailer-mile to promote efficient incremental changes to the existing infrastructure.54 For instance, intermodal rail lines competitive with highways could be eligible for federal funding as a tax credit per train-mile for P3 pairing.55
Local entities could then sponsor station building and upgrades to grade crossings, with an operator able to cover above-the-rail equipment and operations costs from consumer revenue atop the tax credit for below-the-rail infrastructure—shared main lines, terminals, platforms, and risk—except for shorter routes. 56 Such an approach would allow Congress to move closer to the transportation modal parity—or modal neutrality—that the Bragdon Committee highlighted more than half a century ago.
CONCLUSION: AN INFRASTRUCTURE INVESTMENT PORTFOLIO FOR OUR JOINT PROSPERITY
While one could argue that urban road pricing through tolls is the future, this paper has sketched out how far removed current marginal gas tax revenue collected per vehicle-mile traveled is from directly paying highway project costs. We have reached the point where providing just the same level of service on Interstate highways as we have in the past will require $36 billion in additional funds annually over 20 years. There is no linear relationship to incremental traffic increases due to this leveraging, measured by the backward-looking historical quant to be $0.096 per intercity person-mile over the past six decades, while twice that for new limited-access highway projects.
If we were to embark on a much-deferred Interstate rebuilding and expansion program without tolling or increasing the gas tax, the quant-type gap between marginal revenue and long-term average cost would likely rise to around $0.13 per intercity person-mile, making a needed future shift to tolling—when congestion inevitably shows up again after the stimulus spending has ceased. But only tolling can provide consumer feedback to tame congestion and land-use patterns.
Thus, the near-term proposal is for pricing daily trips first on congested urban segments where the problems are truly dire and expansion nearly impossible, but with the knowledge that tolls will not pay for the entirety of project costs everywhere. This approach could be made broadly publicly acceptable by providing for an occasional prepaid voucher for use of a toll lane, but with daily use market priced to support free-flowing and reliable travel.
This approach could also steer local street design and land-use decisions to increase efficiency for consumers, while keeping the leveraged federal Highway Trust Fund from going into a deeper budget hole. In this way, we can begin to efficiently rebuild urban limited-access highways within existing rights of way and encourage the economic revitalization of smaller cities, as decisions on business and residential site locations are enabled to respond to informational feedback in a self-correcting marketplace.
At the same time, many existing rural intercity routes were never supported by true marginal user revenue, but were leveraged instead. Hence, certainty in federal investment from some form of public support is still needed for true intercity travel and freight flows, be it from fuel taxes, general funds, or tax credits. These funds can be ordered by the derived quant person-mile-traveled metric, deployed as a shadow toll in federal legislation to distribute funds to keep expansion projects reasonable in scope, while prioritizing repairs to existing infrastructure.
ENDNOTES
- American Road and Transportation Builders Association, “Frequently Asked Questions: What Is the Condition of the U.S. Highway Network?” accessed March 2, 2020, https://www.artba.org/about/faq/.
- Revealed preference studies indicate $2 to $8 per hour as the amount most consumers using a given corridor are willing to pay to save travel time relative to the U.S. Department of Transportation’s value of $19 per hour. “Another reason for the low VOT [value of travel time savings, as used in this paper] is that only a small percentage of trips by transponder-equipped vehicles, ap- proximately 7 percent, chose to pay to use the MLs [managed lanes are high-occupancy toll lanes]. For those 7 percent of trips, the average VOT was $39.65 per hour, a fairly high willingness to pay. However, when combined with the 93 percent of travelers not willing to pay the toll, the average VOT dropped to between $1.96 per hour and $8.06 per hour.” Mark Burris, Cliff Spiegelman,
- K. M. Abir, and Sunghoon Lee, “Travelers’ Value of Time and Reliability as Measured on Katy Freeway, Final Report,” PRC 15- 37 F, Texas A&M Transportation Institute, Transportation Policy Research Center, September 2016, p. 18, https://static.tti.tamu.edu/tti.tamu.edu/documents/PRC-15-37-F.pdf.
- U.S. Department of Transportation, “Benefit–Cost Analysis Guidance for Discretionary Grant Programs,” January 2020, https://www.transportation.gov/sites/dot.gov/files/2020-01/benefit-cost-analysis-guidance-2020_0.pdf.
- Government Accountability Office, “Funding the Nation’s Surface Transportation System—High Risk Issue 2017,” accessed March 2, 2020, https://www.gao.gov/key_issues/funding_nations_surface_transportation_system/issue_summary.
- This mild-hybrid to battery-only vehicle electrification includes 48-volt mild hybrids with no engine accessory belts, series hybrids, plug-in hybrids, and battery-only electric vehicles.
- “In 2006, a network of 4.03 million miles of public roads provided mobility for the American people. (The terms ‘roads’ and ‘highways’ are used interchangeably in this report.)” Federal Highway Administration, Status of the Nation’s Highways, Bridges, and Transit: Conditions and Performance (Washington, DC: FHWA, 2008), Chapter 2, “System Characteristics: Highways and Bridges,” https://www.fhwa.dot.gov/policy/2008cpr/es.cfm. This seemed to work as a way to avoid looking at relative cost recovery of the parts of the system before the first Highway Trust Fund bailouts.
- Milton Friedman and Daniel J. Boorstin, “How to Plan and Pay for the Safe and Adequate Highways We Need,” in Roads in a Market Economy, ed. Gabriel Roth (Burlington, VT: Gower Technical, 1996), p. 14, https://miltonfriedman.hoover.org/friedman_images/Collections/2016c21/Avebury_1996.pdf.
- “The 3R program (‘resurfacing, restoring, and rehabilitating’), initiated by the Federal-Aid Highway Act of 1976, would be ex- panded to 4R, with the fourth R being ‘reconstruction.’ States could use I-4R funds for the excluded items.” Richard F. Weingroff, “Palace Coup: President Ronald Reagan and the Surface Transportation Assistance Act of 1982,” Federal Highway Administration, accessed May 18, 2020, https://www.fhwa.dot.gov/highwayhistory/reagan_staa.cfm.
- Bureau of Public Roads, “Toll Roads and Free Roads,” April 27, 1939, http://www.virginiaplaces.org/transportation/tollroadsfreeroads.pdf.
- Robert S. Kirk and William J. Mallett, “Funding and Financing Highways and Public Transportation,” CRS Report R45350, Congressional Research Service, updated May 11, 2020, https://crsreports.congress.gov/product/pdf/R/R45350.
- Federal Highway Administration, “Ike’s Grand Plan—Notes from President Eisenhower’s 1954 Governor’s Conference Speech,” updated June 27, 2017, https://www.fhwa.dot.gov/infrastructure/50grandplan.cfm.
- Federal Highway Administration, “Meeting in the President’s Office—Interim Report on the Interstate Highway Program,” April 6, 1960, https://www.fhwa.dot.gov/infrastructure/bragdon2.cfm.
- Lee Mertz, “The Bragdon Committee,” Federal Highway Administration, updated June 27, 2017, https://www.fhwa.dot.gov/infrastructure/bragdon.cfm.
- Ibid.
- U.S. Department of Commerce, Bureau of Public Roads, “Final Report of the Highway Cost Allocation Study/Prepared Pur- suant to Section 210 of the Highway Revenue Act of 1956,” 1961, https://catalog.hathitrust.org/Record/101679610.
- Federal Highway Administration, Office of Highway Policy Information, Publications Archive, https://www.fhwa.dot.gov/policyinformation/hsspubsarc.cfm.
- Raymond Mohl, “The Interstates and the Cities: Highways, Housing, and the Freeway Revolt,” Poverty & Race Research Action Council, 2002, https://www.prrac.org/pdf/mohl.pdf.
- For a recent 31-acre 620,000-square-foot new distribution warehouse project, the 2018 city fee for off-site improvements to local roads was $7 million, or 9 percent of the total cost of the building and land. If this fee were to be spread across a half million annual local vehicle-miles, it would be a toll of $1 per vehicle-mile. Instead, this fee is bundled in the property price, funding local assets that are in turn leveraged upon by the federal Highway Trust Fund.
- Don Smith et al., “Estimating Revenues Using a Toll Viability Screening Tool,” Texas Transportation Institute, Texas A&M University System, October 2004, https://static.tti.tamu.edu/tti.tamu.edu/documents/0-4726-1.pdf.
- Texas Department of Transportation/Cambridge Systematics, Inc., “The Highway Construction Equity Gap,” February 2008, https://flatironbike.com/files/2008/07/texasdot_equitygap.pdf.
- Build America Transportation Investment Center Institute: An AASHTO Center for Excellence, “Financing: Other Finance Mechanisms, Shadow Tolls,” accessed June 29, 2020, http://www.financingtransportation.org/funding_financing/financing/other_finance_mechanisms/shadow_tolls.aspx.
- Revealed preference studies indicate $2 to $8 per hour as the amount the broader consumer pool using a corridor is willing to pay to save travel time relative to the commonly used $19 per hour. See the section titled “The Problem of Chasing Economic Time Savings over Consumer-Valued Time Utility.”
- L. J. Blincoe et al., U.S. Department of Transportation/National Highway Traffic Safety Administration,“The Economic and Societal Impact of Motor Vehicle Crashes, 2010 (Revised), (Washington, DC: National Highway Traffic Safety Administration, 2015), http://www.trb.org/Main/Blurbs/172763.aspx (adjusted from 2010 dollars to 2018 dollars by a factor of 114.4 percent).
- National Academies of Sciences, Engineering, and Medicine, Renewing the National Commitment to the Interstate Highway System: A Foundation for the Future (Washington, DC: National Academies Press, 2019), https://www.nap.edu/catalog/25334/renewing-the-national-commitment-to-the-interstate-highway-system-a-foundation-for-the-future.
- U.S. Public Law 102-240, Intermodal Surface Transportation Efficiency Act of 1991, § 1012, Toll Roads, Bridges, and Tunnels (4R Interstate maintenance funds); and Section 1014, Reimbursement for Segments of the Interstate System Constructed without Federal Assistance (legacy pre-1956 toll roads), 1991, https://www.govinfo.gov/content/pkg/STATUTE-105/pdf/STATUTE-105-Pg1914.pdf.
- U.S. Secretary of Commerce, letter transmitting the report “Progress and Feasibility of Toll Roads and Their Relation to the Federal-Aid Program,” 1955, https://catalog.hathitrust.org/Record/000968419.
- Minnesota Department of Transportation, “Minnesota Tolling Study Report: Modern Tolling Practices and Policy Consider- ations,” January 2018, https://www.dot.state.mn.us/govrel/reports/2018/tolling-study-report.pdf.
- The application of a 3.5-cent base rural automobile toll—with higher truck and urban demand responsive tolls—is proposed to cover rebuilding, marginal expansion, and maintenance of most Interstate segments, but not all. Robert W. Poole Jr., “Interstate 2.0: Modernizing the Interstate Highway System via Toll Finance,” Policy Study No. 423, Reason Foundation, September 2013, https://reason.org/wp-content/uploads/files/modernizing_interstates_toll_finance.pdf; Ed Regan and Steven Brown, “Building the Case for Tolling the Interstates,” Tollways, Vol. 8, No. 1 International Bridge, Tunnel and Turnpike Association, (Spring 2011), https://www.ibtta.org/sites/default/files/documents/Advocacy/Key%20Studies/Regan–Case%20for%20Interstate%20Tolling.pdf.
- “And here enters the most serious danger of the toll road. However great may be the remainder of traffic left to the parallel free road, however insistent may be the need for substantial improvement of the facility it affords to that traffic, the design standards of the free road must be held materially lower than those of the toll road, else the latter will be robbed of nearly all of its essential support.” Federal Highway Traffic Administration, “Thomas H. MacDonald on Toll Roads,” April 22, 1947, https://www.fhwa.dot.gov/infrastructure/mcdonaldtoll.cfm.
- U.S. Department of Transportation, “Moving America: New Directions, New Opportunities—A Statement of National Trans- portation Policy Strategies for Action,” National Transportation Library, February 1, 1990, https://rosap.ntl.bts.gov/view/dot/531.
- International Transport Forum, “What Is the Value of Saving Travel Time?,” ITF Roundtable Reports, No. 176, Organisation for Economic Co-operation and Development, 2019, https://www.itf-oecd.org/sites/default/files/docs/value-saving-travel-time.pdf.
- “We estimate that VOT [value of time savings/value of travel time savings] is only $7/hour for the preferred specification while VOR [value of reliability as a part of time utility] is over $22/hour. In aggregate 68% of the benefits to HOT [high-occupancy toll] users are from increased reliability.” Daniel A. Brent and Austin Gross, “Dynamic Road Pricing and the Value of Time and Reliability,” Working Paper No. 2016-07, Department of Economics, Louisiana State University, June 2017, p. 5, http://faculty.bus.lsu.edu/papers/pap16_07.pdf.
- U.S. Department of Transportation, “Benefit–Cost Analysis Guidance” (see n. 3).
- “Another reason for the low value of travel-time savings, as used in this paper, is that only a small percentage of trips by transponder-equipped vehicles, approximately 7 percent, chose to pay to use the MLs [managed lanes are HOT lanes]. For those 7 percent of trips, the average VOT was $39.65 per hour, a fairly high willingness to pay. However, when combined with the 93 percent of travelers not willing to pay the toll, the average VOT dropped to between $1.96 per hour and $8.06 per hour.” Burris et al., “Travelers’ Value of Time and Reliability” (see n. 2).
- A collector is a type of road between an arterial and a street.
- Carlos A. Alba and Edward Beimborn, “Analysis of the Effects of Local Street Connectivity on Arterial Traffic,” Center for Urban Transportation Studies, University of Wisconsin–Milwaukee, 2008, https://pdfs.semanticscholar.org/f0b6/51f246d84c947f48997d1ba833bbe2047883.pdf.
- Robert Steuteville, “Why Street Grids Have More Capacity,” Public Square, Congress for the New Urbanism, July 31, 2018, https://www.cnu.org/publicsquare/2018/07/31/why-street-grids-have-more-capacity.
- Federal Highway Administration, Status of the Nation’s Highways, Bridges, and Transit: Conditions and Performance (Washing- ton, DC: FHWA, 2015), Appendix A, “Highway Investment Analysis Methodology/Highway Economic Requirements System (HERS),” https://www.fhwa.dot.gov/policy/2015cpr/appendixa.cfm.
- Florida Department of Transportation, “Program Management—Cost per Mile Models for Long Range Estimating,” 2019, https://www.fdot.gov/programmanagement/Estimates/LRE/CostPerMileModels/CPMSummary.shtm.
- Institute of Transportation Engineers and Congress for the New Urbanism, “Designing Walkable Urban Thoroughfares: A Context Sensitive Approach,” 2010, https://www.ite.org/pub/?id=e1cff43c%2D2354%2Dd714%2D51d9%2Dd82b39d4dbad.
- Federal Highway Administration, “National Highway System,” accessed February 13, 2020, https://www.fhwa.dot.gov/planning/national_highway_system/.
- There are 202,000 route-miles on the National Highway System (Interstates and U.S./state/city highways that are mostly federally funded), 808,000 route-miles of federal-aid highways (arterials and collectors with a mix of federal, state, and local funding but significant federal design criteria), and 3,167,000 route-miles of non-federal-aid highways (the FHWA’s term for locally funded roads and streets all obliquely called highways). FHWA Highway Statistics, 2018, Table HM-16. Public Road Length—2018, https://www.fhwa.dot.gov/policyinformation/statistics/2018/pdf/hm16.pdf.
- These are known colloquially as “Stroads” in critiques of urban design and the confusion of transportation priorities. Charles Marohn, “The Stroad,” Strong Towns (blog), October 30, 2017, https://www.strongtowns.org/journal/2017/10/30/the-stroad.
- National Association of City Transportation Officials, “Urban Street Design Guide,” accessed February 13, 2020, https://nacto.org/publication/urban-street-design-guide/streets/boulevard/.
- Victoria Transport Policy Institute, “Transportation Cost and Benefit Analysis II—Parking Costs,” 2019, https://www.vtpi.org/tca/tca0504.pdf.
- Federal Highway Administration, “Payment Mechanisms in Public–Private Partnerships (P3s),” accessed March 2, 2020, https://www.fhwa.dot.gov/ipd/fact_sheets/p3_paymentmechanisms.aspx.
- “Traffic congestion was no longer to be understood as an efficiency problem. Instead the ‘floor space’ principle … became the basis of the Commerce Department’s official position on the way to fight traffic.” Peter D. Norton, Fighting Traffic: The Dawn of the Motor Age in the American City (Cambridge, MA: MIT Press, 2011), p. 192, https://mitpress.mit.edu/books/fighting-traffic.
- Robert Jay Dilger, “Federalism Issues in Surface Transportation Policy: A Historical Perspective,” CRS Report No. 7-5700 R404031, Congressional Research Service, December 8, 2015, https://fas.org/sgp/crs/misc/R40431.pdf.
- “§ 1138 . . . where there is not any good state-road, and where the amount of travel would not justify any state in an expen- diture equal to the construction of such a state-road. In such cases, as the benefit is for the Union, the burthen ought to be borne by the Union.” Joseph Story, Commentaries on the Constitution of the United States (Boston: Hilliard, Gray, and Company, 1833), https://web.archive.org/web/20200528235528/https:/www.constitution.org/js/js_318.htm.
- “In colonial days, the keeper of a post house, ordinary, tavern, inn or public house by whatever name it was called, was always a person of consequence.” Arthur Phillips, The Phillips History of Fall River (Fall River, MA: Dover Press, 1946), pp. 28–29, https://www.sailsinc.org/durfee/phillips3-4.pdf.
- Federal Highway Administration Transportation Asset Management Expert Task Group, “Life Cycle Planning,” FHWA- HIF-19-072, Federal Highway Administration, July 2019, https://www.fhwa.dot.gov/asset/etg/pubs/whitepaper1.pdf.
- Federal Highway Administration, “Asset Management,” accessed June 2, 2020, https://www.fhwa.dot.gov/asset/.
- Theodore C. Forrence Jr., “Amtrak’s Legislative Mandate: A Time for Rethinking,” Notre Dame Journal of Legislation, Vol. 8, No. 2 (1981), pp. 347–48, https://scholarship.law.nd.edu/jleg/vol8/iss2/9.
- Bill Wilson, “Florida’s Brightline Passenger Rail Expands on Success,” Railway Track and Structures, September 9, 2019, https://www.rtands.com/railroad-news/floridas-brightline-passenger-rail-expands-on-success/.
- Virgil G. Payne, “Tax Credit Policy Summary,” 2020, https://www.scribd.com/document/442430149/Policy-Summary-National-Railway-Infrastructure-Plan.
- Virgil G. Payne, “National Railway Infrastructure Plan for Shareholder and Publicly Held Railways,” 2020, https://www.scribd.com/document/443778048/National-Infrastructure-Plan-for-Shareholder-and-Publicly-Held-Railways.