Moment of truth: Reassessing Obamacare enrollment predictions

Photo Credit: Getty
In 2025, several organizations predicted Obamacare enrollment in a world without the ACA’s expanded subsidies. That world became reality this year. Some groups’ predictions appear accurate, but most overstated the effect that the expansion’s termination would have on the number of uninsured Americans. Because these forecasts were used to persuade legislators, it is important to correct the record and help ensure that similar forecasting mistakes are not repeated.
In 2024, the Congressional Budget Office (CBO) projected 22.8 million people would be covered by an ACA plan in 2025. It projected that number would fall to 18.9 million in 2026 if Congress failed to renew the expanded subsidies, representing a decline of roughly 4 million.
When the 2025 and 2026 enrollment periods concluded, the data showed a slightly different story. In 2025, 24.2 million enrolled in Obamacare, compared with 23.1 million in 2026 — a difference of only 1 million. CBO’s predictions, however, relate not to sheer sign-up numbers but to the arguably more important metric: effectuated enrollment.
Effectuated enrollment consists of enrollees who actually pay their insurance premiums and activate coverage at the start of the year. CBO predicted accurately on effectuated enrollment. By February 2025, 21.8 million enrollees had effectuated, and by February 2026, 19.2 million had effectuated.
| Year | CBO | Actual |
| 2025 | 22.8 | 21.8 |
| 2026 | 18.9 | 19.2 |
Enrollees may decide not to effectuate for several reasons. They may cancel an ACA plan if it becomes too expensive or if their health has improved and feel they no longer need it.
But there are other factors that contribute to the difference between overall and effectuated enrollment. Marketplace integrity programs may terminate plans belonging to improper or phantom enrollees. Insurance companies may cancel plans if enrollees do not pay their premiums on time. This can be the case for individuals who were unknowingly signed up for ACA plans by unscrupulous brokers.
Effectuated enrollment always differs from sign-up numbers, but organizations predicted that the difference would be particularly large this year. With the expiration of the expanded subsidies, they assumed many low-income Americans would drop coverage as higher premium payments piled up.
The Urban Institute used 2025’s effectuated enrollment data to estimate effectuation rates for 2026. It projected that reverting to standard premium tax credits would “shrink the subsidized Marketplace to cover 11.7 million people in 2026.” Instead, 19.2 million remained enrolled in Marketplace plans through February 2026. Because this figure includes both subsidized and unsubsidized enrollees, it cannot be compared directly to Urban’s estimate. Yet even under the extreme assumption that every enrollee who dropped coverage had received subsidies, subsidized enrollment would still total 16.2 million people, 4.5 million above Urban’s projection.
The Commonwealth Fund examined state-specific effectuated enrollment data and observed that plan terminations had increased compared to 2025. They concluded that without the expanded subsidies, people were canceling their ACA plans, considering them no longer affordable. A recently released Department of Health and Human Services (HHS) report, however, weakens this conclusion.
The HHS report shows that Marketplace integrity efforts that began in 2025 and continued through February 2026 blocked or terminated 2.9 million improper subsidized enrollments. This year’s effectuated enrollment decline is partly due to these integrity efforts. It cannot be attributed entirely to reduced affordability as the Commonwealth Fund suggested.
The greater loss may not be insurance coverage in 2026 but rather wasted taxpayer dollars in 2025.
State enrollment
The Urban Institute further predicted that, without the expansion renewal, subsidized enrollment for Georgia, Louisiana, Mississippi, Oregon, South Carolina, Tennessee, Texas, and West Virginia would fall by more than half. The real enrollment drops were much smaller. Texas’s enrollment numbers even increased.
| State | 2025 | 2026 | Change | % Change |
| Georgia | 1,408,586 | 1,181,762 | -226,824 | -16.1% |
| Louisiana | 281,760 | 270,603 | -11,157 | -4.0% |
| Mississippi | 331,444 | 299,069 | -32,375 | -9.8% |
| Oregon | 111,923 | 71,461 | -40,462 | -36.2% |
| South Carolina | 602,774 | 524,348 | -78,426 | -13.0% |
| Tennessee | 611,247 | 514,745 | -96,502 | -15.8% |
| Texas | 3,783,759 | 3,879,651 | +95,892 | +2.5% |
| West Virginia | 65,214 | 49,683 | -15,531 | -23.8% |
Note: The table contains CMS enrollment data from 2025 and 2026.
Reducing subsidies should reduce enrollment. Texas’s enrollment increase is difficult to explain without acknowledging that a portion of Obamacare enrollment, the improper portion, does not follow rational consumer behavior. Indeed, one reason Urban underestimated enrollment may be an insufficient consideration of improper enrollment.
Yet even in states where improper enrollment is not believed to be widespread, enrollment declined far less than Urban’s predictions. West Virginia, for example, saw enrollment decrease by 24 percent, well below the projected “more than half.”
Changes by income group
In May, KFF reviewed the 2026 enrollment numbers and noted, “sign-ups with incomes below 150% FPL fell by 441,000 people [and constituted] 37 percent of the [overall enrollment] decline.” A closer look at the data suggests there were gains in a certain subset of those below-150-percent-FPL, though. Enrollment in the 100-138 percent FPL range increased by 326,000 this year.
KFF also observed “losses among the 250 to 300 percent FPL group were largely offset by gains among the 300 to 400 percent FPL group.”
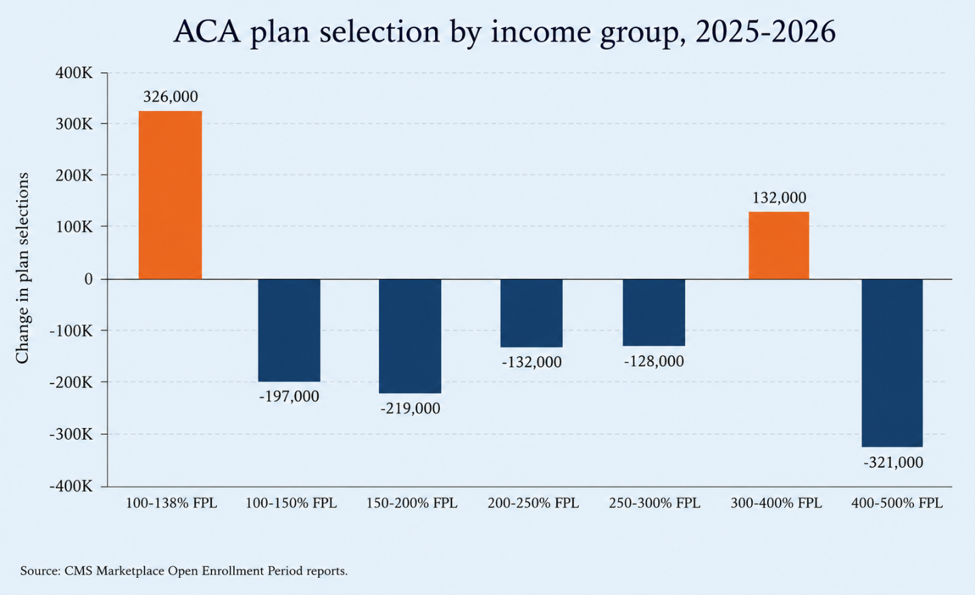
The termination of the expanded subsidies made Obamacare more expensive for every income group. Given that, it makes little sense that enrollment for the 100-138 percent and 300-400 percent FPL ranges increased, but KFF does not explain these surprising gains.
One explanation is that improper enrollment disproportionately affected these groups.
Metal levels
Prospective enrollees can choose between four insurance plan tiers in the ACA Marketplace: bronze, silver, gold, and platinum. Bronze plans have the lowest premiums, while platinum plans have the highest. Subsidies, however, are based on the benchmark silver plan. Under the expanded subsidies, individuals with incomes 100-150 percent of the FPL received subsidies that would fully cover the two least expensive silver plans.
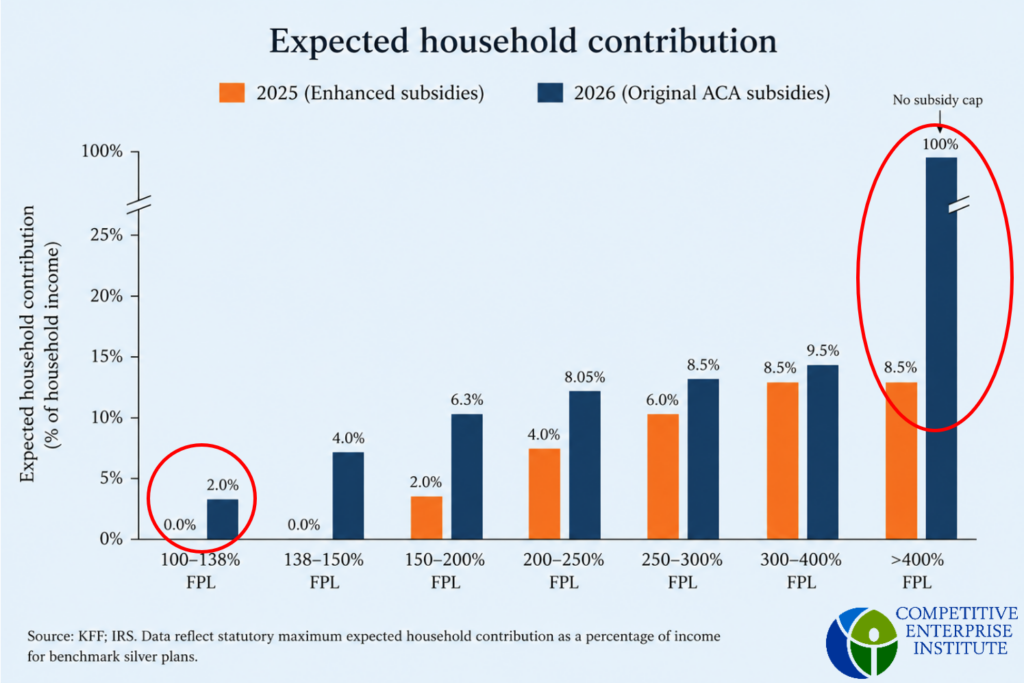
This year, however, the original ACA subsidy levels returned. Under the original subsidy rates, those with incomes in the 100-138 percent FPL range must contribute 2 percent of their annual income to premiums, with the government making up the remaining cost of the benchmark silver plan. Thus, silver plans for low-income individuals became no longer free, but many bronze plans still were.
The Paragon Health Institute argues that fully subsidized premiums contributed to improper enrollment. Brokers exploited these zero-premium plans by enrolling low-income individuals without their full consent, knowing that the absence of premium payments made such enrollments less likely to be detected. The financial incentive to report income below 138 percent rather than slightly above it is relatively small — individuals contribute roughly 2 percent instead of 3 or 4 percent of income toward coverage costs. The 100-138 percent FPL group’s enrollment increase is therefore unlikely to be explained solely by individuals reporting incomes just below the eligibility threshold. Instead, it may reflect a concentration of improper enrollment within the portion of the 100-150 percent FPL range where fully subsidized bronze coverage remains available.
By contrast, enrollment in the 300-400 percent FPL group likely increased because of individuals trying to avoid the resurrected subsidy cliff. The return of the ACA’s original subsidy structure created a huge financial incentive for middle-income individuals to report incomes just under 400 percent of the federal poverty level; earning just above that threshold meant no subsidy at all.
To make informed policy decisions, legislators need reliable analysis. Organizations must start addressing the reality of improper enrollment and the structural flaws of the ACA that have allowed it to propagate.