SAFE Rule Examined Part 2: Air Quality and Auto Safety

 Today’s post examines the Final Safer Affordable Fuel Efficient (SAFE) Vehicles Rule’s estimated impacts on air quality and auto safety. Citations to the rule are to the published (Federal Register) version. In other citations, FRIA stands for Final Regulatory Impact Analysis and FEIS for Final Environmental Impact Statement.
The SAFE Rule is the joint product of the Environmental Protection Agency (EPA) and National Highway Traffic Safety Administration (NHTSA). I have not reanalyzed (audited) the agencies’ models and data, and therefore cannot vouch for their estimates. Nonetheless, ample evidence, discussed below, debunks opponents’ claims that the SAFE Rule endangers public health.
Will the SAFE Rule Damage Air Quality?
As discussed in Part 1 of this series, the SAFE Rule establishes corporate average fuel economy (CAFE) standards and carbon dioxide (CO2) emission standards for model year 2012-2026 light duty vehicles (passenger cars and light trucks). The standards are less stringent than those in the Obama administration’s 2012 motor vehicle rule. The SAFE Rule requires the average fuel economy of new light duty vehicles to increase from 37 miles per gallon in 2020 to 40 mpg in 2026. The 2012 rule, if still in effect today, would require average fuel economy to increase from 37 mpg in 2020 to 47 mpg in 2025 (85 FR 24259).
Anti-Trump politicians, activists, and pundits denounce the SAFE Rule as a plan to weaken “clean car standards,” boost sales of “high-polluting” vehicles, increase “air pollution from vehicle tailpipes,” and endanger “people with asthma and other health problems linked to dirty air.”
Such attacks foster and exploit two common misconceptions. One is that CO2 emissions make air dirtier and less healthy to breathe. Carbon dioxide-emitting industrial facilities and vehicles are thus decried as sources of “carbon pollution.” In fact, CO2 is a natural constituent of clean air and vital to life on planet Earth.
The second misconception is that lower mpg vehicles are inherently more polluting. Fuel economy standards are calibrated in miles per gallon (mpg) whereas vehicle exhaust emission standards for carbon monoxide (CO), volatile organic compounds (VOCs), nitrogen oxides (NOx), particulate matter (PM), and toxic pollutants are calibrated in grams per mile (g/mi). Consequently, lower-mpg vehicles do not emit more of those pollutants per mile (FRIA, 1237). In addition, as mileage standards increase, so do fuel savings, which may induce some drivers to take longer or more frequent trips (a phenomenon called the “rebound effect”). In such cases, higher fuel economy increases total tailpipe pollutant emissions.
Lower mpg vehicles do emit more sulfur dioxide (SO2) per mile. That is because the EPA’s Tier III motor vehicle air pollution program prescribes sulfur content standards for fuels rather than tailpipe emission standards for SO2 (73 FR 23445). Tailpipe SO2 emissions are “proportional to fuel consumption” and, thus, higher in lower mpg vehicles (FRIA, p. 1266).
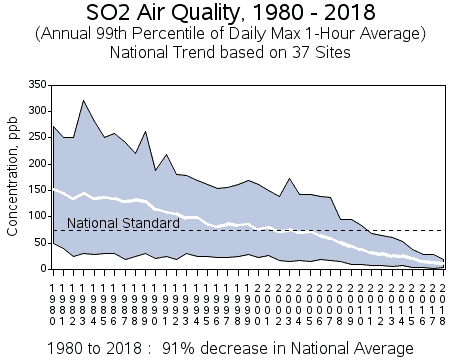
However, light-duty vehicles are a minor contributor to SO2 emissions—less than 0.68 percent of national emissions (FEIS 4-17). Besides, economywide SO2 emissions are projected to decline more rapidly under the SAFE Rule, especially during 2035-2050, because automakers will face less regulatory pressure to electrify their fleets, reducing SO2 emissions associated with electric power generation (FEIS, 4-31). In any case, SO2 emissions are already a non-problem:
Tailpipe emissions of CO, NOx, SO2, and toxic pollutants other than diesel particulate matter (DPM) are projected to decline more rapidly under the SAFE Rule through 2025, as the reduction in vehicle ownership costs accelerates fleet turnover to newer cleaner vehicles (FEIS, 4-39).
The SAFE Rule eases regulatory pressure on automakers to produce battery electric vehicles. Consequently, average vehicle tailpipe emissions during 2035-2050 are higher under the SAFE Rule than under the 2012 rule. Nonetheless, all new light duty vehicles with internal combustion engines will be subject to the same criteria and toxic emission standards over the next two decades (85 FR 25040). By 2025, all will be virtually zero-pollution vehicles. In fact, as sources of ground-level ozone, new vehicles have been more than 99 percent clean since 2004.
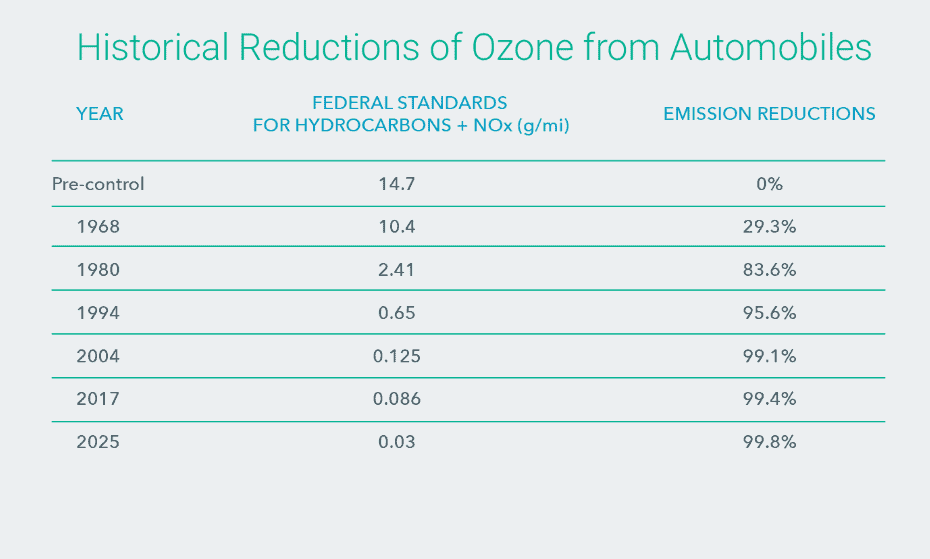
Note, too, that the values in the table above are the maximum allowable. Actual on-road performance of cars manufactured since the early 2000s is frequently better. Furthermore, on-road data show continual improvements in the durability of vehicle emission controls since the late 1990s, making the effective pollution reductions even greater than the per-mile emission limits alone suggest (Bishop and Stedman 2008, Zahn 2018, Bishop and Haugen 2018). Also notice that the change in standards from 2017 to 2025 represents a 65 percent reduction in allowable emissions.
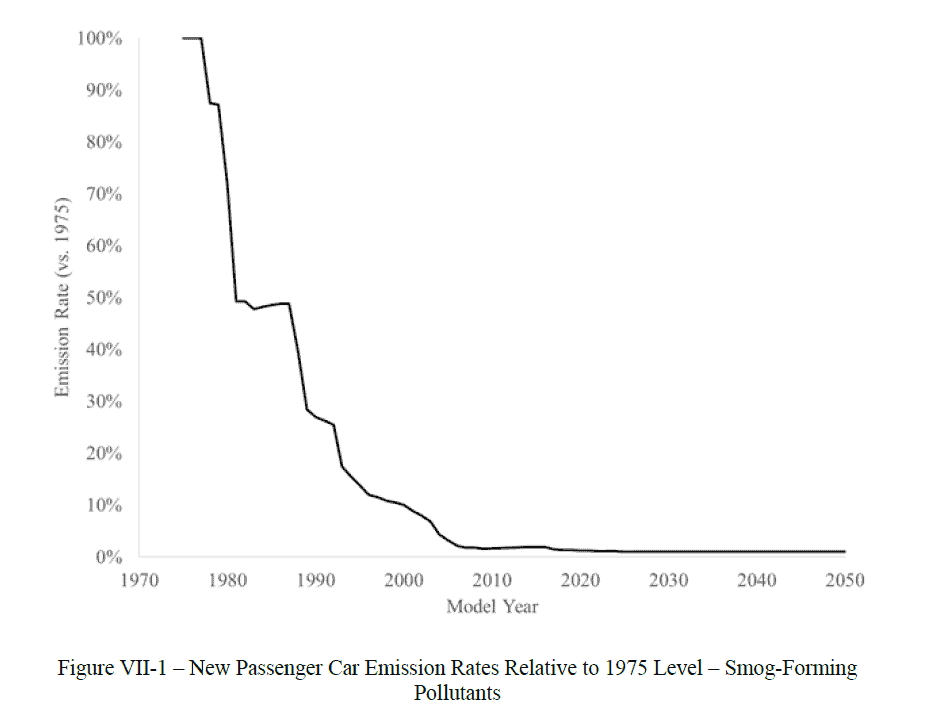
In short, the SAFE Rule will not affect the relentless long-term decline in tailpipe air pollutant emissions from the U.S. auto fleet.
Why then does the SAFE Rule increase economywide criteria and toxic emissions in 2035-2050 relative to the 2012 rule baseline? Partly because zero emission vehicles gain a smaller market share, but chiefly because lower average fuel economy means higher fuel consumption, hence more “upstream” emissions from oil production, refining, storage, and transport (FRIA, 1237). Due to upstream emissions, total fine particle (PM2.5) emissions are also higher in 2025 compared to the 2012 standards. In the figures below, “Alt. 0 No Action” refers to the 2012 rule baseline, “Alt. 3” refers to the SAFE Rule (FEIS, 4-34, 39).
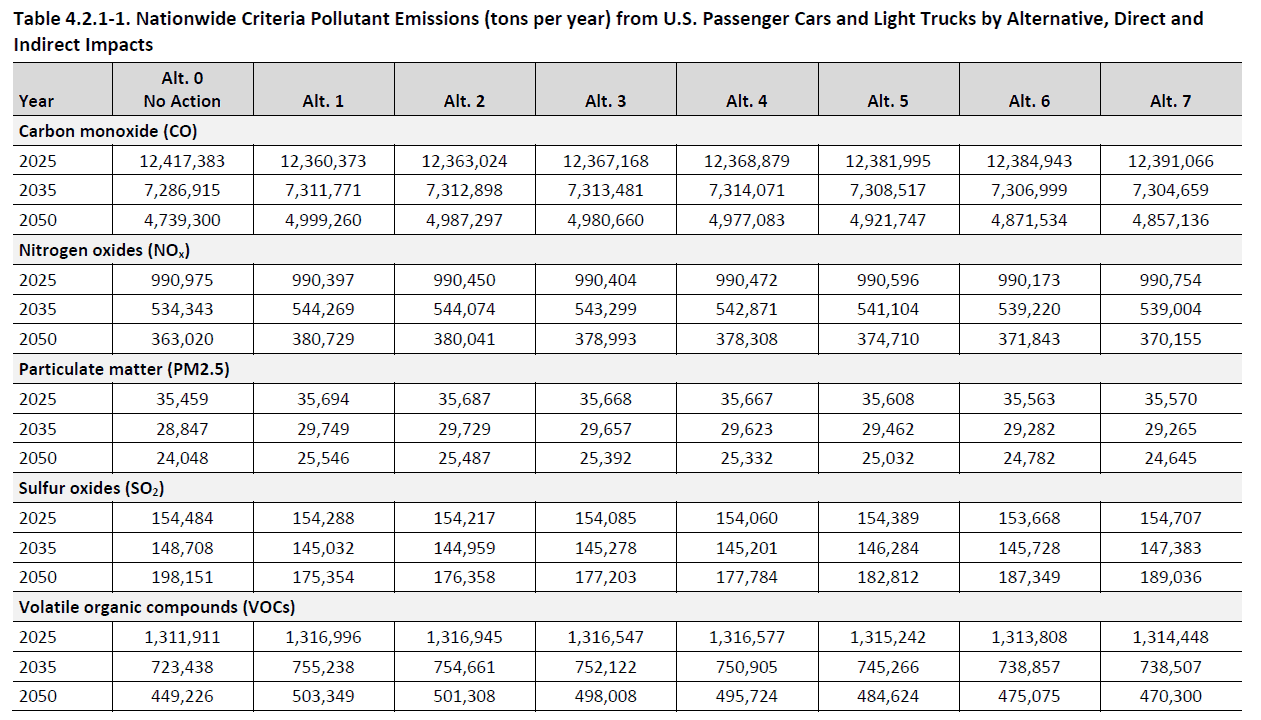
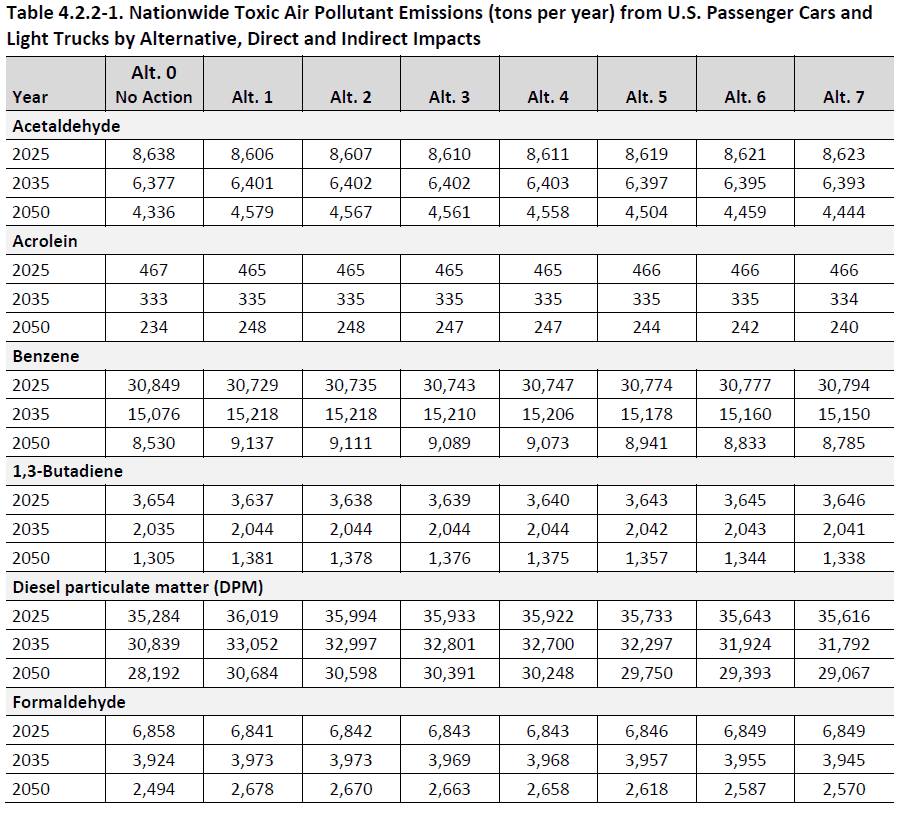
The big picture, however, is this. Under the SAFE Rule, total (tailpipe and upstream) light duty vehicle criteria and toxic emissions will decline, decade by decade, and the air will keep getting cleaner. Emission reductions would be larger under the 2012 but only by a few percentage points. For example, total light duty vehicle PM2.5 emissions decline by 29 percent from 2025 to 2050 under the SAFE Rule. Emissions in 2050 would be 5.5 percent lower under the 2012 rule.
Will the SAFE Rule Kill People?
In modeling the SAFE Rule’s health effects, the agencies assume PM2.5 pollution causes premature death at any concentration above zero (FEIS, 4-27). That linear-no-threshold (LNT) assumption fosters the perception of a never-ending air pollution “crisis.” Or, as public choice theorists might say, LNT means the EPA will never be out of a job. For a skeptical assessment of LNT modeling, see regulatory analyst Steve Milloy’s essay, “Will the Trump Fuel Economy Proposal Create Deadly Air Pollution?”
As noted, the SAFE Rule is projected to increase upstream PM2.5 emissions from petroleum production, refining, transport, and storage compared to the 2012 baseline. SAFE Rule opponents gleefully cite the following passage:
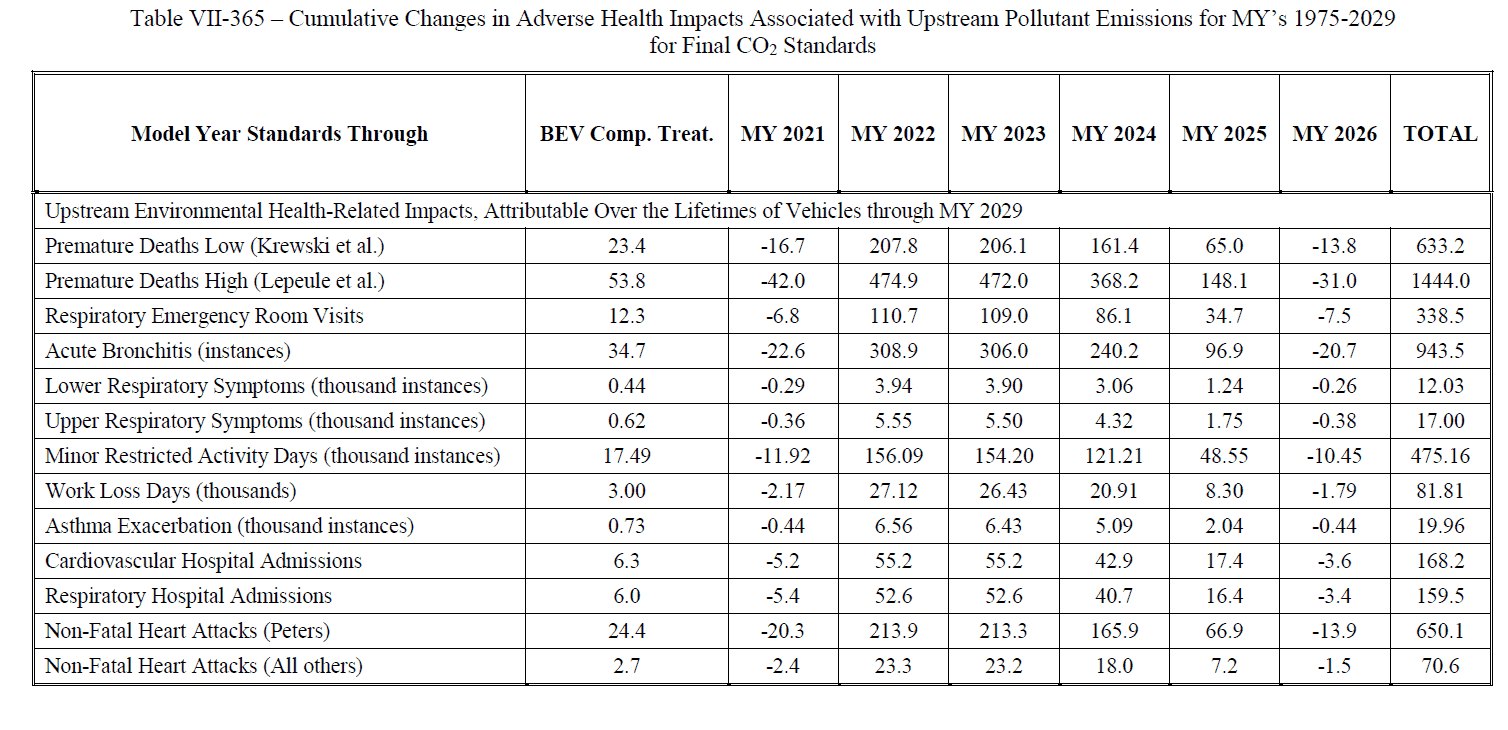
When quantified using the calendar year (CY) analysis perspective (CYs 2018-2050), under the revised final standards (compared to the previous standards), premature mortality is expected to increase from 460 to 1,010 deaths (i.e., by 0.4%), upper and lower respiratory symptoms are expected to increase by 22,000 cases (0.4%), asthma exacerbations are projected to increase by 16,000 cases (0.4%), acute bronchitis cases are projected by increase by 720 (0.4%), non-fatal heart attacks are projected to increase by 450 (0.4%), hospital admissions for cardiovascular and respiratory issues are projected to increase by 225 (0.4%) cases, and emergency room visits for respiratory issues are projected to increase by 260 (0.4%) (85 FR 25112).
Table VII-134 below (85 FR 25075) has somewhat different estimates because the cumulative health impacts are calculated out to 2068. Why 2068? The agencies assume the lifetime of a new vehicle is “up to” 39 years, and the agencies estimate the SAFE Rule’s impacts from all new vehicles manufactured through model year 2029 (85 FR 24377, 24874, 24905, 25110). At first glance the table below may appear to estimate “total” air pollution impacts over a six-year period. In fact, it estimates cumulative air pollution impacts over a 47-year period—from 2021 through 2068.
The SAFE Rule’s PM2.5 mortality impacts are dubious for several reasons. In epidemiological studies, PM2.5 health effects are chiefly associated with respiratory and heart disease. From 1980 to 2014, the U.S. respiratory illness death rate increased by nearly 31 percent. Similarly, from 1980 to 2017, U.S. asthma prevalence more than doubled. Yet since 1980, total U.S. criteria air pollutant emissions declined by 68 percent, and from 2000 to 2018, PM2.5 concentrations declined by 39 percent. Both emissions and ambient levels of criteria air pollutants and toxic chemicals such as benzene and 1,3-butadiene have been dropping for decades. U.S. air pollution trends are negatively correlated with respiratory disease mortality and asthma prevalence.
Negative correlations—higher concentrations associated with lower mortality—also turn up in PM2.5 epidemiological studies. University of Virginia Law Professor Jason Johnston discusses several examples in Scientocracy: The Tangled Web of Public Science and Public Policy (Cato Institute, 2019). Consider Krewski et al., one of the two PM2.5 mortality studies listed in Table VII-134 above. Johnston comments: “In New York [City], they found that for the mortality risks one expects to be most affected by pollution—all cause, cardiopulmonary, and lung cancer deaths—the data were extremely noisy, with the aggregate error bars occupying more space on the negative (mortality falling) side of the ledger, as fine PM concentration increases.”
More critically, the linear-no-threshold hypothesis underpinning the SAFE Rule’s PM2.5 mortality estimates is scientifically controversial. It implies that PM2.5 kills in significant numbers at concentrations below the current national ambient air quality standard (NAAQS) for fine particles (12 micrograms per cubic meter). Yet the EPA recently proposed to retain the current NAAQS on the grounds that most controlled human exposure studies, animal toxicology studies, and studies of mortality risks in areas with declining PM2.5 levels establish a PM2.5-mortality link only at exposures “well-above” the NAAQS (85 FR 24116).
Will the SAFE Rule Save Lives Overall?
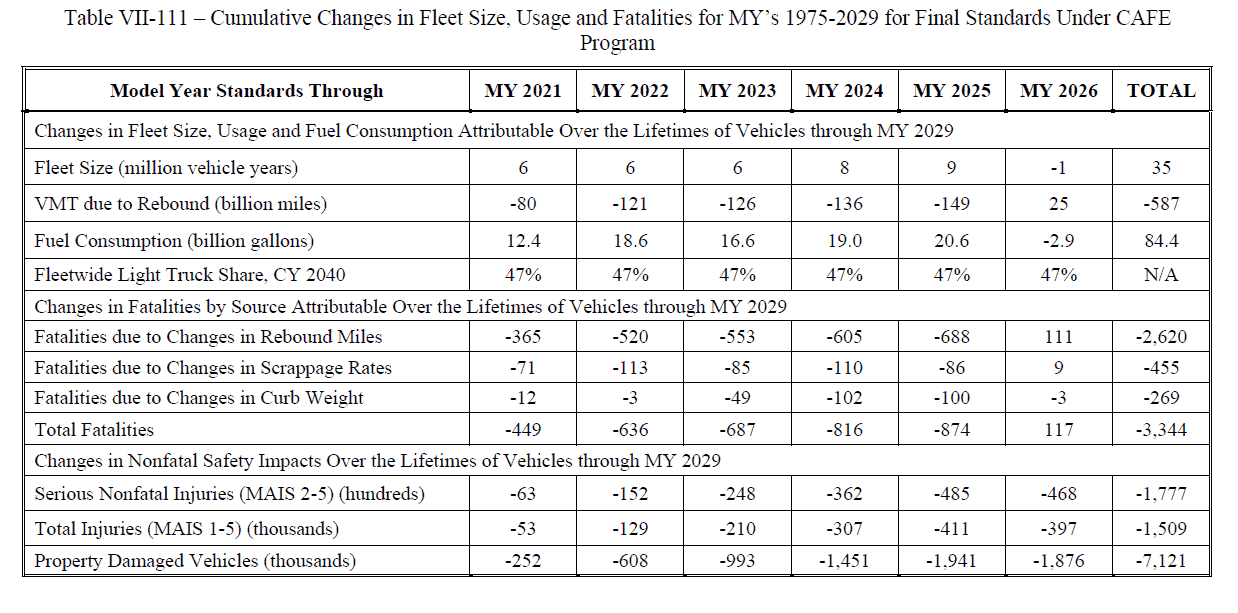
NHTSA and the EPA estimate that the SAFE Rule’s more lenient CO2 standards will “lead to 3,269 fewer fatalities over the useful lives of vehicles produced through model year 2029.” The agencies calculate as follows. The decreased need for reductions in vehicle mass to comply with the standards will avoid 238 fatalities. Accelerated fleet turnover to newer, safer vehicles will avoid a further 447 fatalities. A 607 billion-mile reduction in vehicle miles traveled due to the higher cost of fueling lower-mpg vehicles will avoid another 2,584 fatalities. They also project the relaxation of CO2 standards will avoid 177,700 serious injuries, 1,509,000 total injuries, and property damage to 7,121,000 vehicles (85 FR 25119).
Here is the corresponding table for the safety benefits of the SAFE Rule’s more lenient CAFE standards (85 FR 25034):
The SAFE Rule’s estimated lives saved are about three times greater than the estimated air pollution deaths. However, neither the estimated reduction in crash mortality nor the estimated increase in air pollution mortality is large. The impacts over the 47-year period average out to 71 fewer crash fatalities per year and 13 to 31 additional air pollution deaths per year. Vastly larger numbers of Americans die annually in light duty vehicle collisions (24,423 in 2017) and from coronary and respiratory diseases (about 647,000 and 160,201, respectively, in 2017).
Does that mean the SAFE Rule’s positive safety effects are as conjectural as its negative health effects? No, for two reasons. First, the annual death toll from vehicle crashes is a national body count rather than a statistical projection derived from sample populations. Crash mortality is far more evident and quantifiable than PM2.5 mortality.
Second, there are clear causal links between newer safer vehicles and lower mortality, between vehicle mass and crashworthiness, and between vehicle miles traveled and traffic accidents.
A final thought. Although NHTSA and EPA are required to consider all relevant factors when determining CAFE and tailpipe CO2 standards, it is inappropriate to elevate stationary source PM2.5 emissions into the paramount factor. The Clean Air Act already provides the EPA with ample authorities to address stationary source criteria air pollutant emissions, including the National Ambient Air Quality Standards (NAAQS) program, New Source Performance Standards program, Prevention of Significant Deterioration of Air Quality program, Acid Rain program, and Regional Haze program. If Congress wanted NHTSA’s CAFE program and EPA’s mobile source program to prioritize reductions of indirect stationary source emissions, it could easily have said so. It did not.