The fraud problem hidden in the subsidy debate

Photo Credit: Getty
Last fall, critics argued that under the Republican budget plan, 22.4 million people would see their Obamacare subsidies reduced to prepandemic levels. As Jeremy Nighossian pointed out at the time, that 22.4 million figure was misleading for a number of reasons. Those reasons include enrollees misreporting their incomes to qualify for subsidies and phantom enrollment from unscrupulous brokers.
In recent weeks, new information about that problematic number has come to light. The Paragon Health Institute estimates that in 2026 taxpayers will spend $25 billion funding insurance for 6.2 million improper enrollees.
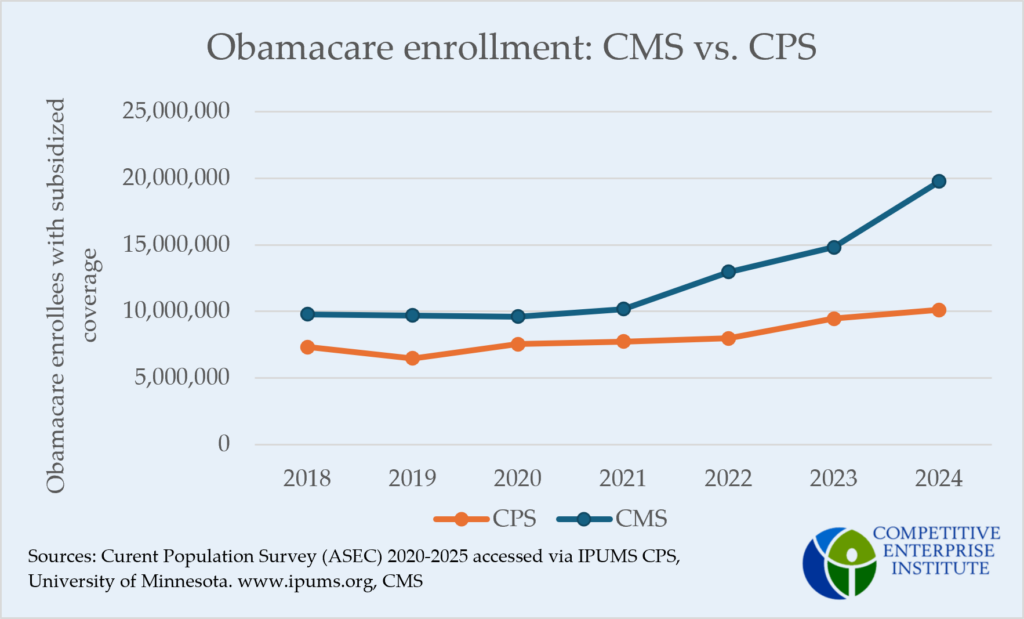
Nighohossian compared Affordable Care Act (ACA) enrollment numbers from the Centers for Medicaid and Medicare (CMS) with the Census Bureau’s Current Population Survey (CPS). He noted, “From 2018 to 2021, CMS enrollment numbers tracked with the number of people in CPS’s survey who claimed they were covered by ACA plans. However, in 2022, the first year CMS’s data would include enrollments based on the expanded subsidies, that alignment broke down.”
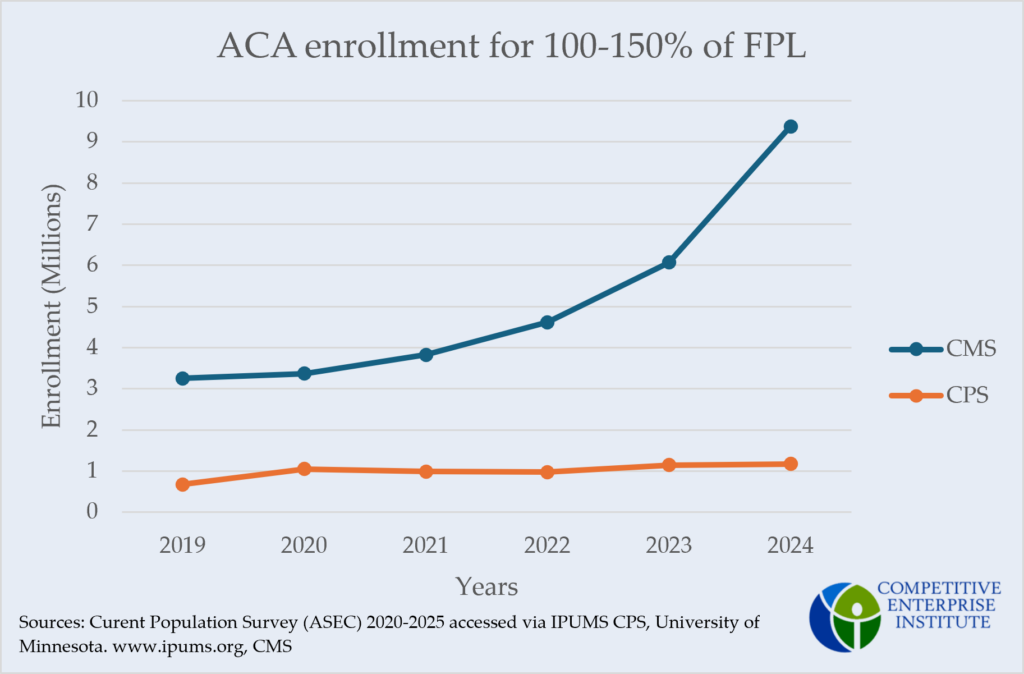
Paragon’s findings indicate this misalignment may be due to the high number of enrollees reporting income between 100 percent and 150 percent of the federal poverty line (FPL). In their most recent article on Obamacare enrollment fraud, Paragon observed 56 percent of all ACA sign-ups in 2026 reported income in this range. In certain states, Paragon found the number of people enrolled with income between 100 percent and 150 percent of the poverty level was greater than the total number of people recorded in that income group. Paragon posits three reasons why improper enrollment is concentrated within this income range:
- In non-Medicaid-expansion states, individuals earning below 100 percent of the FPL may overestimate their income to qualify for subsidies.
- Enrollees with income above 150 percent of the FPL may underestimate their income to receive the larger subsidies of lower income groups.
- Because individuals earning 100 percent–150 percent of the FPL qualify for fully subsidized plans, they are the easiest and most lucrative group for brokers and insurers to target.
If these reasons have caused the recent national enrollment increases, official enrollment should pull away from survey estimates most conspicuously in the 100 percent–150 percent FPL range. In other words, the split Nighohossian found should be largely contained in the 100 percent–150 percent group. The results from separating CMS official enrollment and CPS survey data into income groups support that contention.
CMS enrollment compared to CPS enrollment for 150-400 percent of FPL
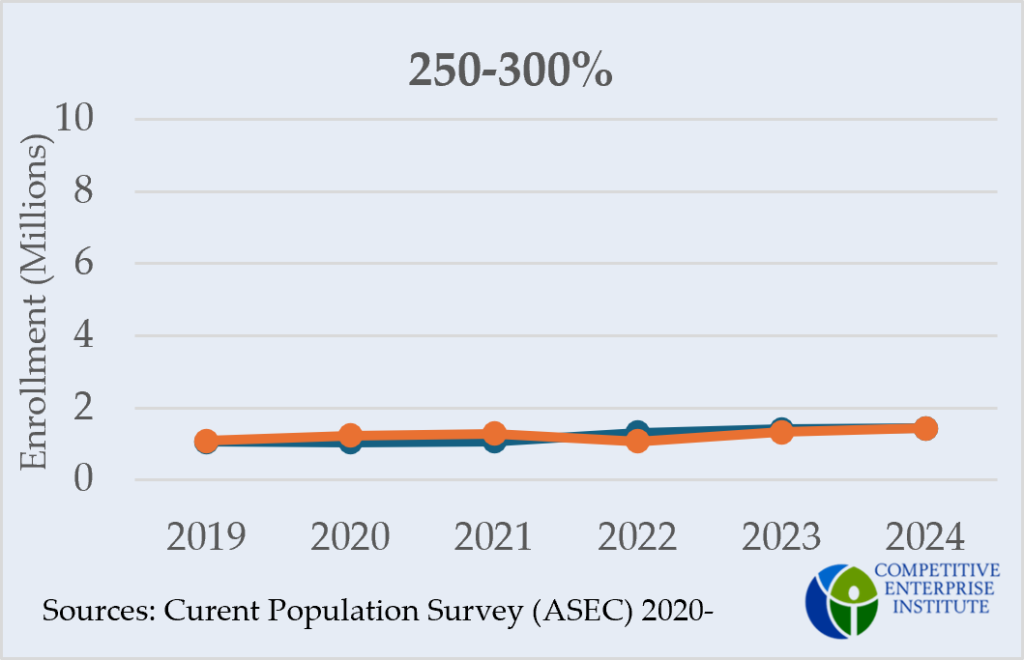
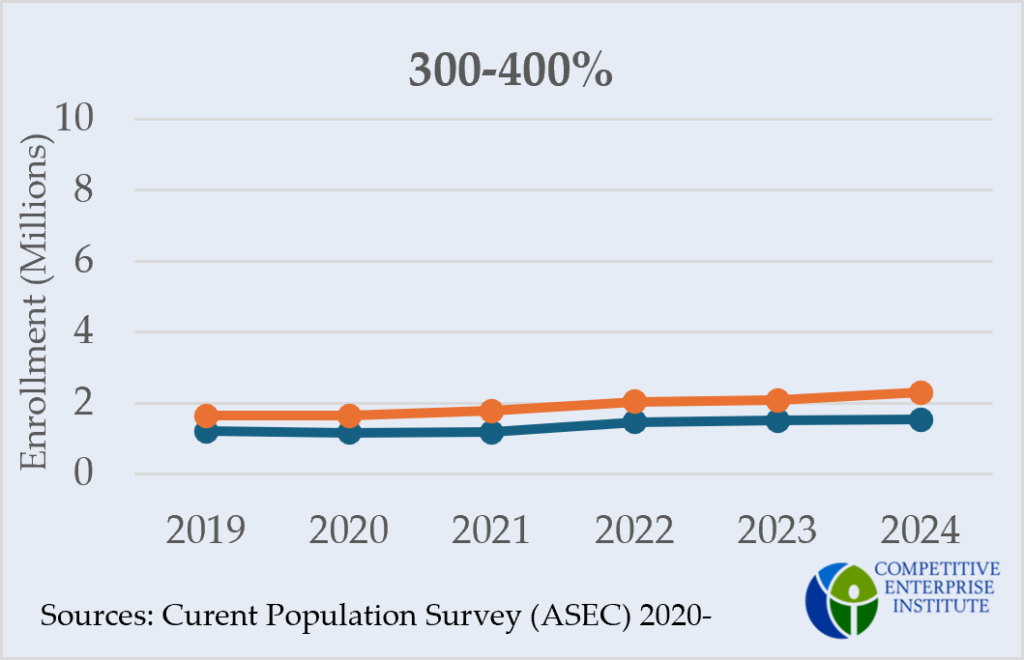
Note that the official enrollment totals exclude New York, Minnesota, and the District of Columbia, which use their own health care programs to cover residents reporting income below 200 percent of the FPL. Idaho and Nevada are also omitted because of missing data in certain years. Subsequently, the official enrollment totals, particularly for the 200 percent– 400 percent FPL groups, are lower than their true national totals. Unless enrollment trends in the omitted states differ substantially from national trends, however, their exclusion should not affect the parallel alignment of the higher-income groups.
Comparing CMS enrollment numbers with CPS survey estimates across income groups reveals a significant divergence only in the 100 percent–150 percent FPL category. Beginning in 2022, as in Nighohossian’s figure, official enrollment begins to pull away from survey data. This trend intensifies through 2024 with survey data remaining at pre-ACA-expansion levels while official enrollment almost triples.
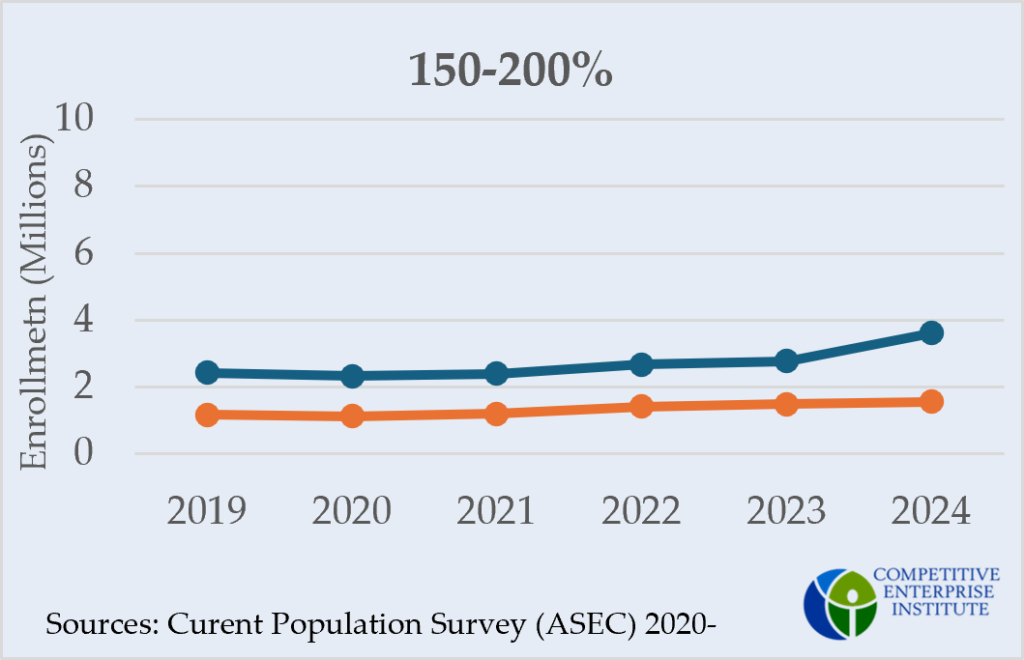
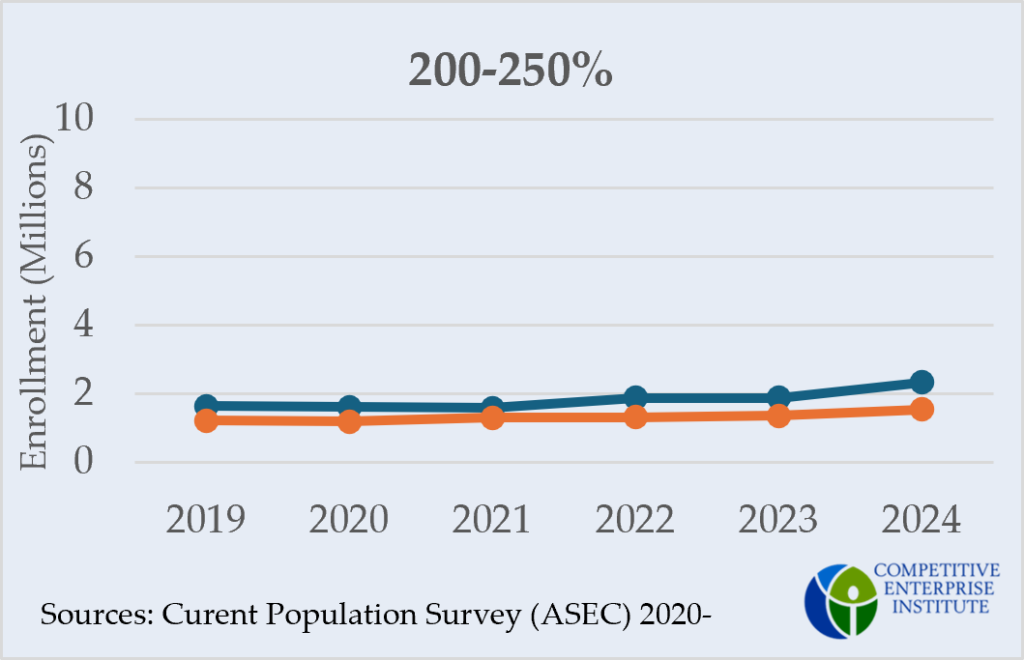
In the other four income groups—determined by ACA subsidy cutoffs—survey estimates nearly parallel official enrollment across all years. The one possible exception is the 150 percent–200 percent group in 2024.
Nighohossian found a difference of 10 million between official enrollment numbers and survey estimates in 2024. The 100 percent–150 percent FPL group appears to account for 8 million or 80 percent of that national difference.
Medicaid unwinding
One explanation for the jump in official enrollment from 2023 to 2024 is Medicaid unwinding. When the COVID continuous coverage requirement of the Families First Coronavirus Response Act ended in 2023, people who had been permitted to remain on Medicaid, even when they no longer qualified, were removed. These individuals, likely with income still near the Medicaid cutoff, turned to ACA Marketplace insurance. As such, we should expect to see a spike in official enrollment from 2023 to 2024 in the 100 percent–150 percent group specifically.
What Medicaid unwinding cannot explain, however, is the growing difference between official enrollment and survey data, which had run parallel prior to the expansion of the subsidies. Those disenrolled in Medicaid would be more, not less, aware of their health insurance coverage. What was free under Medicaid must now be considered when determining monthly expenses, making these enrollees more likely to accurately report coverage information on a survey like the CPS. So, if the 2024 official enrollment spike consisted of legitimate sign-ups in Medicaid unwound enrollees, survey data should reflect that. The CPS’s 31,177-person bump from 2023 to 2024 in the 100 percent–150 percent FPL range, however, is nowhere near the 3.3 million official enrollment spike in that same group and year.
However, Medicaid unwinding was not completed until August of 2024, just before the 2025 Open Enrollment Period. When the 2025 CPS data is released this September, we will see if survey data finally catch up to CMS data. If not, it will remain hard to attribute the recent increases in official enrollment to legitimate sign-ups.
The broader conversation
In a letter to The Washington Post, David Merritt points out Census Bureau data—and the CPS with it—can be unreliable, often undercounting low-income groups. His critique is no doubt true. It accounts for the 100 percent–150 percent FPL group’s consistent 2.5-million underestimate from 2019 through 2021. What Merritt’s critique fails to explain is why discrepancies attributed to undercounting have metastasized in recent years. A better understanding of how low-income individuals fit in the health insurance system may be the key to ensuring the ACA serves its intended purpose without wasting taxpayer dollars.