Chapter 2: Why we need a regulatory budget

Federal spending programs are funded either by taxes or by borrowing, with interest, from future tax collections. The public can readily inspect the costs of departments, agencies, and programs in a formal federal budget complete with historical tables, Congressional Budget Office publications and other compendia. But while the federal government publicly discloses fiscal outlays and accompanying tax obligations, that same transparency does not apply to regulatory costs and burdens, which are equivalent means by which the federal government carries out its aims. That makes them even less disciplined than spending, which in turn means Congress might sometimes find it easier to act via off-budget regulation rather than tax-and-spend policy. And even when regulatory compliance costs do prove burdensome and attract criticism, Congress can escape accountability by blaming agencies.
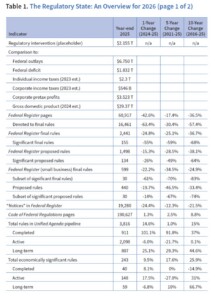
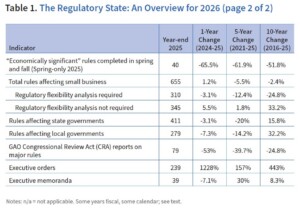
As a reality check on the need for regulatory budgeting, disclosure of federal spending obviously has not restrained deficits and runaway debt. Yet transparency is vital for wrestling spending back under control. In similar fashion, policymakers should publicly disclose regulatory costs and burdens to the fullest extent possible. Table 1 provides an overview of the 2025 federal regulatory enterprise discussed in the following pages, as well as a flavor of the kinds of components to embed in a regulatory report card that officials ought to provide.
About this $2.153 trillion regulatory cost placeholder
A regulatory budget would keep Congress and the executive branch more honest about the regulatory costs they are offloading to the private sector. However, total regulatory costs are immeasurable, often unfathomed, and have not and cannot be truly calculated. It has been a quarter century since the federal government even tried.
There are no objective metrics to assess, apart from raw compliance outlays on the likes of equipment and personnel. The subjective and internally felt opportunity costs of regulation cannot be calculated by an outsider any more than economies can be centrally planned.
Make no mistake: there is no agreement on the costs and benefits of regulation, whether individually or in the aggregate, and there never will be. Biden’s now-revoked Executive Order (EO) 14094 in large part denies that interventions are costs at all. The Biden White House even argued that water heater regulations and forced replacement would “help consumers save about $11 billion a year.”
Nonetheless, demanding some aggregate regulatory cost baseline is a reasonable ask.
For purposes of maintaining a conservative accounting, Ten Thousand Commandments has employed a roughly $2 trillion estimate annually for many years. This approach is based largely, but not entirely, on the federal government’s own reckonings that emerged from the mid- to late 1990s reform era encompassing compliance costs, economic and gross domestic product (GDP) losses, social, and other costs, supplemented with irregular White House updates on select costs and benefits.
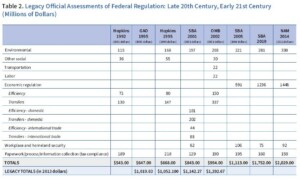
Decades have passed since Washington attempted to measure the aggregate regulatory state. The Office of Management and Budget’s (OMB) 2002 estimate of $954 billion in 2001 dollars (see Table 2) for economic, environmental, and social regulation would translate to over $1.73 trillion now. A lot has happened since then, including the addition of such rulemaking engines as the Department of Homeland Security, the Dodd-Frank financial law, the Affordable Care Act, and years of federal pushes against core necessities like fossil fuels and functional household appliances.
The recent five years in particular are noteworthy: the CARES Act, the CHIPS and Science Act, the Infrastructure Investment and Jobs Act (IIJA), and the Inflation Reduction Act all expanded government control and have redirected private resources toward government-chosen ends via downstream rulemaking, but also via contracting, procurement, partnerships, and attendant regulation that can bypass normal notice and comment procedures, quantification, and the courtesy of appearance in the Federal Register.
Notable Biden-era leveraging of these enactments includes broadband social-policy schemes such as the IIJA-rooted rule on Prevention and Elimination of Digital Discrimination and its build-out mandates and price controls, and the Commerce Department’s National Telecommunications and Information Administration’s haphazard allocation of over $42 billion in Broadband Equity, Access, and Deployment (BEAD) funding with social agenda strings not contained in the IIJA legislation itself. The Trump agenda involves unwinding in some instances, but escalating government in others.

A 2023 National Association of Manufacturers (NAM) report, titled The Cost of Federal Regulation to the US Economy, Manufacturing and Small Business, finds regulatory costs of $3.079 trillion for 2022 (in 2023 dollars). Employing bottom-up approaches and top-down regression modeling rooted in “academic literature finding that macroeconomic performance and living standards are systematically linked to regulatory policies,” NAM assesses regulatory costs this way:
- Economic: $2.067 trillion.
- Environmental: $588 billion.
- Occupational safety/heath and homeland security: $124 billion.
- Tax compliance: $300 billion.
According to the report, the $2.067 trillion economic component encompasses rules affecting decision-making in, for example, “markets for final goods and services, markets for physical and human resources, credit markets and markets for the transport and delivery of products and factors of production.” Such interventions “affect who can produce, what can (or cannot) be produced, how to produce, where to produce, where to sell, input and product pricing and what product information must be or cannot be provided.” Direct compliance outlays by firms, which understate total regulatory costs, include “investments in capital equipment, expenditures on O&M [operations and maintenance], payments to outside consultants, in-house employees devoted to compliance activities and so forth.” For reference, the last column of Table 2 also depicts NAM’s earlier 2014 estimate of $2.029 trillion.
Other recent assessments find aggregate regulatory costs even higher than NAM’s $3.079 trillion reckoning. Other studies explore sub-components of regulatory costs. For example, a report using 2002-2014 data on occupational tasks and firms’ wage spending finds that the “average US firm spends between 1.3 and 3.3 percent of its total wage bill on regulatory compliance” and that the “wage bill devoted to regulatory compliance workers in 2014 was between $79 billion and $239 billion, depending on the stringency of the regulatory compliance measure employed, and up to $289 billion when capital is also added.”
In law but not in practice, OMB remains charged with publishing an annual survey of regulation known as the Report to Congress on the Benefits and Costs of Federal Regulations and Agency Compliance with the Unfunded Mandates Reform Act. The report invokes the Regulatory Right-to-Know Act, but the aggregate cost assessment that the law requires has not appeared in two decades. Those were replaced by a 10-year lookback, thereby conveniently omitting the first years of the 21st century and the entirety of the 20th.
In recent years, even the 10-year lookback vanished. Now the report itself has disappeared, with a fiscal year 2023 edition the newest available. Even before this, cost-benefit analyses were few and largely self-reported by agencies, with OMB acknowledging that, “All estimates presented… are agency estimates of benefits and costs, or minor modifications of agency information performed by OMB.”
In 2023, the White House released three catch-up draft editions of the Report to Congress in a composite format encompassing fiscal years 2020–2022. Like its predecessors, the Report to Congress contains a limited overview of executive agency major rules and partial monetary quantification of some costs and benefits. As the first three rows of Table 3 show, only 31 major rules featured both benefits and costs monetized. This category is what administrations point to when touting net benefits of the regulatory enterprise. However, another 56 major rules had costs alone quantified, which OMB historically does not sum up.
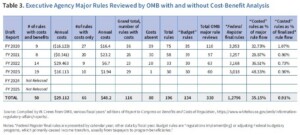
Next, the aforementioned FY 2023 report appeared with 19 rules featuring both costs and benefits, and another 10 featuring costs only. These four reports remain the most recent available, within which OMB formally reports on a total of 330 major rules over the 2020–2023 roaring 20s period covered in Table 3. Meanwhile, 12,796 rules were finalized in the Federal Register during the same time frame, and untold numbers of sub-regulatory materials such as agency memoranda, guidance documents, bulletins, circulars, and manuals that appear neither in OMB’s annual assessments, nor the Federal Register.
Although the Report to Congress covers agencies’ compliance with the Unfunded Mandates Reform Act, the independent agencies, which include formidable regulators such as the Federal Communications Commission (FCC), the Federal Trade Commission (FTC) and financial regulatory bodies, have been exempt from OMB cost-benefit review until Trump’s EO 14215, “Ensuring Accountability for All Agencies.” Overall, as Table 3 also shows, about 35 percent of the reviewed major rule subset features quantitative cost estimates. Beyond designated major rules, the proportion of rules with cost analysis averages less than one percent. Historically, the ratios are similar.
Overall, Table 3 shows 50 rules with both benefits and costs quantified, adding $29.1 billion to annual regulatory costs. Those specific rules, itemized in Appendix A, cover vehicle fuel efficiency, building energy conservation, and industrial admissions standards, as well as deregulatory first Trump term moves on waters of the United States. That $29.1 billion in costs accumulated during this brief 2020s timeframe is noteworthy, given that the first two of the four fiscal years represented Trump savings, and given that the first 20 years of the century found OMB’s reports noting $151 billion in annual costs added, averaging around $7 billion annually.
The 66 rules noted for 2020–2023 in Table 3’s fourth column with costs alone quantified add $48.2 billion to ongoing annual costs. Appendix B details this category of rules for fiscal years 2020–2022, which included rules such as COVID-19 paid leave. During the 2002–2019 period, there were dozens of such cost-only rule disclosures, with high-end cost estimates of $53.71 billion.
These latest official estimates and prior editions of this report serve as the basis for our new aggregate cost placeholder. The 2022 edition of Ten Thousand Commandments employed an estimate of $1.927 trillion for annual regulatory costs that had incorporated OMB Report(s) to Congress through FY 2019, before these updates appeared, making it a touchpoint of sorts for dividing the first two decades of the 21st century. Incorporating OMB’s 2020s reports’ $77 billion in incremental annual costs, as well as increments for independent agency paperwork and a slight inflation adjustment for economic regulatory costs, allows us to adjust the 2025 aggregate estimate to $2.155 trillion, which serves as our starting point for 2026.
The paperwork increment for independent agencies is worth noting. Mirroring the tardy Report to Congress, five laggard Information Collection Budget of the US Government (ICB) volumes appeared in 2023 in belated compliance with the Paperwork Reduction Act of 1980. An FY 2023 edition followed in July 2024, and reported that 10.5 billion hours were required to complete mandatory paperwork from 39 departments, agencies, and commissions.
The 10.5 billion annual hours Washington says it takes to complete its paperwork translates into the equivalent of 14,983 human lifetimes every year. For our purposes, executive branch agencies’ paperwork costs are assumed to have already been incorporated into the Report to Congress.
However, since independent agencies’ costs are not included, the release of paperwork reports allowed the incorporation of a small amount of incremental paperwork “dead tape” costs here. Assuming $35 per hour, independent agency costs stand at $32.49 billion.
Costs are actually higher, though, since apart from the formal ICBs, paperwork is tracked online and shows stark increases in recent years. As of January 23, 2026, OMB’s website reported government-wide totals for Active Information Collections of 11.7 billion hours. So paperwork costs are actually higher, but since independent agency breakdowns are not offered, the FY 2023 figure is retained here.
So far then, the $2.155 placeholder stands pat as the public awaits FY 2024 and 2025 OMB cost updates. We next adjust slightly for legacy economic costs that OMB’s reports do not cover. Given that the NAM report’s economic cost component alone exceeds $2 trillion and building from the legislative interventions of the past two decades, it is appropriate to cautiously recognize higher economic costs than we have pointedly left flat since OMB referenced some $487 billion in 2001 dollars (Table 2). This is in keeping with the imperative to have official federal reports occupy center stage and to have their own inadequacy spur upgrades and reform.
Earlier editions of this report incorporated a cautious $399 billion baseline in 2013 dollars rather than OMB’s $487 billion. Updating that government-rooted but downsized figure to 2024 dollars yields a $552 billion marker we employ. (The figure in this report’s 2025 edition was $539 billion) That is far below NAM’s $2.067 trillion figure for economic regulation alone, but it serves our purpose of establishing something like an official legacy baseline and of appealing to Congress to enforce OMB compliance with the Regulatory Right-to-Know Act. That brings us to $2.168 trillion.
Now we make a slight adjustment based upon the Trump administration’s Final Accounting for 2025, in lieu of the formal OMB reports for 2024-2025 needed to formally fill the gap. Rather than adding costs, this adjustment will reflect the Trump administration’s year-end assertion of regulatory cost savings.
As noted, the Trump administration claims agencies issued 646 deregulatory actions and five significant regulatory actions, and that those eliminations save approximately $212 billion in present-value costs across government. In the section “Annualized Value v. Present Value” in the Final Accounting, the White House notes that with a “perpetual time horizon and a 7 percent discount rate, a present value can be transformed into its contemporaneous annualized value by multiplying by 0.07.” Performing that simple calculation yields an annual savings of $14.830 billion.
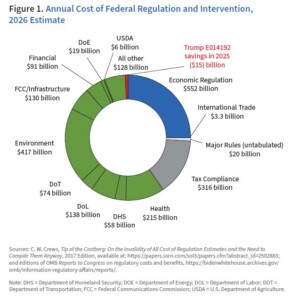
Incorporating this figure into our overall placeholder brings it to $2.153 trillion, as reflected in Figure 1, which is nearly unchanged from last year’s $2.155 trillion. Trump’s $15 billion savings don’t belong in a pie chart featuring regulatory costs, of course, but are depicted in Figure 1 to illustrate the small relative amount of savings compared to overall costs, and the scale necessary to substantially shrink the regulatory state. What Trump saved in cuts, inflation everywhere else took away. This figure serves as a conservative baseline to compare with metrics such as federal spending aggregates.
$212 billion of cost savings in the administration’s Completed Actions for Fiscal Year 2025 under Executive Order 14192 (a report accompanying the Final Accounting). The largest, roughly $129 billion, derives from the Treasury Department’s Financial Crimes Enforcement Network’s revision to its Beneficial Ownership Information reporting rule rooted in the 2020 Corporate Transparency Act. This change eliminated the requirement that certain US LLCs and corporations disclose personal information about owners and controllers.
The other two outsized contributors were the Transportation Security Administration’s decision to permit airline passengers to keep their shoes on during security screening ($25 billion claimed), and the Food and Drug Administration’s rollback of a rule that had treated laboratory-developed tests as medical devices subject to extensive review and reporting requirements ($20 billion).
These cuts are not what anyone could seriously envision as deconstructing the administrative state, but it is the case that major regulatory initiatives of the conventional sort that appear in the Federal Register are not being added. The Final Accounting is a bridge for present purposes. Should OMB release overdue cost-benefit reports, these will be included in Table 3 in next year’s Ten Thousand Commandments.
OMB transparency, while useful, has three serious problems. One, official figures from a quarter century ago are sketchy and detached from modern reality. Two, they are incomplete and miss large swathes of the overarching regulatory state. Three, they were never replaced and regularly updated as required by law.
Critics of cost-benefit analysis claim that many old rules like those in the legacy federal reports no longer impose costs because of technological change or adaptation. The compounding distortions of regulation over time make that assertion untrue. Nonetheless, retaining legacy government-reported regulatory categories keeps the inadequacy of official government reporting front and center, and can spur change enforced by some future Congress. This report’s embedded $418 billion annual estimate for legacy environmental costs, for example, like our economic cost placeholder, stands well below NAM’s $588 billion tabulation for that category.
Indeed, an extraordinary amount of federal economic and social intrusion is not captured as costs of regulation or coercive intervention whatsoever in any of the formats that purport to address or score them. Even mere numbers of rules were not tabulated before 1976. Like the NAM report, other assessments acknowledge regulatory costs far beyond official reckonings, including former White House Council of Economic Advisers chief economist Casey Mulligan’s report, Burden Is Back: Comparing Regulatory Costs Between Biden, Trump, and Obama.
As the Competitive Enterprise Institute’s founder Fred L. Smith, Jr. framed this dilemma, “The genius of the Progressives in the late 19th century was to preempt or push large sectors of the emerging future (the environment, schools, electromagnetic spectrum, infrastructure, welfare, the medical world) into the political world.” In that vein, this report’s Appendix C: A Partial Compilation of Unmeasured and Disregarded Costs of Federal Intervention presents samples of more than a century and a half of economic consolidations and administrative state escalations that escape reckoning altogether.
These outside-the-framework costs appear in numerous policy areas: antitrust regulation; federally steered public-private partnerships (local tap water, electric vehicle charging networks, hydrogen hubs, regional technology hubs, artificial intelligence, and so on); subsidies and grants; common carriage approaches that derail property rights evolution; resource-use restrictions on western lands; and the too-big-to-fail stance toward large financial institutions.
To the extent people regard tariffs as costs rather than the benefits Trump claims they comprise, one could conceivably double this report’s cost estimate. At a January 29, 2026 cabinet meeting, Trump remarked, “we’ve taken in hundreds of billions, even trillions of dollars,” attributing some of that to companies returning to the US.
Administrative state convention routinely disregards political failure, underplays the importance of private property, and even fails to appreciate its own role in aggravating inequality. Even the 134 budgetary and funds-transfer rules noted in Table 3 displace what would have been private activity in, for example, retirement and health care funding, distorting those markets in perpetuity. Washington’s inducement of dependency on federal government transfers is as fundamental as social regulation and the custodial administrative state can possibly get, yet it is not counted among costs.
These are some of the many ways this report’s $2 trillion in costs of regulatory intervention understates the scale of federal involvement in the economy. This gives us a rough idea of how much agencies understate or ignore the costs they impose.
Regulatory costs have only compounded since the government bothered to tabulate aggregate social, environmental, and economic costs two decades ago. Table 3 and Appendices A and B depict tens of billions of dollars added in only the most recent four years by a handful of more than 400 federal agencies and subunits.
Regulation, spending, and deficits
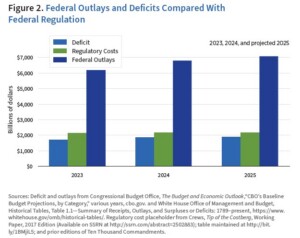
Having laid some groundwork and perspective, comparing regulatory costs with federal taxation and spending helps better gauge the size and scope of the federal government. According to the newly released Congressional Budget Office (CBO) Budget and Economic Outlook, covering FY 2025 and projections for FY 2026–FY 2036, the federal government posted $7.010 trillion in outlays on revenues of $5.235 trillion in 2025, for a deficit of $1.775 trillion.
According to the CBO, outlays are expected to cross the $8 trillion mark in 2028 and top $10 trillion annually by 2033. Deficits will again exceed $2 trillion by 2028 and are projected to grow as far as the eye can see, passing $3 trillion in 2036.
Figure 2 compares deficits and outlays for fiscal years 2024 and 2025, and projected amounts for FY 2026, along with regulation. Regulation of $2.153 trillion now stands at about 31 percent of outlays and easily exceeds 2025’s $1.775 trillion deficit. For additional perspective, the NAM regulatory aggregate cost figure of $3.079 trillion equals 44 percent of 2025 outlays.
Regulatory costs compared with taxes and profits
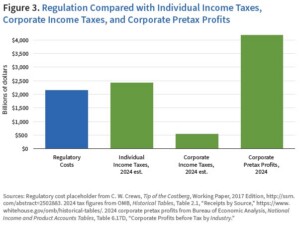
Figure 3 provides a snapshot of the $2.153 trillion US regulatory burden compared with taxes and corporate profits. Individual income tax revenues stood at $2.426 trillion for 2024, while corporate income tax revenue was $529.9 billion for 2024.
Regulatory costs are four times corporate income taxes and 89 percent the level of individual income taxes. The NAM annual regulatory cost figure of $3.1 trillion, on the other hand, exceeds both corporate and individual taxes combined ($2.956 trillion).
In addition, this report’s $2.153 trillion regulatory cost estimate equals 51 percent of 2024 corporate pretax profits of $4.179 trillion, while NAM’s $3.1 trillion regulatory estimate would consume 74 percent of corporate profits.
Regulatory costs compared with US GDP
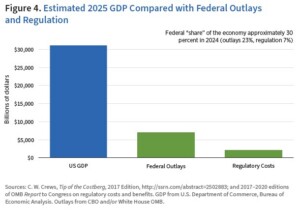
In January 2026, the Commerce Department’s Bureau of Economic Analysis estimated 2025’s US current-dollar GDP at $31.1 trillion. Our $2.153 trillion regulatory cost figure is equivalent to approximately 7 percent of GDP. NAM’s $3.067 trillion reckoning would put regulatory costs at just under 10 percent of GDP. Combining $2.153 trillion in regulatory costs with federal FY 2024 outlays of $7.01 trillion, the federal government’s share of the economy stood at $9.163 trillion in 2025, or 30 percent of GDP (see Figure 4). None of these metrics include state and local spending and regulation.
US regulation compared with global economies
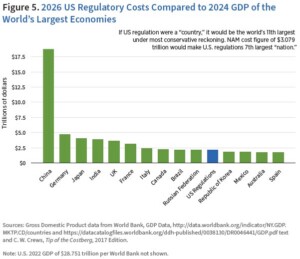
If US regulatory costs of $2.153 trillion were a country, it would be the world’s eleventh-largest economy, ranking just ahead of the Korean Republic with its $1.875 trillion 2024 GDP, and behind the Russian Federation at $2.174 trillion (see Figure 5). Using NAM’s cost estimate, federal regulation would be the world’s seventh-largest economy, just behind France’s $3.16 trillion GDP.
The US regulatory figure of $2.153 trillion not only exceeds the output of many of the world’s major economies, but also greatly outstrips even those ranked as the freest economically by two prominent annual surveys of global economic liberty. Figure 6 depicts the 2024 GDPs of the seven nations ranked in the top 10 common to both the Heritage Foundation’s Index of Economic Freedom and the Fraser Institute and Cato Institute’s Economic Freedom of the World report. The Fraser/Cato index ranks the United States 5th, whereas the Heritage report ranks the United States 26th.

A hidden tax on household budgets
Regulation is sometimes called a hidden tax for good reason. Ordinary income and FICA taxes are itemized on pay stubs and calculated on tax returns. Most regulatory costs are instead embedded in prices of goods and services or reflected indirectly in slower economic growth, never showing up on a receipt or an annual statement. Businesses pass regulatory costs on to consumers, just as they do the corporate income tax. Other regulatory costs may find their way to households in the form of lower returns on retirement funds and other investments, as well as fewer investment opportunities and more paperwork.
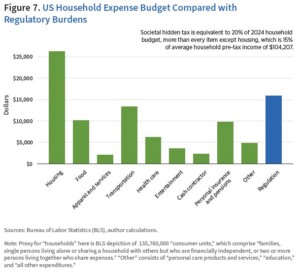
The true incidence of regulatory costs is of course impossible to precisely calculate. But by assuming a full pass-through of all regulatory costs to consumers, one can look at American households’ share of regulatory costs and compare it with total annual expenditures at the household level, as measured by the Department of Labor’s Bureau of Labor Statistics.
For America’s 135.766 million households, average 2024 pretax income was $104,207. Assuming full pass-through to individuals of $2.153 trillion in federal regulatory costs, US households pay $15,859 annually in embedded costs ($2.153 trillion in regulation divided by 135,760,000 households (consumer units in BLS parlance). This is roughly 15 percent of average income before taxes, and more than that as a share of after-tax income. NAM’s $3.079 trillion regulatory assessment implies costs of $22,679 per household, or 22 percent of income.
Federal regulatory costs amount to up to 20 percent of the typical household’s expenditure budget of $78,535. At $15,859, the hidden regulatory tax exceeds every annual household expenditure item except housing (see Figure 7). The average US household spends more on hidden regulation than on health care, food, transportation, entertainment, apparel, services, or savings. NAM’s $3.079 trillion regulatory cost translates into $22,680, or 29 percent of household expenditures.
Examining and reflecting upon costs is one way to assess the size and scope of federal regulation. Another is to assess the amount of regulatory material that agencies publish each year in sources like the Federal Register and the Unified Agenda of Federal Regulatory and Deregulatory Actions.