Chapter 3: What Comes after “Trillion”? The Unknowable Costs of Regulation and Intervention
The cumulative high end for costs in the three recent fiscal years is around $4.6 billion, compared to around $105 billion for the prior 10 years. These are not representative of all regulatory costs, but they are what is available, and are useful markers. While OMB’s reports did not tally them, some rules with costs but not benefits tabulated are presented as well. Going back to 2002, there are dozens of such rules, with high-end cost estimates that max out at $54 billion.
As OMB acknowledges in the 2018, 2019, and 2020 Report to Congress: “As has been the practice for many years, all estimates presented … are agency estimates of benefits and costs, or minor modifications of agency information performed by OMB.” Ultimately, the regulators themselves decide what counts as major. OMB notes also that its report “does not purport to demonstrate all costs or benefits from federal regulation; instead, the report summarizes the anticipated costs and benefits that the Regulatory Impact Analyses (RIAs) of individual final rules reported for those rules.” The report acknowledges an “often-overlooked detail”—that “the totals listed … include only the benefits and costs for the minority of rules for which both those categories of impacts were estimated.”
Overall, the 2018–2020 consolidated Report to Congress encompasses only 145 “major” rules, a small number compared with the more than 9,500 rules—from large to small to inconsequential—issued during the corresponding calendar years. Of the 145 major rules, the three-year report featured only 30 rules with both benefits and costs “quantified and monetized” and another 28 with costs alone quantified, in some cases partially. OMB asserts the major rules it reviews, including budget rules, “represent approximately one-fourth” of the significant regulatory actions reviewed by OMB.
Of the hundreds of executive agency major rules issued since 2001 (among tens of thousands of nonmajor rules issued), a relative handful received OMB-reviewed quantified cost analysis, let alone cost and benefit analysis; overall about 38 percent had quantitative cost estimates. When one looks beyond the officially self-designated “major” rules, the proportion of all rules with any cost analysis averages less than 1 percent.
OMB references a 2004 claim that major rules reviewed account for the bulk of regulatory costs. Earlier OMB reports had been more open to the significance of indirect and unaccounted costs. Even today, OMB does not review independent agency rules like those of the FCC or financial regulatory bodies. OMB review fails to capture entire categories of economic and social regulation, as depicted in Box 3 later in this report. Even the Unfunded Mandates Reform Act, surveyed in the Report to Congress, exempts a great deal of regulatory intervention from critical analysis. So what OMB documents arguably bears little relation to the costs of government regulation throughout society.
Transfer and budget programs, unless directly related to national defense or criminal justice, are inherently interventionist and regulatory in nature. Yet the costs and market distortions caused by such federal spending are not counted, nor are the deadweight effects of such budget rules, even when the federal government has taken over a substantial portion of a function such as retirement and senior health care. Pell Grants alter private college financing. Federal medical programs have altered the medical market to such an extent that single-payer insurance is now contemplated. Washington’s expansion of middle-class dependency on federal government transfers is about as fundamental as social regulation gets, yet it is not counted as costs.
The fundamental problem with the regulatory Report to Congress is that net-benefit analysis helps fuel indefinite government expansion. Creative regulators can alternate between maximizing net benefits—as in OMB’s 19-year-old “Circular A-4” guidance on regulatory analysis—and claiming that benefits “justify” costs as specified in Executive Order 12866. Cost–benefit analysis is conveniently mute on such questions as benefits that may have accrued if an agency’s “regulatory budget” allocation belonged to another agency instead. So there exists no genuine net-benefit pursuit adopting a wider perspective than that of agencies in isolation, especially with OMB’s abandonment of an aggregate assessment. In addition, costs of regulatory dark matter—such as agency memoranda, guidance documents, bulletins, circulars, and manuals—do not appear in OMB’s annual assessments. Executive orders’ effects are unaccounted for. Most is left out, despite OMB’s having had decades to practice.
In contrast to the traditionally narrow OMB focus, a 2019 report from the Trump-era Council of Economic Advisers, The Economic Effects of Federal Deregulation, pointed to hundreds of billions in direct and indirect annual savings from changes not just in a set of rules removed, but in approaches to regulation as such:
The Council of Economic Advisers (CEA) estimates that after 5 to 10 years, this new approach to Federal regulation will have raised real incomes by $3,100 per household per year. Twenty notable Federal deregulatory actions alone will be saving American consumers and businesses about $220 billion per year after they go into full effect. They will increase real (after-inflation) incomes by about 1.3 percent. …
This new approach to regulation not only reduces or eliminates costly regulations established by prior administrations but also sharply reduces the rate at which costly new Federal regulations are introduced. The ongoing introduction of costly regulations had previously been subtracting an additional 0.2 percent per year from real incomes, thereby giving the false impression that the American economy was fundamentally incapable of anything better than slow growth.
In touting deregulatory actions and their purported benefits in July 2020, the White House claimed, “President Trump has signed 16 pieces of deregulatory legislation that are expected to result in a $40 billion increase in annual real incomes.” The administration’s deregulatory actions would save additional billions not entirely captured in the year-end updates on one-in, two-out. For example, the White House claimed that the “implementation of the SAFE [Safer Affordable Fuel-Efficient] Vehicles Rule is estimated to increase the real incomes of Americans by $53 billion per year over the 2021–2029 period.”
During the coronavirus outbreak, the CEA also estimated the savings from regulatory streamlining related to pandemic recovery:
The total value of more widespread adoption of telemedicine would be approximately $325 billion per year. Reducing FDA approval times by relaxing overly burdensome impediments to drug development would have a net present value of $1.9 trillion if approval times are sped up by one year, $3.9 trillion if sped up by two years, and $5.9 trillion if sped up by three years. Expanding occupational licensing deregulation for nurse practitioners nationwide could result in $62 billion in cost savings for patients annually.
Many such changes are on the chopping block in the Biden administration, but the takeaway from the CEA approach is that far greater costs exist that can be attributed to regulation than the annual Report to Congress has ever addressed. That perspective would include, for example, greater attention to the ways regulation and infrastructure spending affect not only current jobs, but also entrepreneurs’ inclination to create new jobs in the future.
Inevitably, the CEA’s assertions in its 2019 Economic Effects of Federal Deregulation report were blasted as “bad fiction” by progressives. But if there is validity to the proposition that such regulatory liberalizations (and those adopted during COVID-19) reduced costs substantially, it is also reasonable to presume prior increases in regulation will have added billions of dollars to what has been depicted in the normal compliance measures. Massive government spending and steering without issuing a rule is also a form of regulation.
As it stands, the federal bureaucracy, even with all the vast resources at its disposal, has done nothing to fulfill its duty to assess the aggregate effects of regulation and intervention in which it engages. The Small Business Administration (SBA) last published an assessment of the federal regulatory apparatus in 2010, pegging regulatory compliance costs at $1.75 trillion for 2008, but that report was discontinued and has not been replaced. The primary purpose of the SBA report series was not preparation of an aggregate cost estimate (that is OMB’s neglected job), but rather an examination of regulatory burdens on small firms, which have higher per-employee regulatory costs than larger ones. Earlier government assessments from around the turn of the 21st century from OMB, the GAO, and the SBA also found aggregate annual costs in the hundreds of billions of dollars, some in excess of $1 trillion in the 2013 dollars depicted in Table 2.
Regulatory costs are not observable or calculable—many of the economic calculations necessary to enable central economic planning are impossible. That is why the real goal for restraining the growth of government is not regulatory reform alone, but restoration of Congress’ lawmaking duties under Article I of the Constitution, and restraints on that power. Even so, the need for disclosure is imperative as long as the administrative state persists. The solution in the meantime is for Congress to internalize costs by voting on costly and controversial rules (eventually and ideally all of them) and to avoid vague legislation that delegates tremendous authority to administrative agencies.
As for officialdom improving what it has, the annual OMB cost–benefit breakdown omits the independent agencies that issue many regulations. It also incorporates only those rules for which agencies have calculated both benefits and costs. That amounts to a couple dozen at best, even as, each year, agencies issue several thousand rules and guidance documents.
Box 3 illustrates a wide range of regulatory and administrative state interventions that generally go unacknowledged.
Private entities have attempted to quantify regulatory costs. In a 2014 report, the National Association of Manufacturers (NAM) tallied 2012 total annual regulatory costs in the economy of $2.028 trillion (in 2014 dollars). Unsurprisingly, the NAM report was criticized by progressive academics and consultants for agencies. A report from 2013—by economists John W. Dawson of Appalachian State University and John J. Seater of North Carolina State University—counts the long-term reduction in economic growth caused by decades of cumulative opportunity costs imposed by economic regulation. It posited dozens of trillions of dollars in lost gross domestic product (GDP) annually. The authors contended that rules affecting growth rates compound, and that Americans are less than half as rich as they would be in the absence of much of the regulatory state.
Such surveys and earlier Small Business Administration and OMB ones had traditionally conveyed regulatory costs in the following categories:
- Economic regulatory costs (for example, market entry restrictions and transfer payments such as price supports)
- Workplace regulatory costs
- Environmental regulatory costs
- Paperwork costs
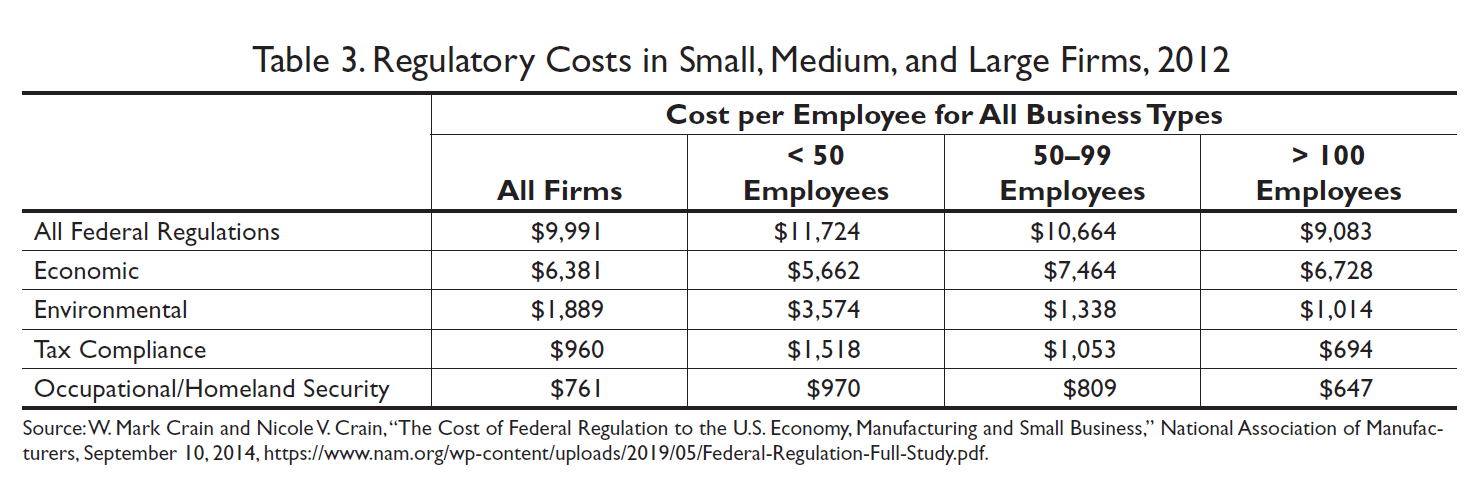
The NAM report found overall annual per-employee regulatory costs to firms of $9,991 on average, but to vary by firm size. Table 3 shows that per-employee regulatory costs for firms with fewer than 50 workers can be 29 percent greater than those for larger firms—$11,724 for smaller firms, compared with $9,083 for larger ones. These figures have not been updated in some time, but the general acceptance of the notion that regulation can more heavily fall on small businesses might be one anchor for reformers.
Box 3. Unmeasured Costs of the Administrative State
Table 3. Regulatory Costs in Small, Medium, and Large Firms, 2012
Others have set out to examine how seemingly inconsequential regulations accumulate and generate unintended effects and costs that ought not be ignored. A 2016 report by the Mercatus Center at George Mason University employs a microeconomic model to determine “how much regulation distorts the investment decisions of firms and thus hampers long-run economic growth.” Using a 22-industry data set covering 1977 through 2012, the report concluded that, had regulatory burdens remained constant since 1980, the 2012 U.S. economy would have been 25 percent larger. Put another way, the 2012 U.S. economy was $4 trillion smaller than it would have been in the absence of cumulative regulatory growth since 1980. That represents a loss in real income of approximately $13,000 per American per year.
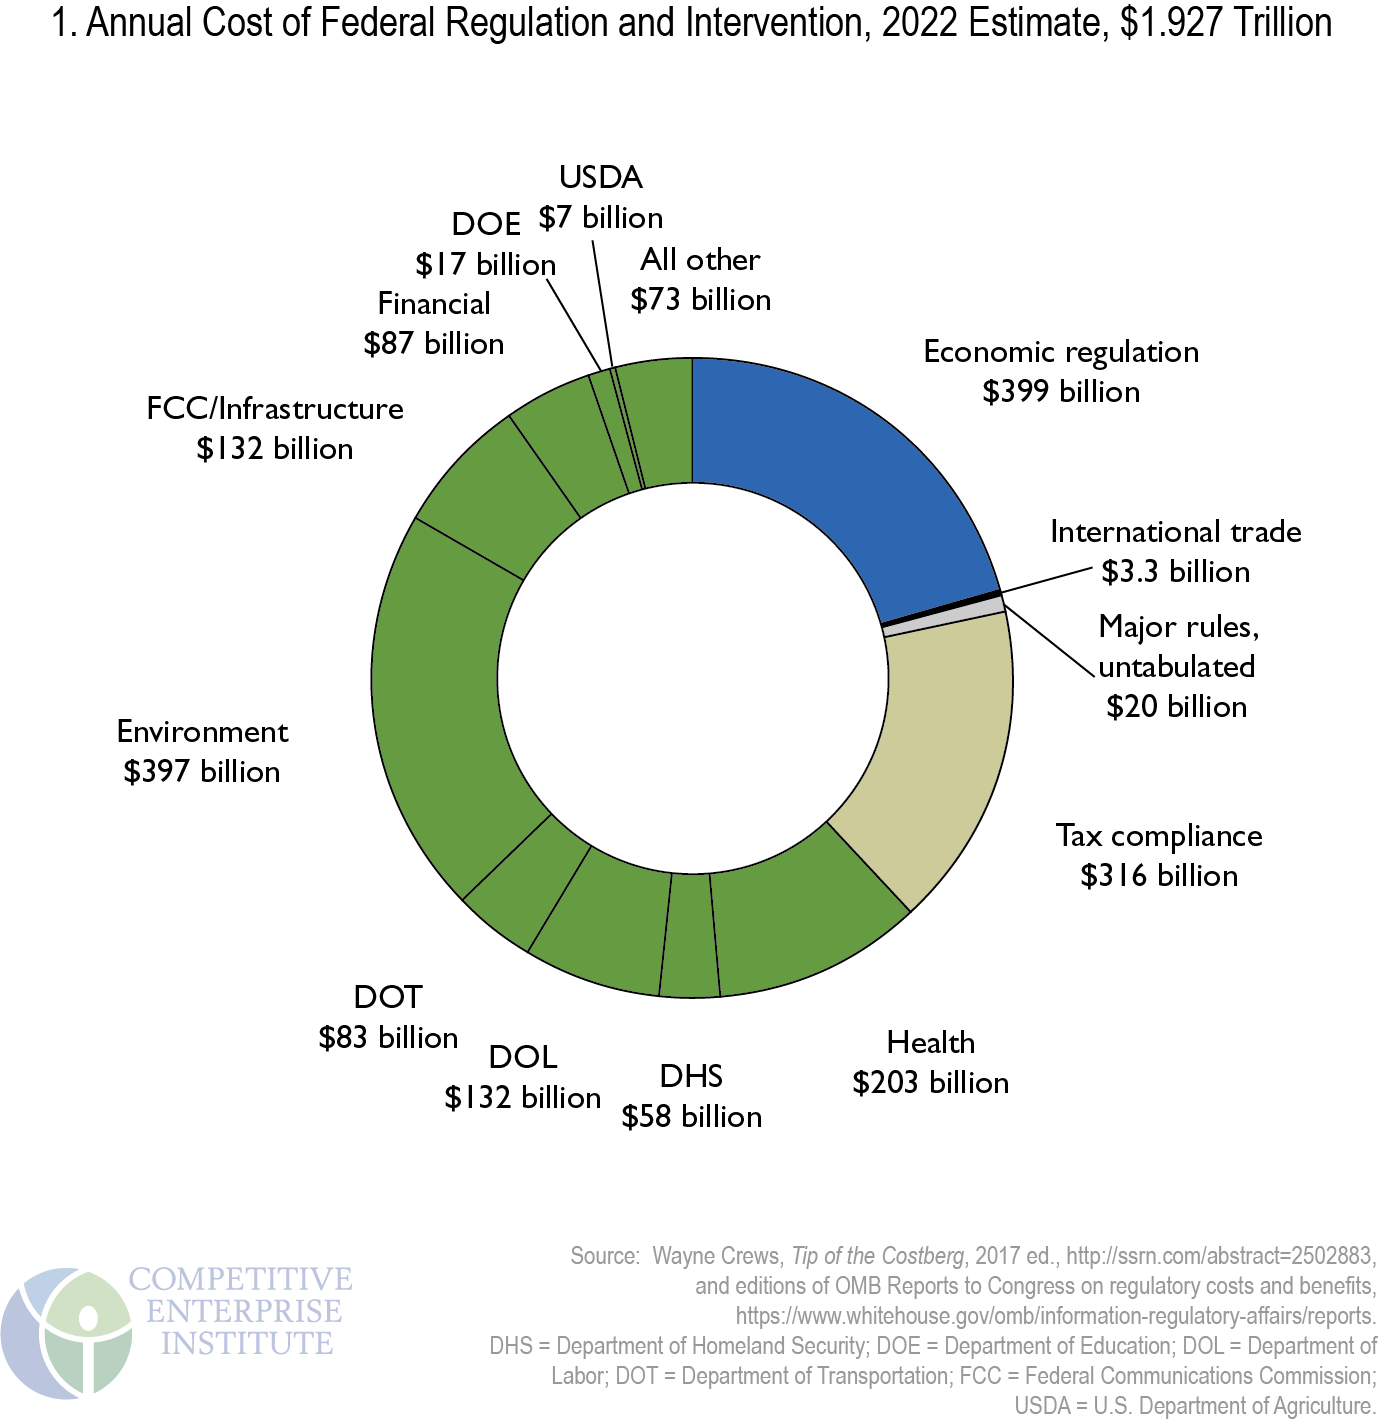
For several years, this report has employed a baseline for across-the-board costs of federal regulation of $1.9 trillion annually in compliance costs, economic and GDP losses, social, and other costs. Given the emergence at long last of the four recent OMB Reports to Congress (the 2020 fiscal year draft remains overdue), an additional $10.93 billion annually is added for rules since 2016 that have partial quantification of both costs and benefits and another $14.08 billion for rules since 2016 that feature only a cost analysis (which in some years outnumbered those with both cost and benefits quantified). That additional $25.01 billion brings a total of $1.927 trillion (see Figure 1). Several recent elements of regulation are not incorporated here, such as updates on costs of trade restrictions and a nominal (given the size of the federal government) increase in independent agency paperwork costs (see Box 3).
This placeholder estimate is based on a nonscientific, disclaimer-laden, amalgam of GDP losses and compliance costs derived from available official data and other accessible sources. It recognizes that significant figures in mathematical terms are indeterminate. With those caveats, this assessment is more representative and inclusive than slant-laden official estimates of costs, and are therefore more “conservative” in that burden estimates are considerably greater. A central government nonchalant about $30 trillion in debt will likely be so regarding off-the-books regulation of the sort that Box 3 begins to capture. Despite the overwhelming difficulty of calculating regulatory cost estimates, it is crucial for the federal government to disclose estimated costs of aggregate burdens to the extent possible. Taking that step will not legitimize illegitimate aspects of the administrative state, but policy makers do need to force OMB to perform comprehensive assessments. In the meantime, subsequent reports will add new fiscal years’ partial tallies incrementally, should the OMB make them available.
Just as no two people see the same rainbow, there will never be agreement on the magnitude of costs and benefits. The assessments we have do not capture numerous other categories of costs, such as the costs of antitrust, common-carriage telecom network regulations, federal health care spending, predominance of public–private partnerships in large-scale infrastructure projects, resource-use restrictions on western lands, a “too big to fail” stance toward large financial institutions, the permanent war economy, surveillance of private citizens, overcriminalization, monopolization of airport security, influence in the housing market and financing, and much more.
While escalation of government debt owing to the pandemic and new measures like the bipartisan infrastructure bill will show up in federal budget figures, other interventions rooted in such major legislation, such as costs of the eviction moratoria, may never appear in anything presented by OMB. Note that Trump added such costs as well. It is also difficult to assess the cost attributable to the federal government’s contribution to inflation and supply chain disruption. Douglas W. Allen of Canada’s Simon Fraser University remarked in September 2021: “It is possible that lockdown will go down as one of the greatest peacetime policy failures in modern history.” Costly lockdowns are a metaphor for any regulation, harming the production frontier. (After all, some business literature finds mere routine distractions and interruptions in the workplace cost hundreds of billions each year.) Redirecting private sector resources toward government-chosen ends will have trillions in compounded ripple effects, leading to opportunity costs not likely to show up in any yearly regulatory assessment.
Problems of measuring GDP are similar to those of measuring regulation. With respect to the pandemic’s effect on the most recent GDP estimates, the U.S. Bureau of Economic Analysis said: “The full economic effects of the COVID-19 pandemic cannot be quantified in the GDP estimate for the fourth quarter because the impacts are generally embedded in source data and cannot be separately identified.”
The cost estimate employed here speaks to the partial roundup of unfathomed costs depicted in Box 3, but does not quantify them. Enormous costs never find their way into regulatory analyses or public disclosure.
With regard to the mechanics of disclosure for those favoring it, the debate has never been over whether the government should perform its cost assessment, but whether it should be bottom-up or top-down. The answer is that both approaches are needed, at least as long as the administrative state dominates as a form of governance. As it stands, neither happens.
Regulatory Cost Burdens Compared with Federal Spending and the Deficit
Comparisons of regulation with the costs of federal taxation and spending help place the relative magnitudes in perspective, but the calculus is changing dramatically with interventions like surge in spending and regulation related to COVID, infrastructure, andtechnology.The first-ever trillion-dollar budget occurred in the latter half of the 1980s; nominal deficits of over $3 trillion dwarf that now; while projected to drop below $1 trillion by fiscal year 2023, they top $1 trillion and are projected to stay there beyond post-2025, with no end in sight.
The U.S. federal government posted $6.822 trillion in outlays and a deficit of $2.775 trillion in FY 2021 and revenues of $4 trillion. In the Congressional Budget Office’s new Budget and Economic Outlook, trillion-dollar deficits continue every year through 2032, at which point the projection reaches $2.253 trillion.
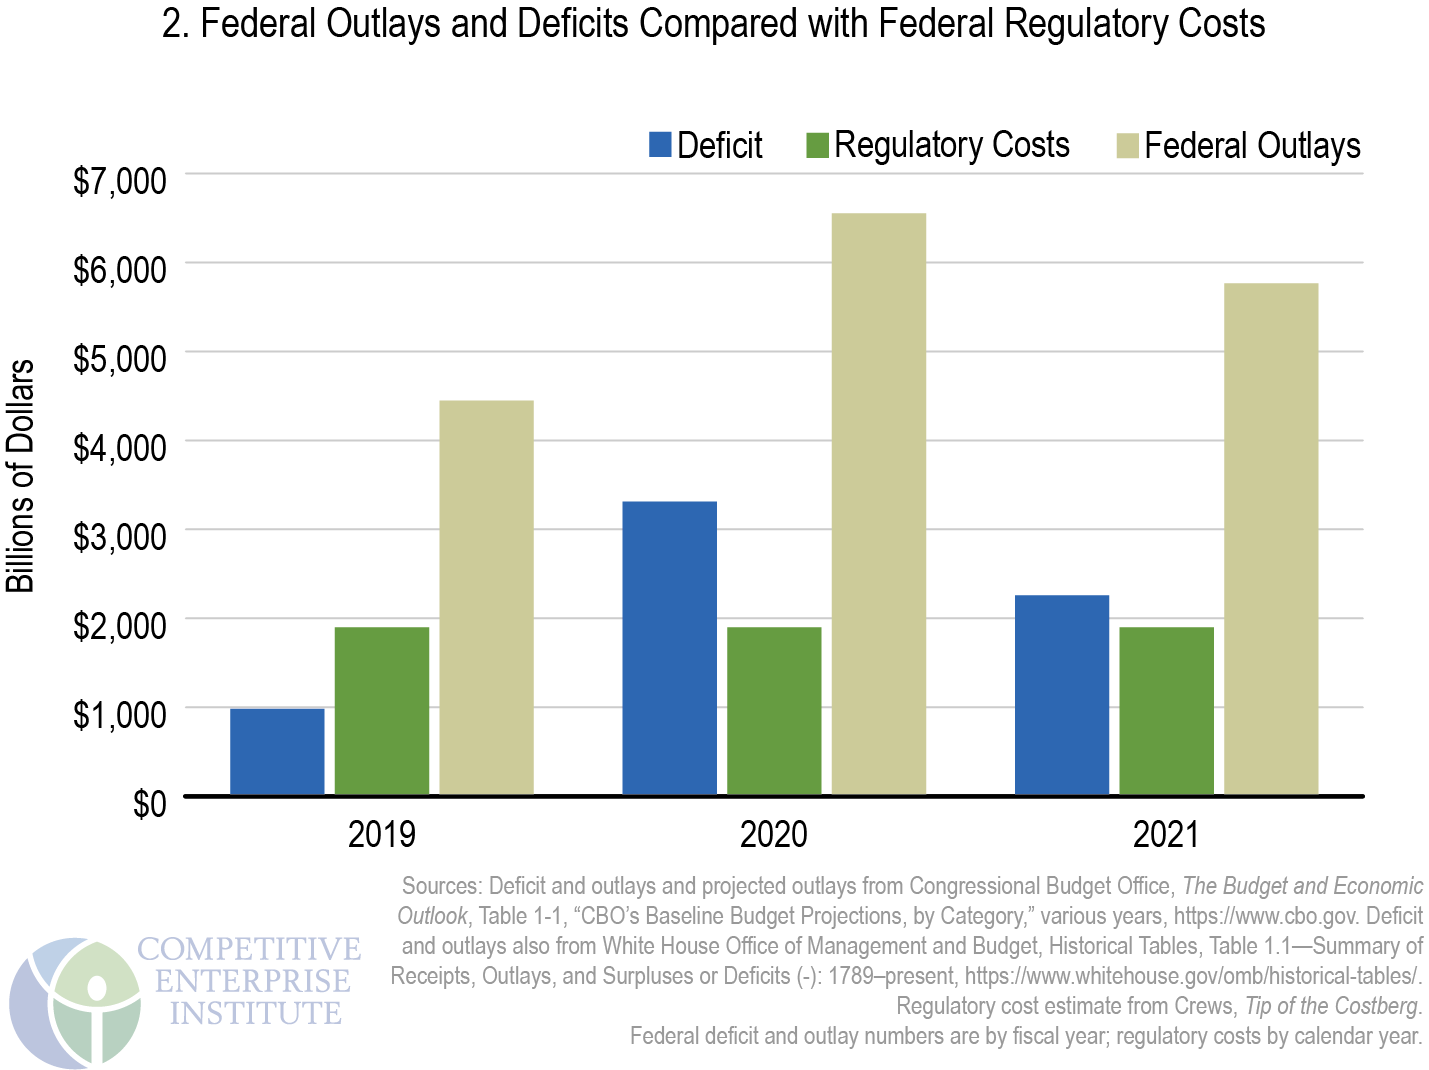
Figure 2 compares deficits and outlays for fiscal years 2020 and 2021 and projected amounts for 2022. Where costs of regulation have tended to hover around 40 percent of outlays, the skyrocketing spending in 2020 resulted in regulatory compliance costs of about 28 percent of budget outlays of $6.822 trillion. We now find the deficit some 65 percent larger than the placeholder estimate for total federal regulatory costs.
Regulatory Costs Compared with Income Taxes and Corporate Profits
Regulatory costs easily rival revenues from individual income taxes and corporate taxes combined. As Figure 3 shows, regulatory costs surpass 2021 estimated individual income tax revenues of $1.705 trillion. Incidentally, 2022 estimated individual income taxes are projected to surge to $2.038 trillion. Corporate income taxes collected by the U.S. government—an estimated $268 billion for 2021—are dwarfed by regulatory costs. The sum of the two—$1.97 trillion—is rivaled by our regulatory cost marker of $1.927 trillion. Regulatory costs as depicted here also approach the level of pretax corporate profits, which were $2.184 trillion in 2020.
Regulatory Costs Compared with GDP
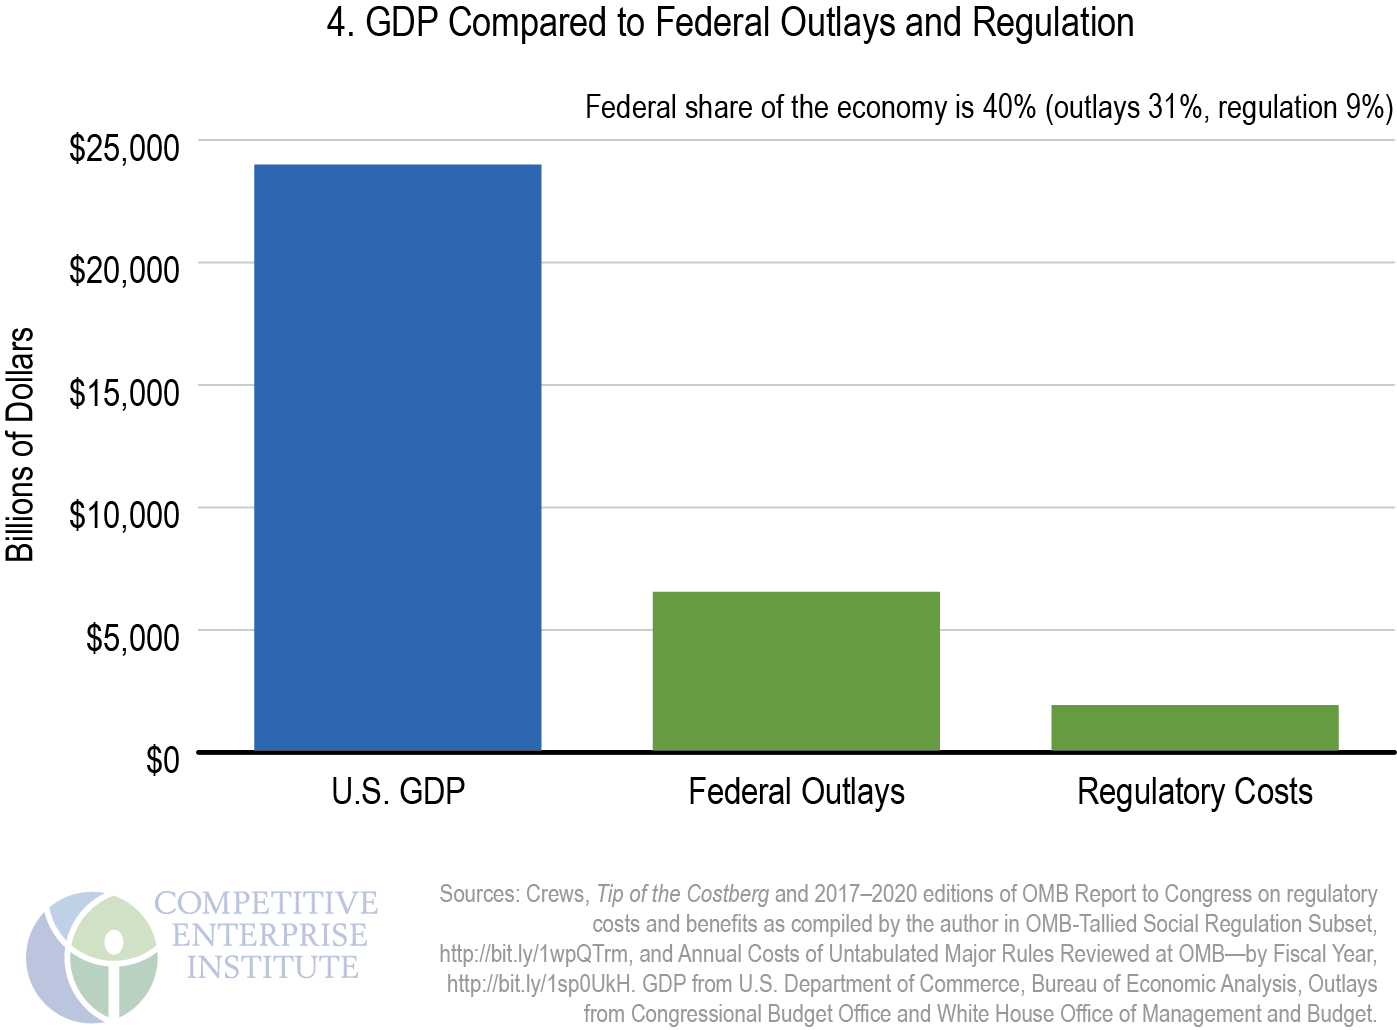
In January 2022, the Commerce Department’s Bureau of Economic Analysis estimated U.S. current-dollar GDP for 2021 at $23.99 trillion. The total regulatory cost figure of $1.927 trillion annually is equivalent to approximately 8 percent of that amount (other considerations could take that percentage higher as GDP grows. Combining regulatory costs with federal FY 2020 outlays of $6.822 trillion (see Figure 2), the federal government’s share of the economy reached $8.75 trillion in 2021, or roughly 36 percent of GDP, compared with the stubborn longstanding annual combined figure of approximately 30 percent (see Figure 4). That does not include state and local spending and regulation.

U.S. Regulation Compared with Some of the World’s Largest and Freest Economies
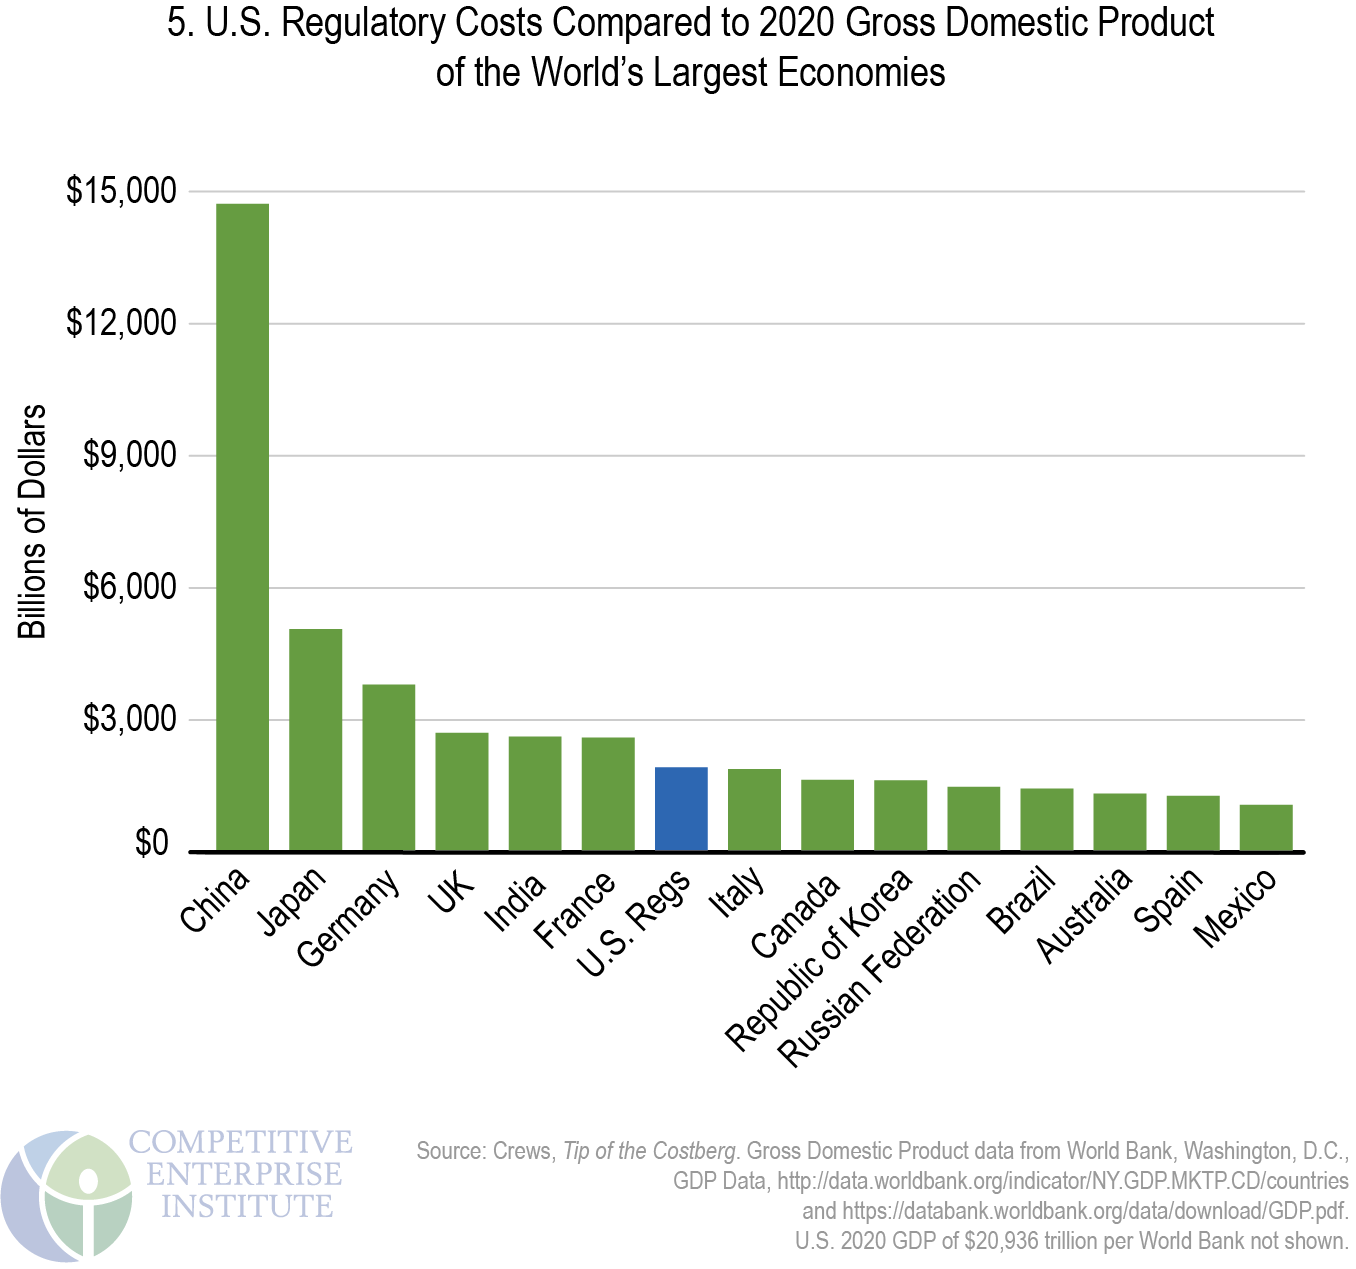
Not counting the United States, only seven countries had a GDP in 2020 that exceeded the cost benchmark for U.S. regulation; fewer would if other indeterminate costs were taken into account. U.S. regulatory costs surpass the 2020 GDP of neighbors Canada, at $1.643 trillion, and Mexico, at $1.076 trillion (both of which declined during the pandemic). If U.S. regulatory costs of $1.927 trillion were a country, it would be the world’s eighth-largest economy, ranking behind France and ahead of Italy (see Figure 5).
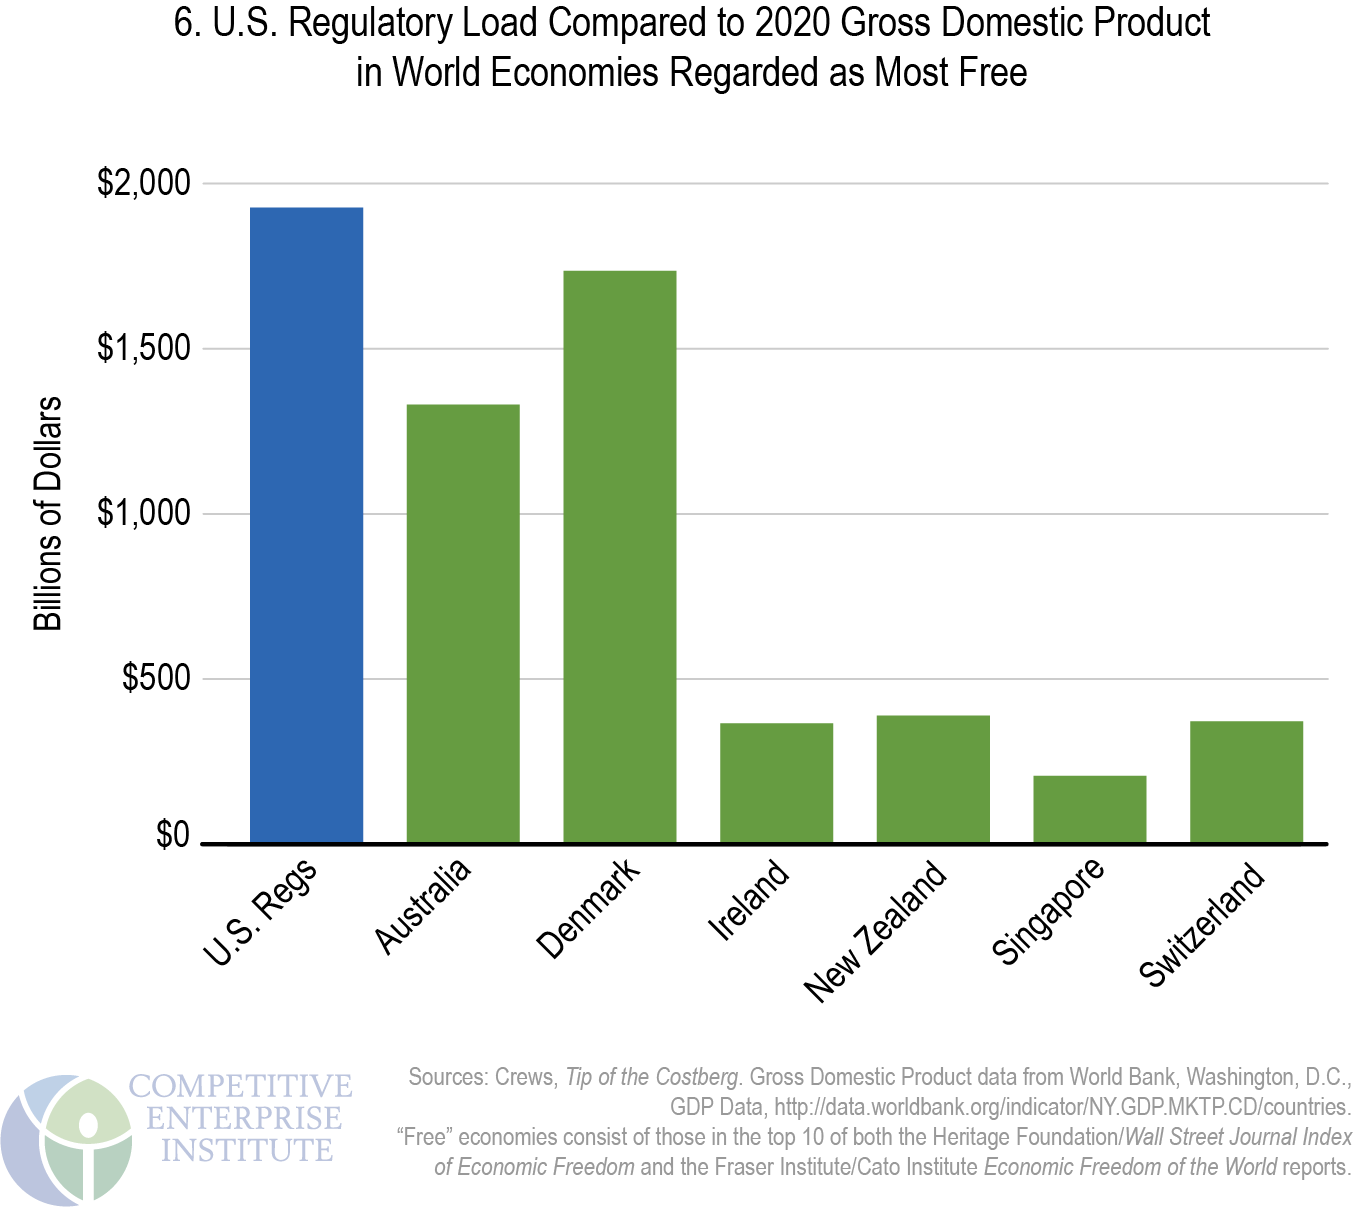
The U.S. regulatory figure of $1.927 trillion exceeds the output of many of the world’s major economies, including those ranked as the freest economically by two prominent annual surveys of global economic freedom. Figure 6 depicts the 2020 GDPs of the countries common to the top 10 in both the Heritage Foundation/Wall Street Journal Index of Economic Freedom and the Fraser Institute/Cato Institute Economic Freedom of the World report. Cato notes of Hong Kong and Singapore that “the interventions of the Chinese government in 2019 and 2020 will likely have a negative impact on Hong Kong’s score going forward.” The Fraser/Cato index ranks the United States sixth and Heritage 20th.
Regulation: A Hidden Tax on the Household Budget
Appearing in black and white, the burden of taxation can seem more immediate and present than that of regulation, but, like the taxes they are required to pay, businesses will pass some regulatory costs on to consumers. Other costs will find their way to workers and investors in regulated companies. By assuming a full pass-through of all such costs to consumers—and many consumers are also workers and owners through stock and mutual fund holdings—we can look at the share of each household’s regulatory costs and compare it with total annual expenditures as compiled by the Department of Labor’s Bureau of Labor Statistics (BLS).
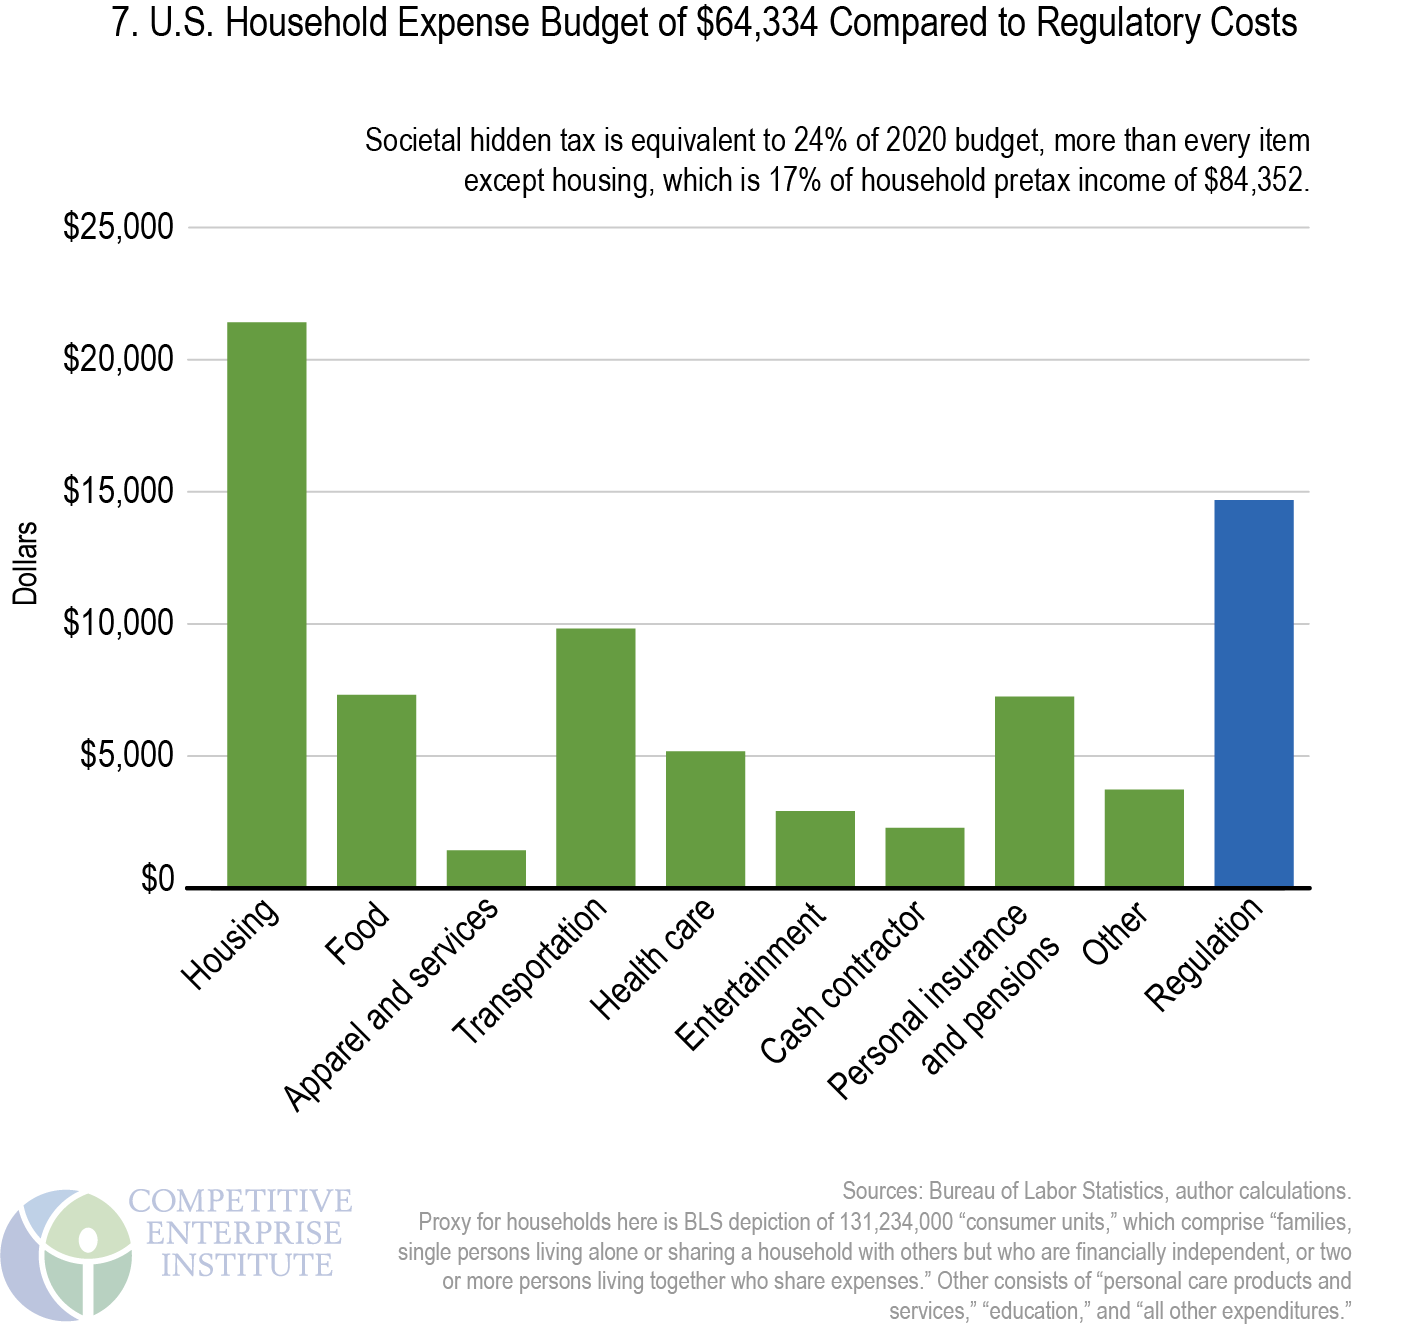
For America’s 131.2 million households, or “consumer units” in BLS parlance, the average 2020 pretax income was $84,352. If one were to allocate annual regulatory costs assuming, for simplicity’s sake, a full pass-through of costs to consumers, U.S. households “pay” $14,684 annually in embedded regulatory costs ($1.927 trillion in regulation divided by 131,234,000 “consumer units”), or 17 percent of average income before taxes, and more as a share of after-tax income. This regulatory “hidden tax” exceeds every annual household budgetary expenditure item except housing (see Figure 7). Regulatory costs amount to up to 24 percent of the typical household’s expenditure budget of $61,334. The average U.S. household “spends” more on hidden regulation than on health care, food, transportation, entertainment, apparel, services, or savings. Of course, some costs of regulation are not hidden. Consumers pay for regulatory agencies and administration more directly through taxes, as described in the next section.
Administrative and Enforcement Costs of Regulation
Regulatory cost estimates inadequately capture compliance, dead weight, and other costs experienced by the public, but those evaluations do not generally include administrative costs—the on-budget amounts spent by federal agencies to issue and enforce rules. The Weidenbaum Center at Washington University in St. Louis and the George Washington University Regulatory Studies Center in Washington, DC, regularly examine presidents’ annual budget proposals to compile the administrative costs of developing and enforcing rules. Those amounts—funds that taxpayers contribute to support agencies’ administrative operations—are disclosed in the federal budget in a way that regulatory compliance and economic costs are not.
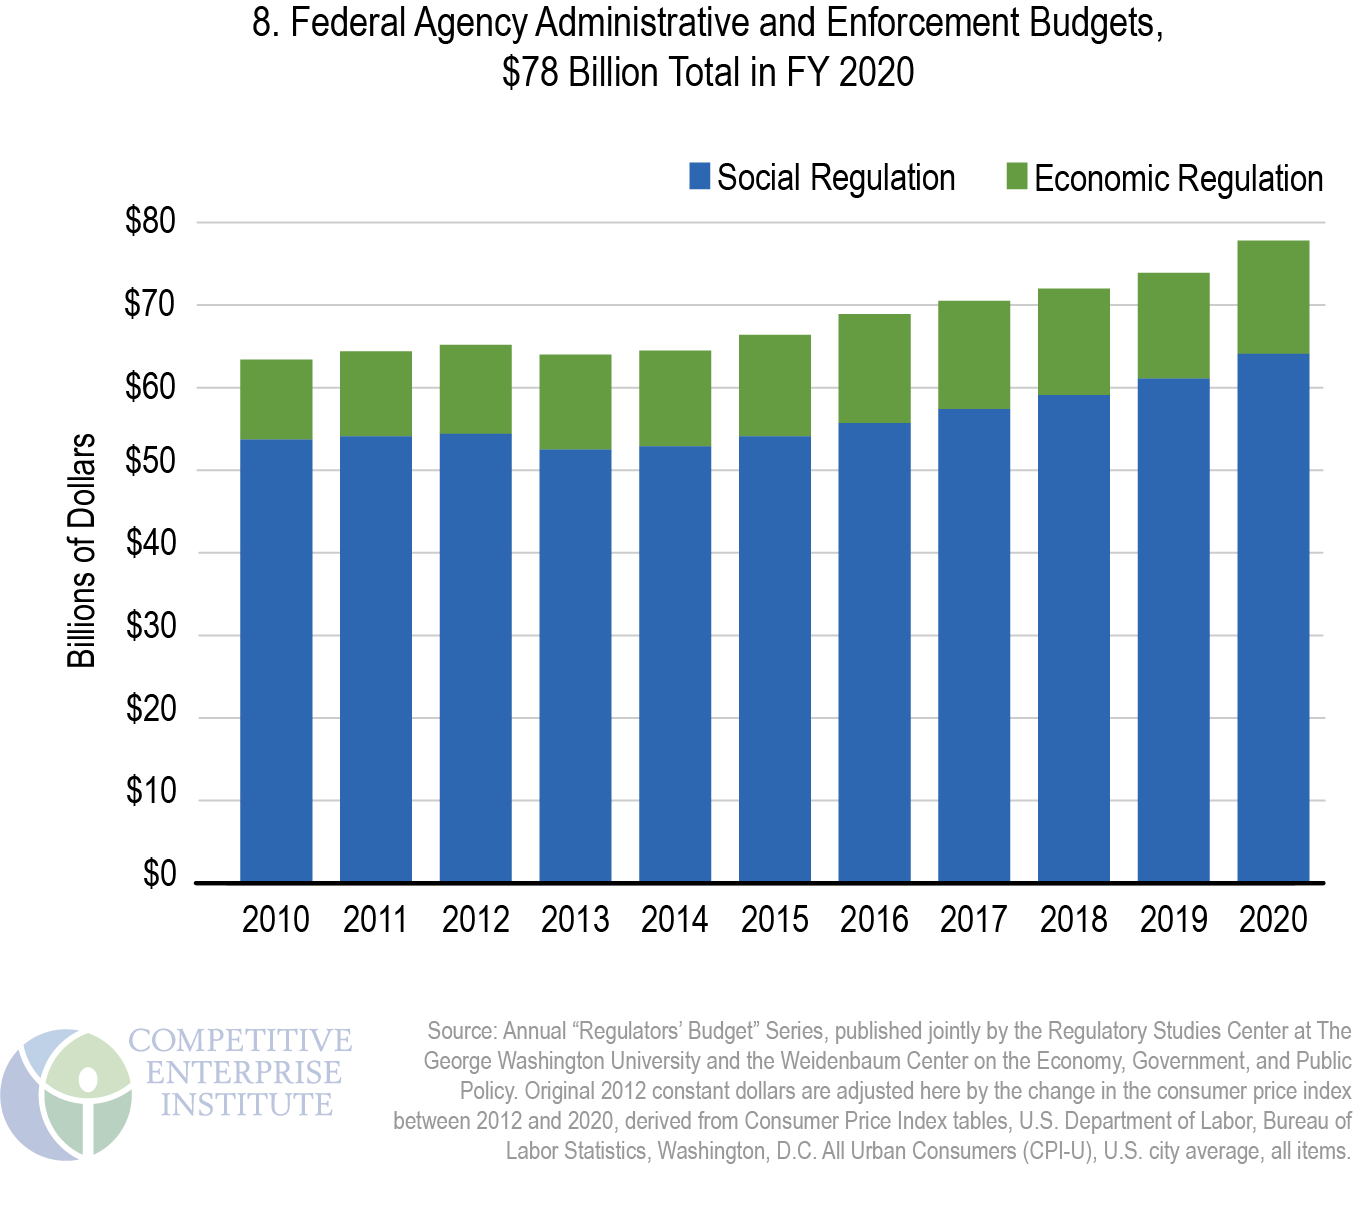
According to the latest compilation, FY 2020 enforcement costs incurred by federal departments and agencies stood at almost $78 billion (in constant 2020 dollars, here adjusted from original 2012 dollars) (Figure 8). Of that amount, $13.7 billion was incurred on administering economic regulations. The larger amount, spent on writing and enforcing social and environmental regulations, was $64.1 billion. The $78 billion in regulatory agency enforcement costs helps complete a picture of the federal regulatory apparatus, as these costs come on top of other estimates of regulatory compliance and economic burdens. In current dollars, the Environmental Protection Agency alone spent an estimated $5.561 billion in this category in 2020, accounting for 7 percent of total expected expenditures by all regulatory agencies. The EPA formerly accounted for the lion’s share of government administration and enforcement costs, but the Department of Homeland Security’s costs, at an estimated $38 billion, now account for 48 percent.
The Weidenbaum Center and the Regulatory Studies Center also estimate the number of full-time-equivalent administrative and enforcement staff at 288,409 in FY 2021. The number of federal employees has increased by more than 100,000 since the 2001 staffing level of 173,057. Much of the post-2001 surge may be attributable to the then-newly created Transportation Security Administration’s hiring of thousands of airport screening personnel.
Costs are one way to attempt to capture the size and scope of the federal regulatory enterprise. Another is to assess the production of paper—the regulatory material that agencies publish each year in sources like the Federal Register.