What Comes after “Trillion”? The Unknowable Costs of Regulation and Intervention
Ten Thousand Commandments 2020 - Chapter 4
Download Chapter 4 as a PDF
If real debt levels on the fiscal budget and entitlements can be vastly higher than the public is generally told,342 what might that say about true costs of the even less disciplined regulatory enterprise? Should we expect that which is untracked to behave better than what is systematically disclosed? The nonchalance with which this is treated343 even extends to the president, who asked staff to look at cuts in his second term.344 “Who the hell cares about the budget,” Trump reportedly proclaimed at a January 2020 fundraiser.345 With peacetime deficits and debts ignored at a time of low interest rates, rescue-by-deficit spending during some future recession may be unavailable. 346
Little timely review of federal regulation occurs to assure anyone that individual regulations do more good than bad, and no assessment is made for regulatory burdens as a whole.347 The sole official reckoning citizens get regarding the scale and scope of regulatory costs is an annual (in law348 but not in practice349) OMB survey of a subset of regulatory costs and benefits called the Report to Congress on the Benefits and Costs of Federal Regulations and Agency Compliance with the Unfunded Mandates Reform Act.350 These reckonings contain a limited overview of the numbers of significant rules and partial quantification of costs and benefits of a handful of executive agencies’ rules during the current fiscal year and the most recent 10 years. An aggregate annual estimate of the regulatory enterprise is required by law 351 but has not been performed since 2002.352
OMB’s 2017 report is the most recent relatively complete edition, but in covering fiscal year 2016 Obama-era rules and regulations, it arrived nearly four years overdue, in December 2019.353 There is a long history of tardiness and incompleteness for this report, but this years-long delay was unprecedented.354A frenzy to catch up brought forth a truncated Draft Report combining the overdue fiscal years 2018, 2019, and 2020 in one abbreviated volume the day before Christmas Eve,355 along with helpful supplemental tables in electronic format, but without the 10-year lookbacks that had become standard.356 While the reports were late, the public did get year-end status reports on Trump’s one-in, two out Executive Order 13771 directive on agency regulations.357
OMB’s last 10-year survey from fiscal year 2016 reported that federal agencies published 36,255 final rules in the Federal Register, and that it only reviewed 2,670 of these final rules under Executive Order 12866. Of these OMB-reviewed rules, 609 were considered major. Yet, OMB claimed high net regulatory benefits, pegging the cumulative benefits of a selection of 137 of 609 major regulations issued between 2006 and 2016 at between $287 billion and $911 billion (in 2015 dollars). The estimated range for the decade’s costs was $78 billion to $115 billion. The 16 rules subjected to both benefit and cost analyses during FY 2016 added annual costs in the range of $4.3 billion to $6.4 billion.
Bringing it all up to date, the new White House composite report covering fiscal years 2017–2019 covers only a handful of rules and admits to total of costs and benefits of only a few billion each:
-
FY 2017, $5.9 billion to $9.5 billion in annual benefits; $2.2 billion to $3.2 billion in annual costs (2016$)
-
FY 2018, $0.6 billion in annual benefits;
$0.1 billion to $0.3 billion in annual costs (2017$)
-
FY 2019, $0.2 billion to $3.7 billion in annual benefits; up to $0.6 billion in annual costs (2018$)
Regulators decide what counts as major. As OMB acknowledges: “As has been the practice for many years, all estimates presented … are agency estimates of benefits and costs, or minor modifications of agency information performed by OMB.”358 OMB admits that its report “does not purport to demonstrate all costs or benefits from federal regulation; instead, the report summarizes the anticipated costs and benefits that the Regulatory Impact Analyses (RIAs) of individual final rules reported for those rules.”359 The administration acknowledges what it calls an “often-overlooked detail”—that “the totals listed … include only the benefits and costs for the minority of rules for which both those categories of impacts were estimated.”360
As this report will cover, there have been over 9,000 rules and regulations, large and small, issued since Trump’s inauguration,361 but the amalgamated three-year report shows only 27 rules with both benefits and costs quantified and another 29 with costs alone quantified.362 OMB asserts the major rules (including budget rules) it reviewed “represent approximately one-fourth” of the significant regulatory actions reviewed by OMB.363 Overall, the 2018–2020 consolidated Report to Congress encompasses only 145 “major” rules, a small number compared to the 9,604 rules issued during the corresponding calendar years.
Of the hundreds of executive agency major rules issued since 2001 (among tens of thousands of nonmajor rules issued), just a relative handful received OMB-reviewed quantified cost analysis, let alone cost and benefit analysis; overall, about 38 percent sport quantitative cost estimates.364 When we look beyond the officially self-designated “major” rules, the proportion of all rules with any reviewed cost analysis averages less than 1 percent.365
OMB references a 2004 claim that the “major” rules reviewed account for the bulk of regulatory costs.366 Other OMB reports had been more forthcoming about indirect and unfathomed costs. OMB does not review independent agency rules like those of the FCC or financial regulatory bodies. Entire categories of oversight or intervention like those referenced nearby in Box 3 get no scrutiny. And the Unfunded Mandates Reform Act, surveyed in the Report to Congress, exempts almost everything from critical analysis and repeal.367 Transfer and budget programs, unless related to defense or justice, are inherently interventionist and regulatory in nature. Yet the costs of distortions caused by federal spending are not counted,368 nor are the deadweight effects of the budget rules, even when the federal government has taken over the bulk of retirement and senior health care.369 Pell grants alter private college financing. Federal medical programs have altered the medical markets, to such extent now that single payer is contemplated. Washington’s expansion of middle-class dependency on the federal government is about as fundamental as social regulation gets.
Compulsory transfer utilitarianism is not a part of traditional American principles, yet agencies engage in it in their net-benefit pursuits, implying costs do not matter as long as “benefits” exceed them. The fundamental problem with the regulatory Report to Congress regime is that net-benefit analysis is oxygen for an ever-expanding government. Creative regulators can alternate between maximizing net benefits (as in OMB’s 18 year-old “Circular A-4” guidance on regulatory analysis), or claiming benefits “justify” costs as specified in Executive Order 12866. Cost-benefit analysis is mute on superior benefits that may have accrued if an agency’s “regulatory budget” allocation belonged instead to another agency. So there exists no genuine net-benefit pursuit adopting a wider perspective than that of agencies in isolation. Still further, costs of “regulatory dark matter” like agency memoranda, guidance documents, bulletins, circulars, and manuals do not appear in OMB’s annual assessments. Far too much is left out, even though OMB has had decades to practice.
On the plus side, a 2019 report from the Council of Economic Advisers on The Economic Effects of Federal Deregulation points to hundreds of billions in direct and indirect annual savings from changes not just in a set of rules removed but in approaches to regulation as such:
The Council of Economic Advisers (CEA) estimates that after 5 to 10 years, this new approach to Federal regulation will have raised real incomes by $3,100 per household per year. Twenty notable Federal deregulatory actions alone will be saving American consumers and businesses about $220 billion per year after they go into full effect. They will increase real (after-inflation) incomes by about 1.3 percent. …
This new approach to regulation not only reduces or eliminates costly regulations established by prior administrations but also sharply reduces the rate at which costly new Federal regulations are introduced. The ongoing introduction of costly regulations had previously been subtracting an additional 0.2 percent per year from real incomes, thereby giving the false impression that the American economy was fundamentally incapable of anything better than slow growth.370
The CEA approach implies far greater costs attributable to regulation than the annual Report to Congress has ever addressed. For example, regulation affects not only current jobs, but also entrepreneurs’ inclination to create new ones in the future. This intertemporal nature of regulation complicates cost assessment, since nations cannot “lose” jobs that have not been created.
The CEA’s assertions were blasted as “bad fiction”371 by progressives and received the requisite fact checks.372 Yet, if there is validity to the propositions that such regulatory changes reduced costs substantially, it is also reasonable to presume prior additions to regulation that have gone unmeasured will have added billions of dollars beyond what are seen in the normal compliance measures. It is appropriate to address costs of progressive policies and the benefits of lifting them. Government steering without issuing a rule is also “regulation,” as implied in the CEA report.
Regulatory costs are unknowable in an elemental sense; they are not observable or calculable—much as the economic calculations necessary to enable central economic planning are impossible.373 Regulatory costs are, in the words of American Enterprise Institute scholar Peter Wallison, inherently “squirrelly.”374 This is why regulatory or administrative state reform is not a goal, but restoration of Article I of the Constitution is. Even so, the need for disclosure is an imperative as long as the administrative state remains a means of governance. The solution to the dilemma is for Congress to vote not just on costly and controversial rules but on all of them, or to legislate.
The annual OMB cost-benefit breakdown omits independent agencies and incorporates only those rules for which agencies have expressed both benefits and costs in quantitative and monetary terms—amounting to a couple dozen at best, when several thousand rules and guidance documents not subject to notice and comment appear each year. This helps illustrate how most of the regulatory enterprise is unaccounted for. For this reason, more efforts like that of CEA are needed, as well as some official reconciliation between the two. Box 3 illustrates a wide range of regulatory and administrative state interventions that often go unacknowledged.375
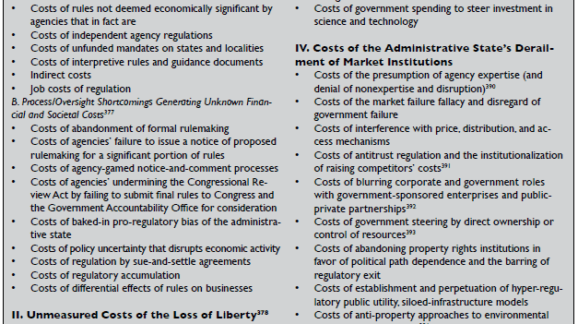
Box 3. Rule of Flaw and Costs of Coercion
Surveying Unmeasured, Disregarded, and Unfathomed Costs of the Administrative State
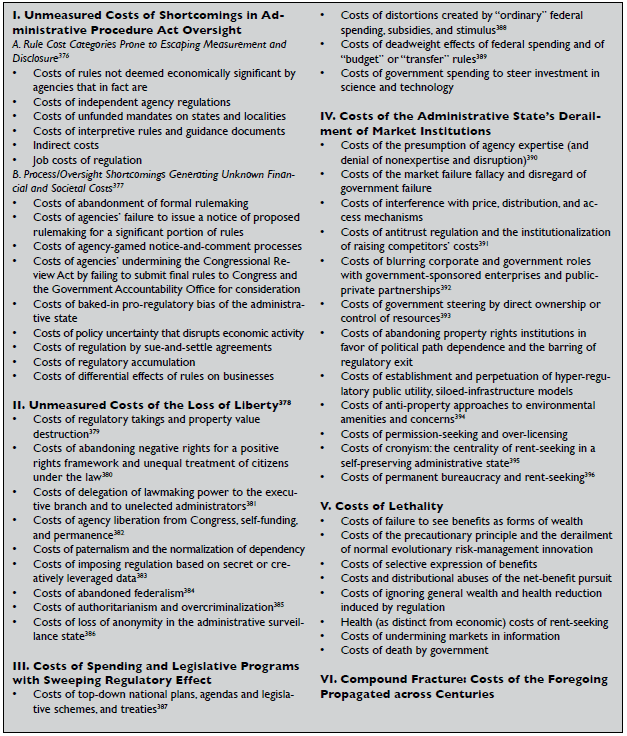
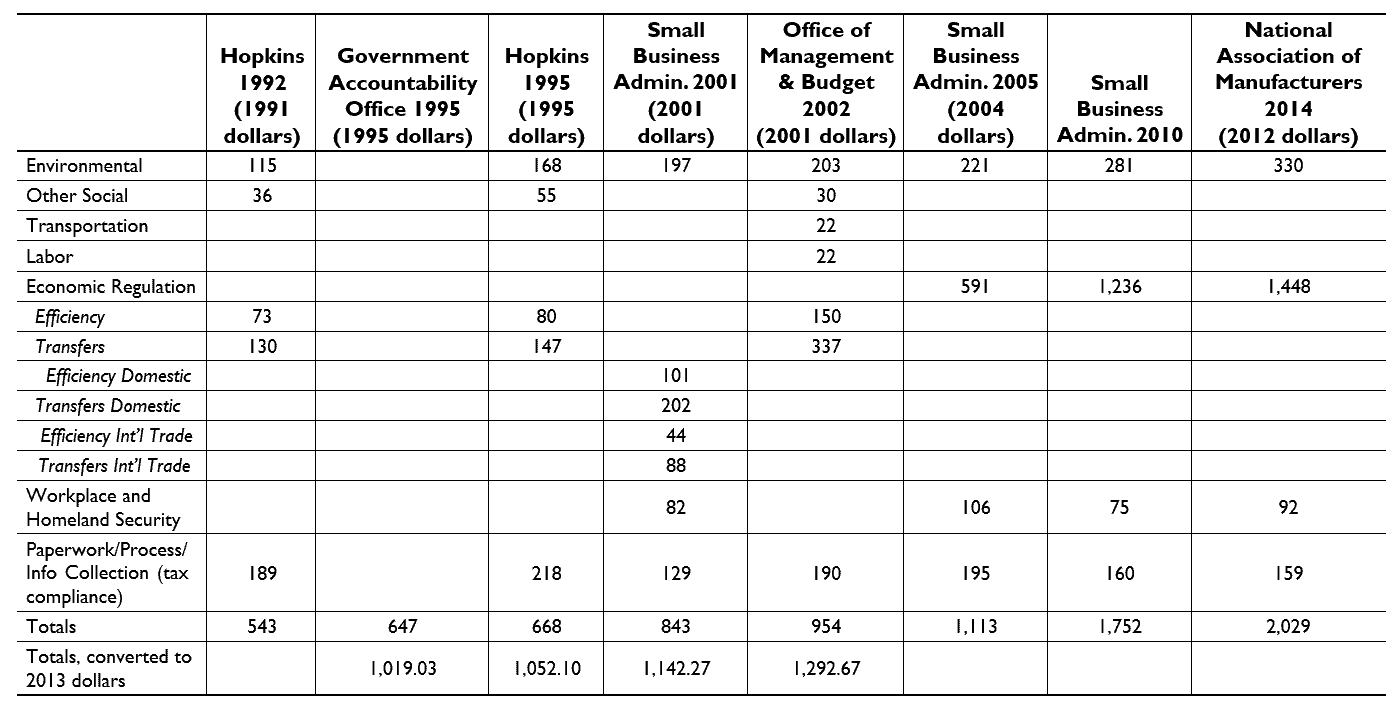
Table 3. Assessments of Federal Regulation: Late 20th Century, Early 21st Century, Billions of Dollars
The ample shortcomings in disclosure partly inventoried in Box 3 work to the advantage of the professions and the academic legal studies infrastructure it has spawned over the last century. With government that unbridled, there are lots of ways to get to trillions in regulatory costs, just as federal spending occupies those heights.
The Small Business Administration (SBA) last published an assessment of the federal regulatory apparatus in 2010, pegging regulatory compliance costs at $1.75 trillion for 2008, but that report was discontinued and not replaced. The primary purpose of the SBA report series was not an aggregate cost estimate but rather to examine regulatory burdens on small firms, which have higher per-employee regulatory costs than larger ones. Earlier governmental assessments around the turn of the 21st century from OMB, GAO, and SBA also found aggregate annual costs in the hundreds of billions of dollars, some in excess of $1 trillion in today’s dollars (see Table 3). Performing an aggregate estimate never was SBA’s job, but remains OMB’s neglected duty. The data underlying these studies were problematic, as I noted in 2017.397 Yet, the federal bureaucracy, even with all the vast resources at its disposal, has done nothing to fulfill its duty to assess the aggregate effects of regulation and intervention in which it engages.
In a 2014 report, the National Association of Manufacturers (NAM) modeled 2012 total annual regulatory costs in the economy of $2.028 trillion (in 2014 dollars).398 The NAM report likewise drew its share of detractors.399 Still another report, by economists John W. Dawson of Appalachian State University and John J. Seater of North Carolina State University, pushes regulatory costs into orbit by counting the long-term reduction in economic growth caused by decades of cumulative opportunity costs imposed by economic regulation. Their report posits dozens of trillions of dollars in lost GDP annually.400 The authors contend that rules affecting growth rates compound, and that Americans are less than half as rich as they would be in the absence of much of the regulatory state.
Some have set out to examine how seemingly inconsequential regulations accumulate and have unintended effects and costs that ought not be ignored.401 A 2016 report, “The Cumulative Cost of Regulations” by the Mercatus Center at George Mason University, employs a microeconomic model investigating regulations’ effect on firms’ investment choices to attempt to determine “how much regulation distorts the investment decisions of firms and thus hampers long-run economic growth.” Using a 22-industry data set covering 1977 through 2012, the report concluded that had regulatory burdens remained constant since 1980, the 2012 U.S. economy would have been 25 percent larger. Put another way, the 2012 U.S. economy was $4 trillion smaller than it would have been in the absence of cumulative regulatory growth since 1980.402 This represents a loss in real income of approximately $13,000 per American.403
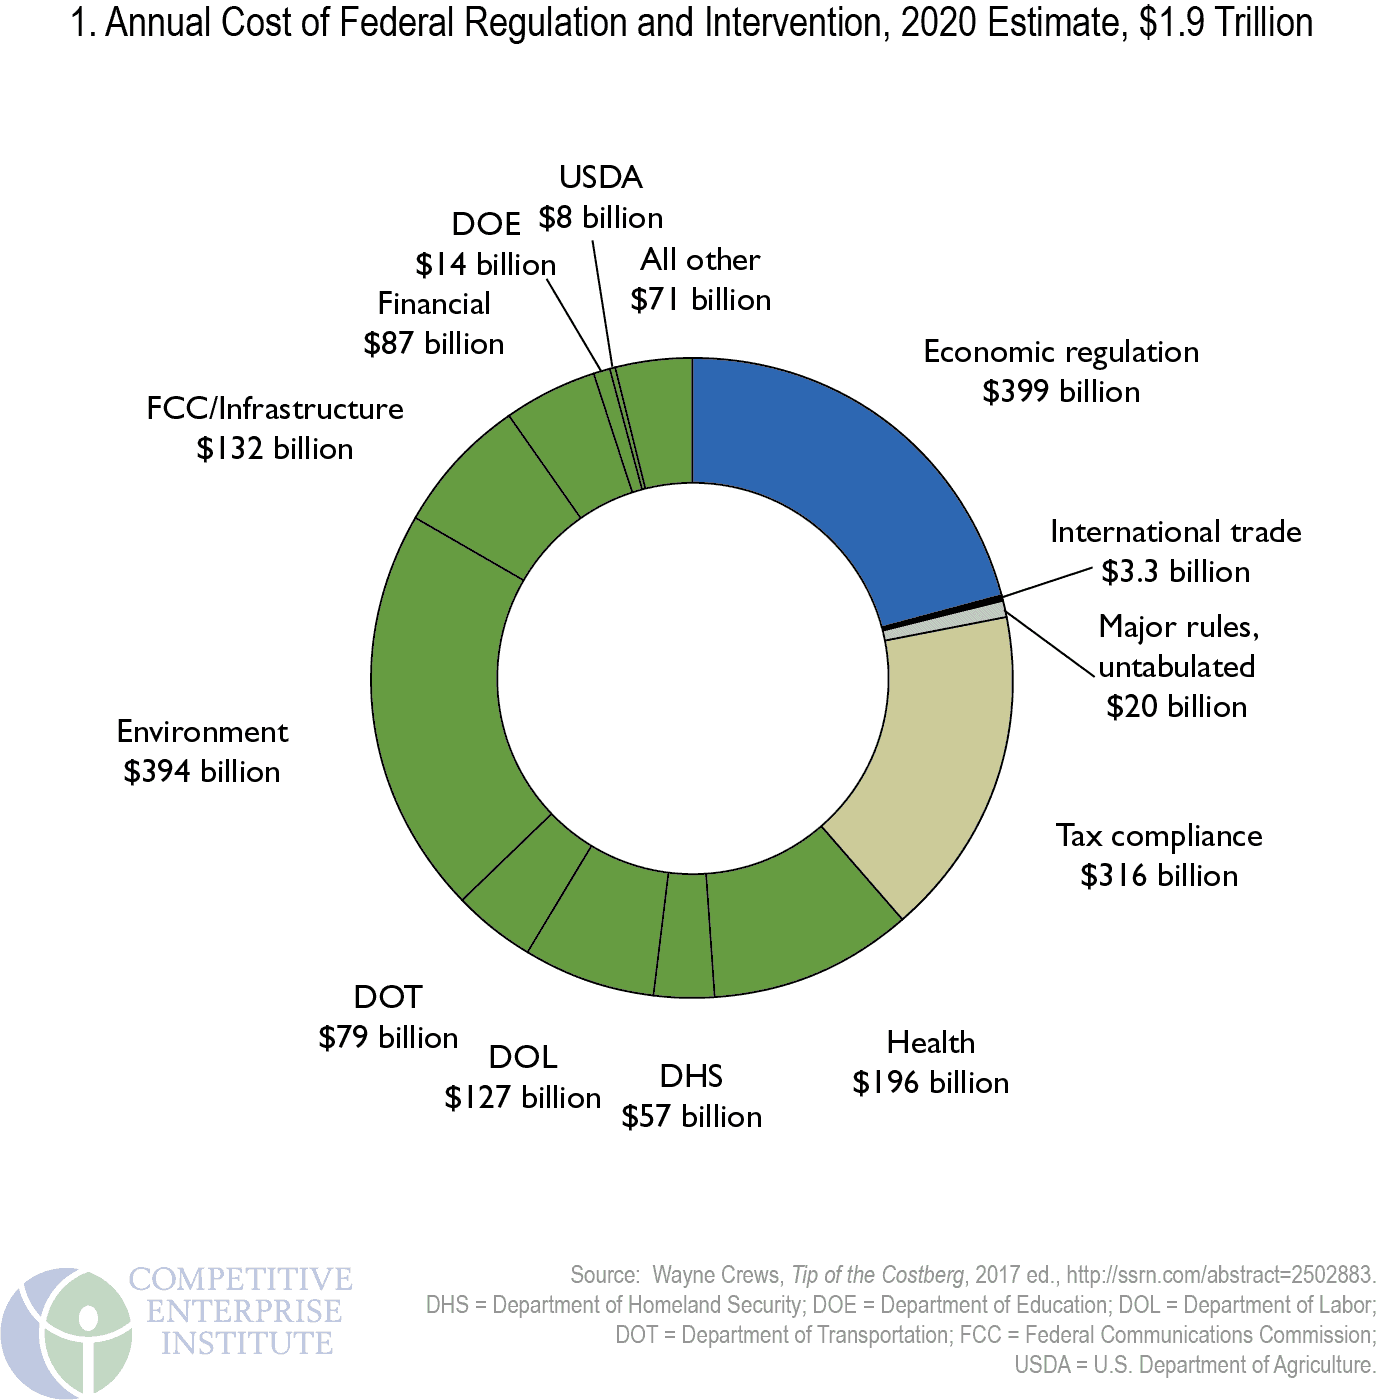
In the context of these existing and available sources and the federal government’s failure to issue new aggregate analysis, apart from the CEA’s new effort, this report employs a baseline for across-the-board costs of federal regulation and intervention of $1.9 trillion annually in compliance costs, economic and GDP losses, and social costs (see Figure 1).404 This placeholder estimate is based on a nonscientific, disclaimer-laden, fusion and amalgam of GDP losses and compliance costs derived from available official data and the other sources that exist.405 Even so, this assessment is more representative and inclusive than official estimates and more “conservative” in that burdens conceivably are considerably more, as the Mercatus and Dawson and Seater approaches imply.
As Box 3 illustrates, enormous costs simply never find their way into regulatory analyses or public disclosure. “Regulation,” in fact, is too narrow a word to capture the effects of wholesale government intervention into human lives from health care to education to retirement, let alone economic intervention. That cost calculations are largely impossible is not the fault of critics of the regulatory state; nonetheless, these are the kinds of costs that should be assessed and described to the public in the aggregate, as required by the Regulatory Right-to-Know Act.
Table 4. Regulatory Costs in Small, Medium, and Large Firms, 2012
|
|
Cost per Employee for All Business Types |
|||
|
All Firms |
< 50 Employees |
50–99 Employees |
> 100 Employees |
|
|
All Federal Regulations |
$9,991 |
$11,724 |
$10,664 |
$9,083 |
|
Economic |
$6,381 |
$5,662 |
$7,464 |
$6,728 |
|
Environmental |
$1,889 |
$3,574 |
$1,338 |
$1,014 |
|
Tax Compliance |
$960 |
$1,518 |
$1,053 |
$694 |
|
Occupational/Homeland Security |
$761 |
$970 |
$809 |
$647 |
Source:W. Mark Crain and Nicole V. Crain, “The Cost of Federal Regulation to the U.S. Economy, Manufacturing and Small Business,” National Association of Manufacturers, September 10, 2014, http://www.nam.org/~/media/A7A8456F33484E498F40CB46D6167F31.ashx.
Regarding regulations’ unequal effects on different kinds of firms, the NAM model noted above found overall annual per-employee regulatory costs to firms of $9,991 on average, but to vary by firm size.406 Table 4 shows that per-employee regulatory costs for firms of fewer than 50 workers can be 29 percent greater than those for larger firms—$11,724 for smaller firms, compared with $9,083 for larger ones.407
The SBA and earlier OMB surveys had traditionally conveyed regulatory costs in the following categories:
- Economic regulatory costs (for example, market entry restrictions and transfer payments such as price supports;
- Workplace regulatory costs;
- Environmental regulatory costs; and
- Paperwork costs.
Differential effects of accumulating regulations on firms and people are also referenced among the costs in Box 3 and span economic, environmental, health, safety, and social costs, compounded over decades. These effects include loss of liberty from overcriminalization to the overthrow of the constitutional order in favor of rule by unelected bureaucrats. Some never tire of pointing out the accumulation of wealth by the top percenters in their alleged concern over income inequality, but the perpetuation of unnecessary regulation that also erases wealth accumulation and harms the most vulnerable garners little concern.408
Numerous kinds of costs are not captured by the government and are ignored outright, such as the presence of the antitrust threat and the costs of the distortions it has inflicted over a century.409 These include common carriage and public-utility regulation of networks, health care governance (spending on which is about 18 percent of the economy), the predominance of public-private partnerships rather than private free enterprise in large-scale infrastructure projects, restrictions on Western lands with respect to resource use, the reluctance to move spectrum and other commons into the wealth-creating sector, central control of the money supply, a “too big to fail” stance toward financial entities that implies future bailouts, the permanent war economy, surveillance of private citizens, the detachment of nuclear power from institutions of market evolution and discipline, the monopolization of airport security, influence in housing markets and financing (perhaps a third of the U.S. economy), and much more.
We need greater acknowledgement of what we do not know, to own up to burdens that slip through the cracks (or canyons). Unless Congress votes on rules, the federal government must continue to be forced to assess regulatory costs from the standpoint of compliance, efficiency, and losses of liberty even if such assessments can never be accurate. In terms of disclosure, the debate has never been whether the government should perform its cost assessment, but whether it should be bottom up or top down.410 The answer is that both are needed, and an executive order reaffirming the longstanding obligation to assess aggregate costs is warranted. Executive orders and guidance to agencies governing cost assessment and regulatory analysis are incomplete and need to incorporate far more elements, as explored above.411
Figure 1. Annual Cost of Federal Regulation and Intervention, 2020 Estimate, $1.9 Trillion
Regulatory Cost Burdens Compared to Federal Spending and the Deficit
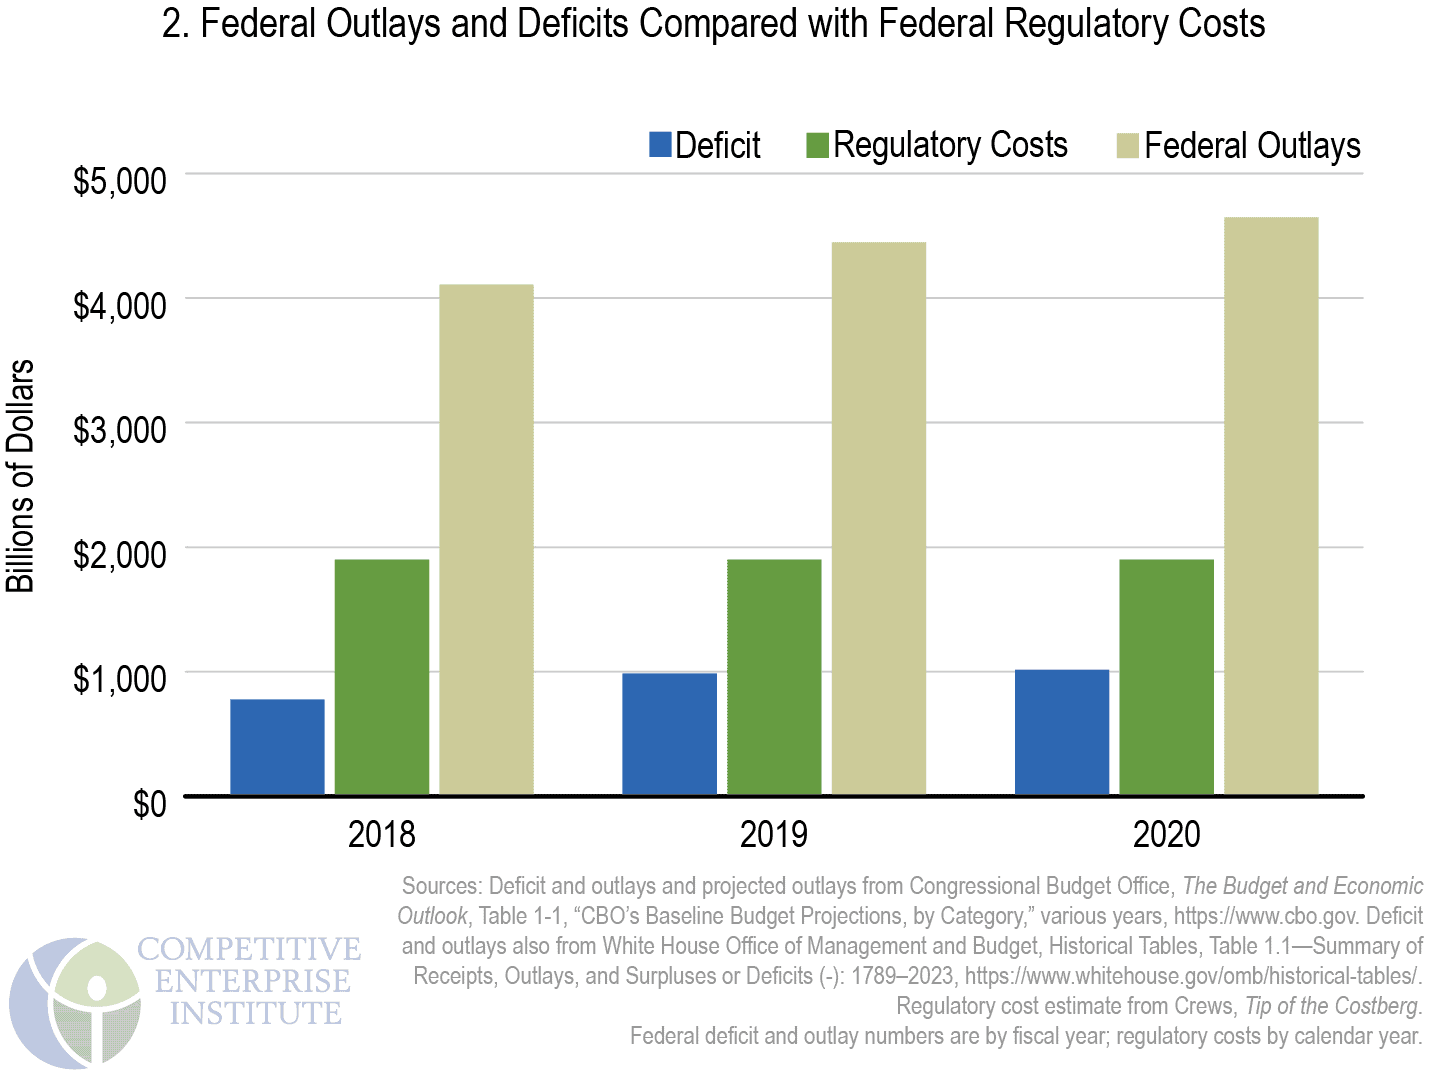
Comparisons of regulation with the costs of federal taxation and spending help place the relative magnitudes in perspective. The first ever trillion-dollar budget occurred in the latter half of the 1980s; now deficits of that size are projected with no end in sight.412 The U.S. federal government reached $4.447 trillion in outlays and a deficit of $984 billion in FY 2019.413 In the Congressional Budget Office’s new Budget and Economic Outlook, unrelenting trillion-dollar deficits continue every year through 2030, at which point the projection is $1.7 trillion.414 Figure 2 compares deficits and outlays for fiscal years 2018 and 2019 and projected amounts for 2020 to the overall regulatory burden placeholder estimate of $1.9 trillion. For 2020, costs of regulatory compliance and intervention are equivalent to about 41 percent of the projected level of fiscal budget outlays of $4.647 trillion, and more than double the anticipated deficit expected to soar to $1.01 trillion.
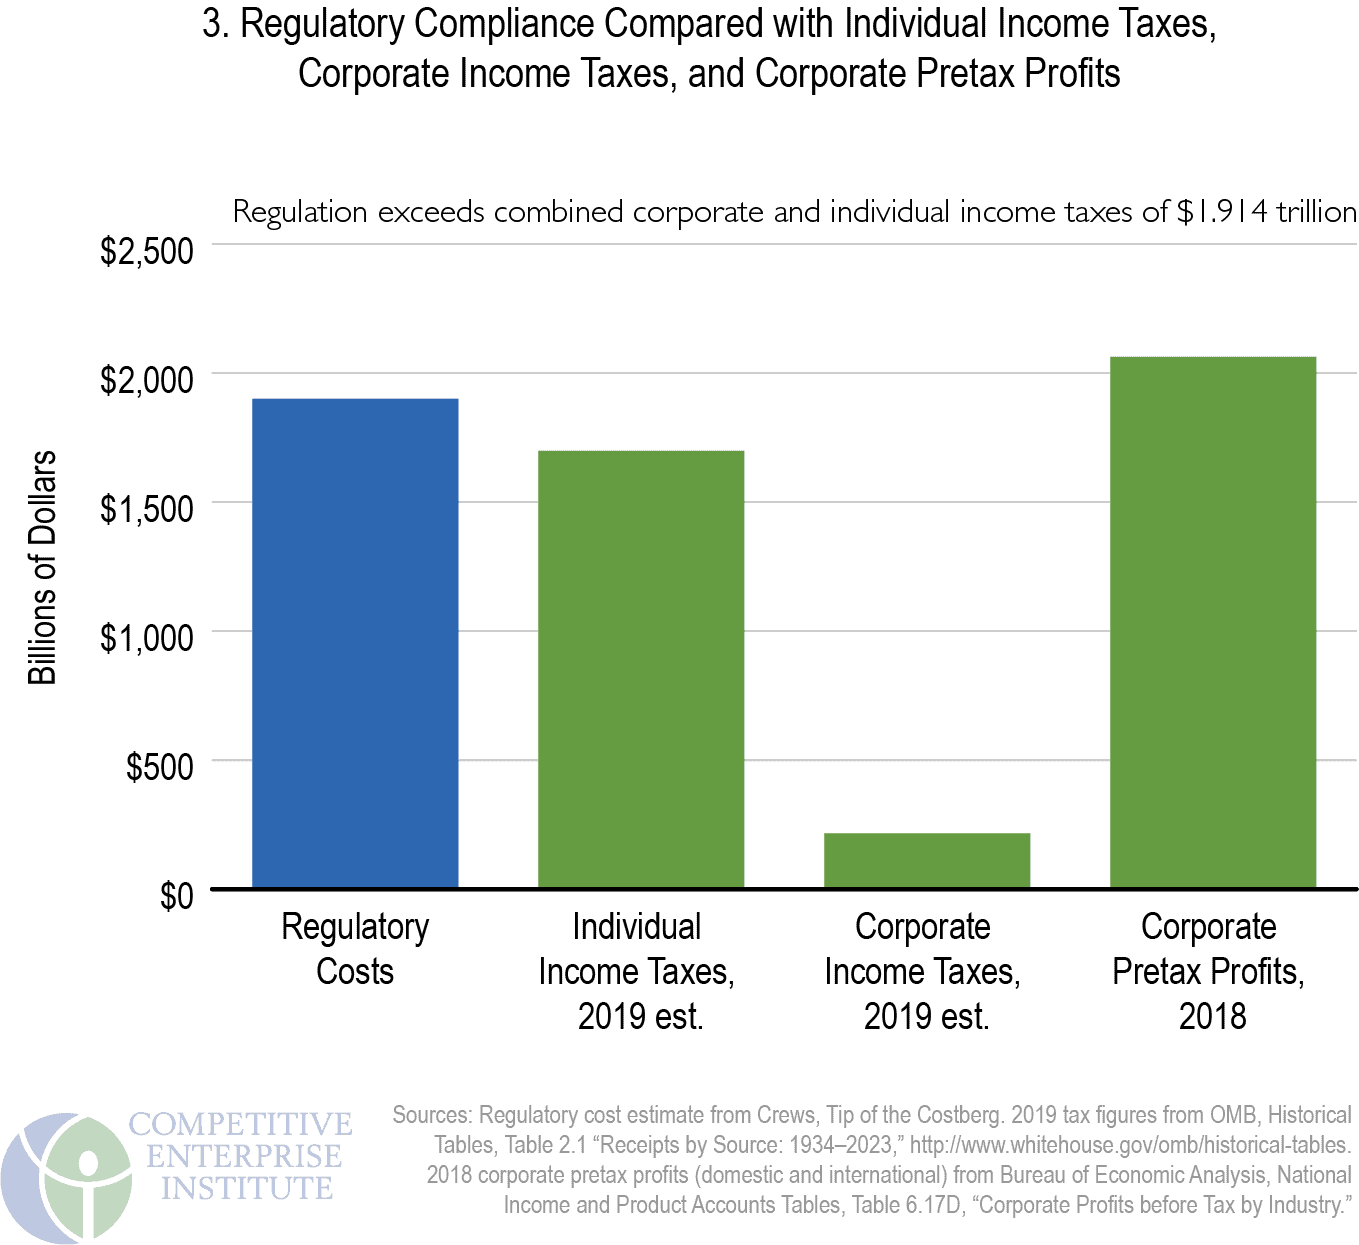
Regulatory Costs Compared to Income Taxes and Corporate Profits
Regulatory costs easily rival revenues from individual income taxes and corporate taxes combined. As Figure 3 shows, regulatory costs stand well above 2019 estimated individual income tax revenues of $1.698 trillion.415 Corporate income taxes collected by the U.S. government—an estimated $216 billion for 2019—are dwarfed by regulatory costs.416 The combination of the two, $1.914 trillion, is roughly equivalent our regulatory cost marker of $1.9 trillion. Regulatory costs even approach the level of pretax corporate profits, which were $2.063 trillion in 2018.417
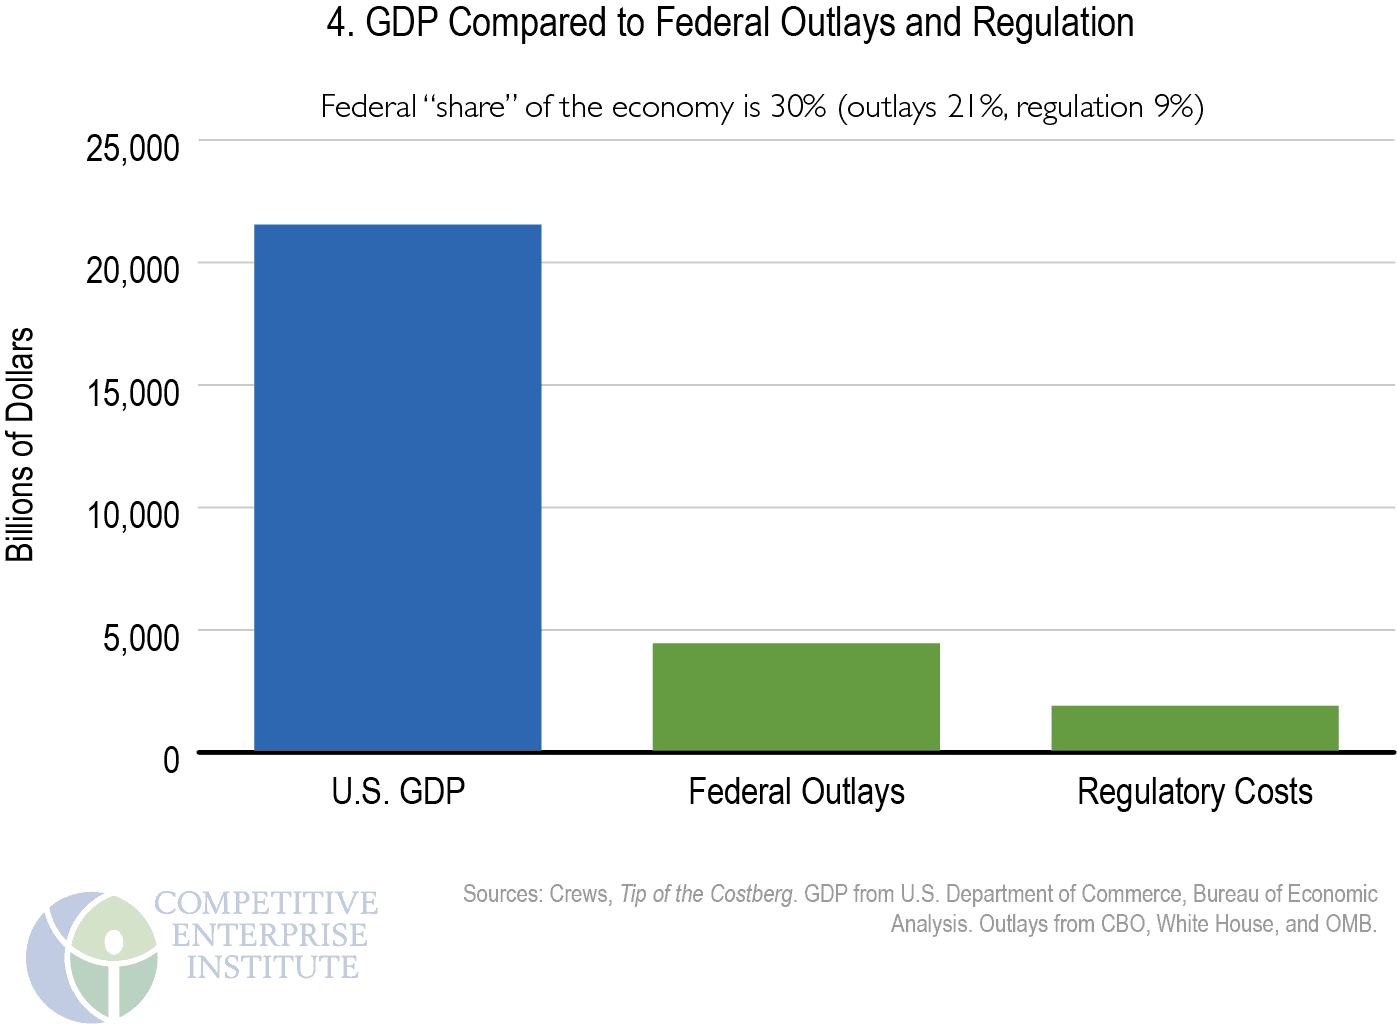
Regulatory Costs Compared to GDP
In January 2018, the Commerce Department’s Bureau of Economic Analysis estimated U.S. current-dollar GDP for 2019 at $21.54 trillion.418 The total regulatory cost figure of $1.9 trillion annually (as noted, other considerations could take that sum far higher) is equivalent to approximately 9 percent of that amount. Combining regulatory costs with federal FY 2019 outlays of $4.447 trillion, the federal government’s share of the economy reaches $6.35 trillion, or 29 percent of GDP (see Figure 4). That does not include state and local spending and regulation. The percentage has been approximately 30 percent for some time.
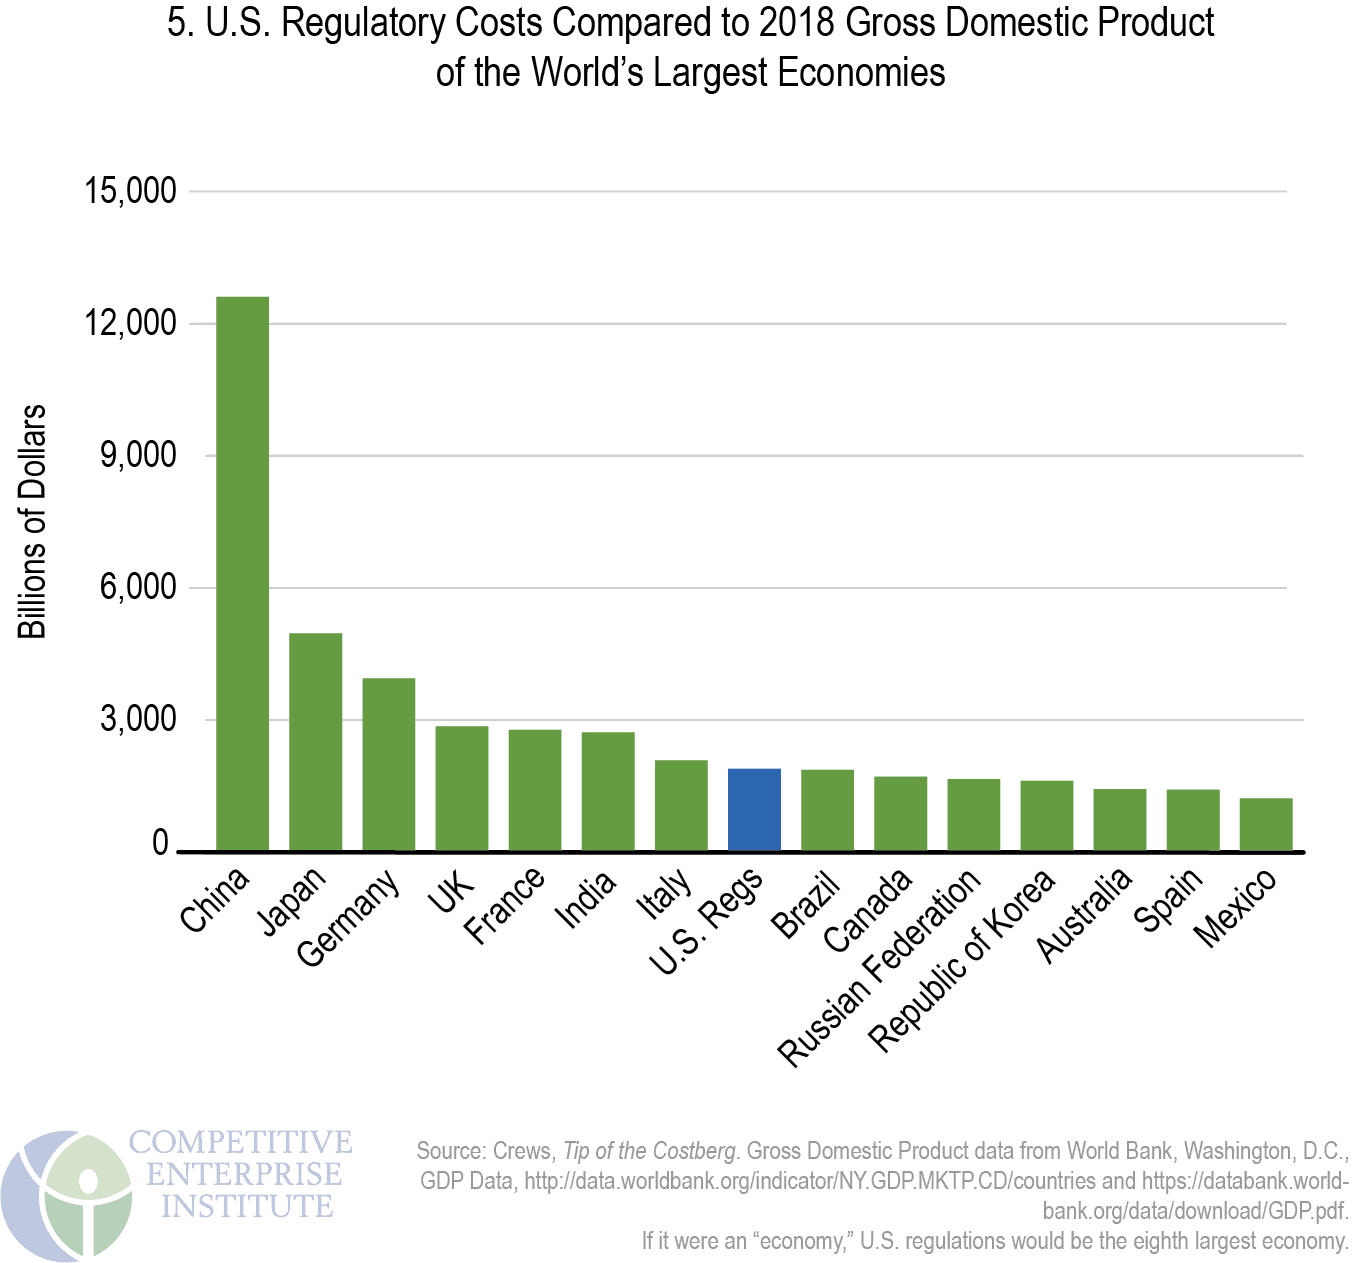
U.S. Regulation Compared with Some of the World’s Largest and Freest Economies
Not counting the United States, only seven countries have GDPs that exceed the burden of U.S. regulation. U.S. regulatory costs surpass the 2018 GDP of neighbors Canada, at $1.7 trillion, and Mexico, at $1.2 trillion. If U.S. regulatory costs of $1.9 trillion were a country, it would be the world’s eighth-largest economy, ranking behind Italy and ahead of Brazil (see Figure 5).419
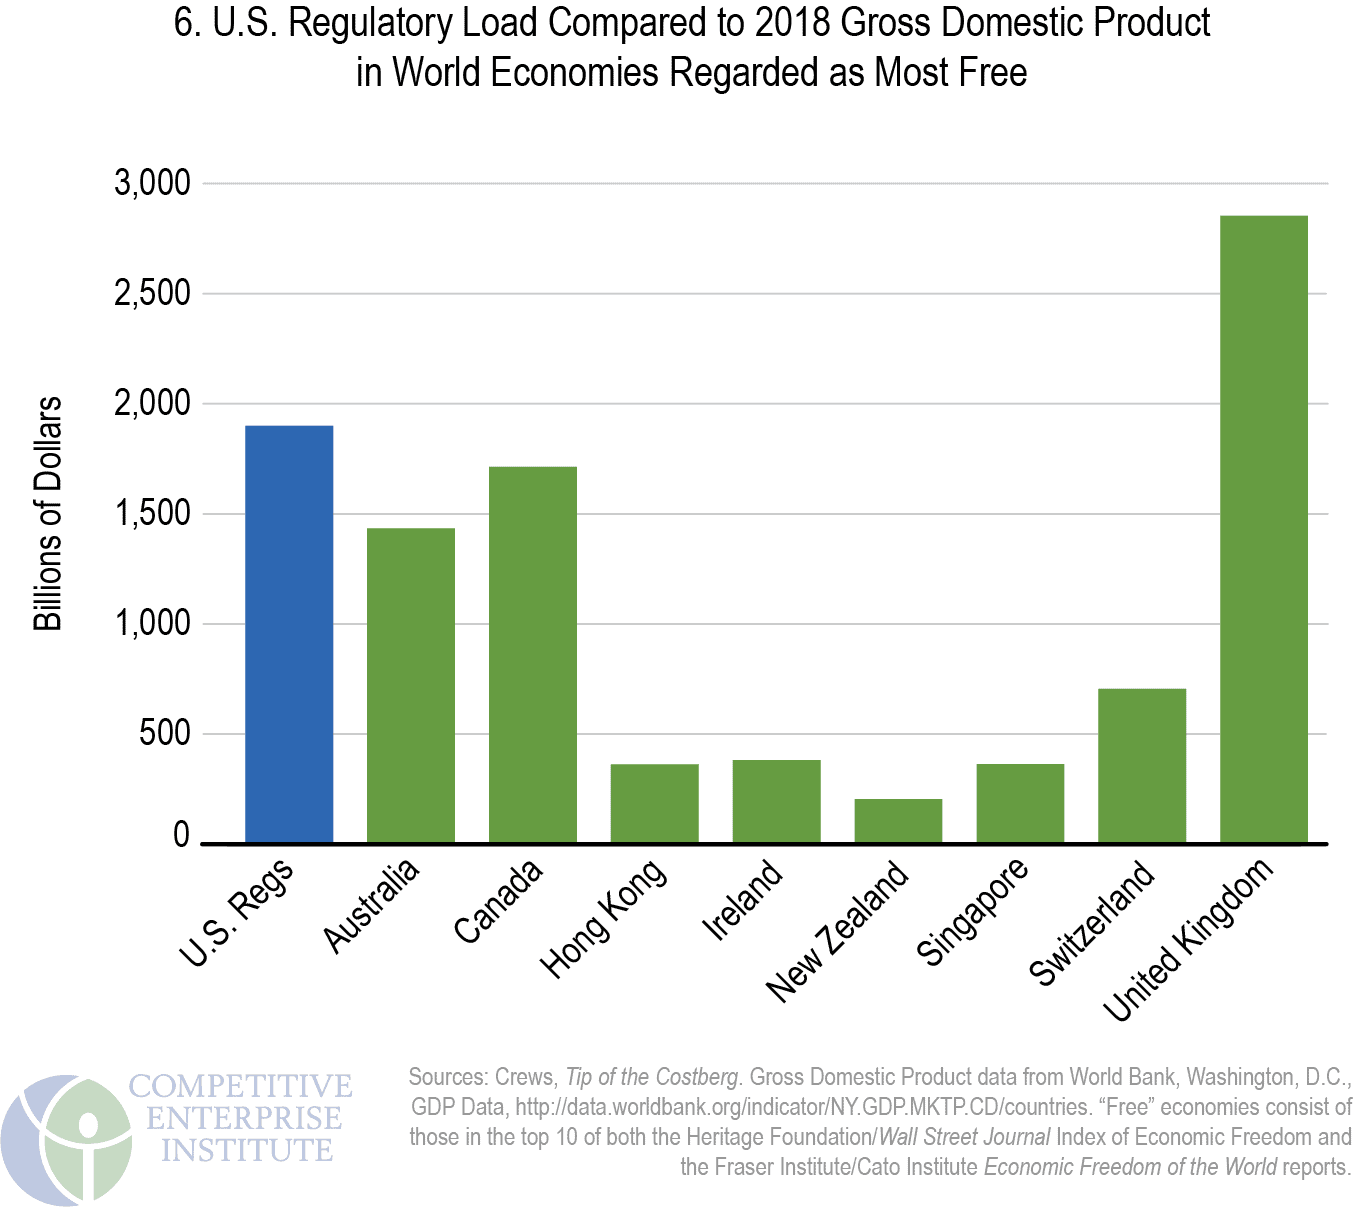
The U.S. regulatory figure of $1.9 trillion easily exceeds the output of many of the world’s major economies, including those, with the exception of the United Kingdom, ranked as the freest economically by two prominent annual surveys of global economic freedom. Figure 6 depicts the 2018 GDPs of the countries common to the top 10 in both the Wall Street Journal/Heritage Foundation Index of Economic Freedom, and the Fraser Institute/ Cato Institute Economic Freedom of the World report.420 The U.S. ranks 12th and fifth in these reports, respectively.
Regulation: A Hidden Tax on the Family Budget
The pain of taxes can seem more immediate and present than that of regulation, but, like the taxes they are required to pay, businesses will pass some regulatory costs on to consumers. Other costs will find their way to workers and investors in regulated companies. By assuming a full pass-through of all such costs to consumers—many consumers are also workers and owners through stock and mutual fund holdings—we can look at the share of each household’s regulatory costs and compare it with total annual expenditures as compiled by the Department of Labor’s Bureau of Labor Statistics (BLS).421
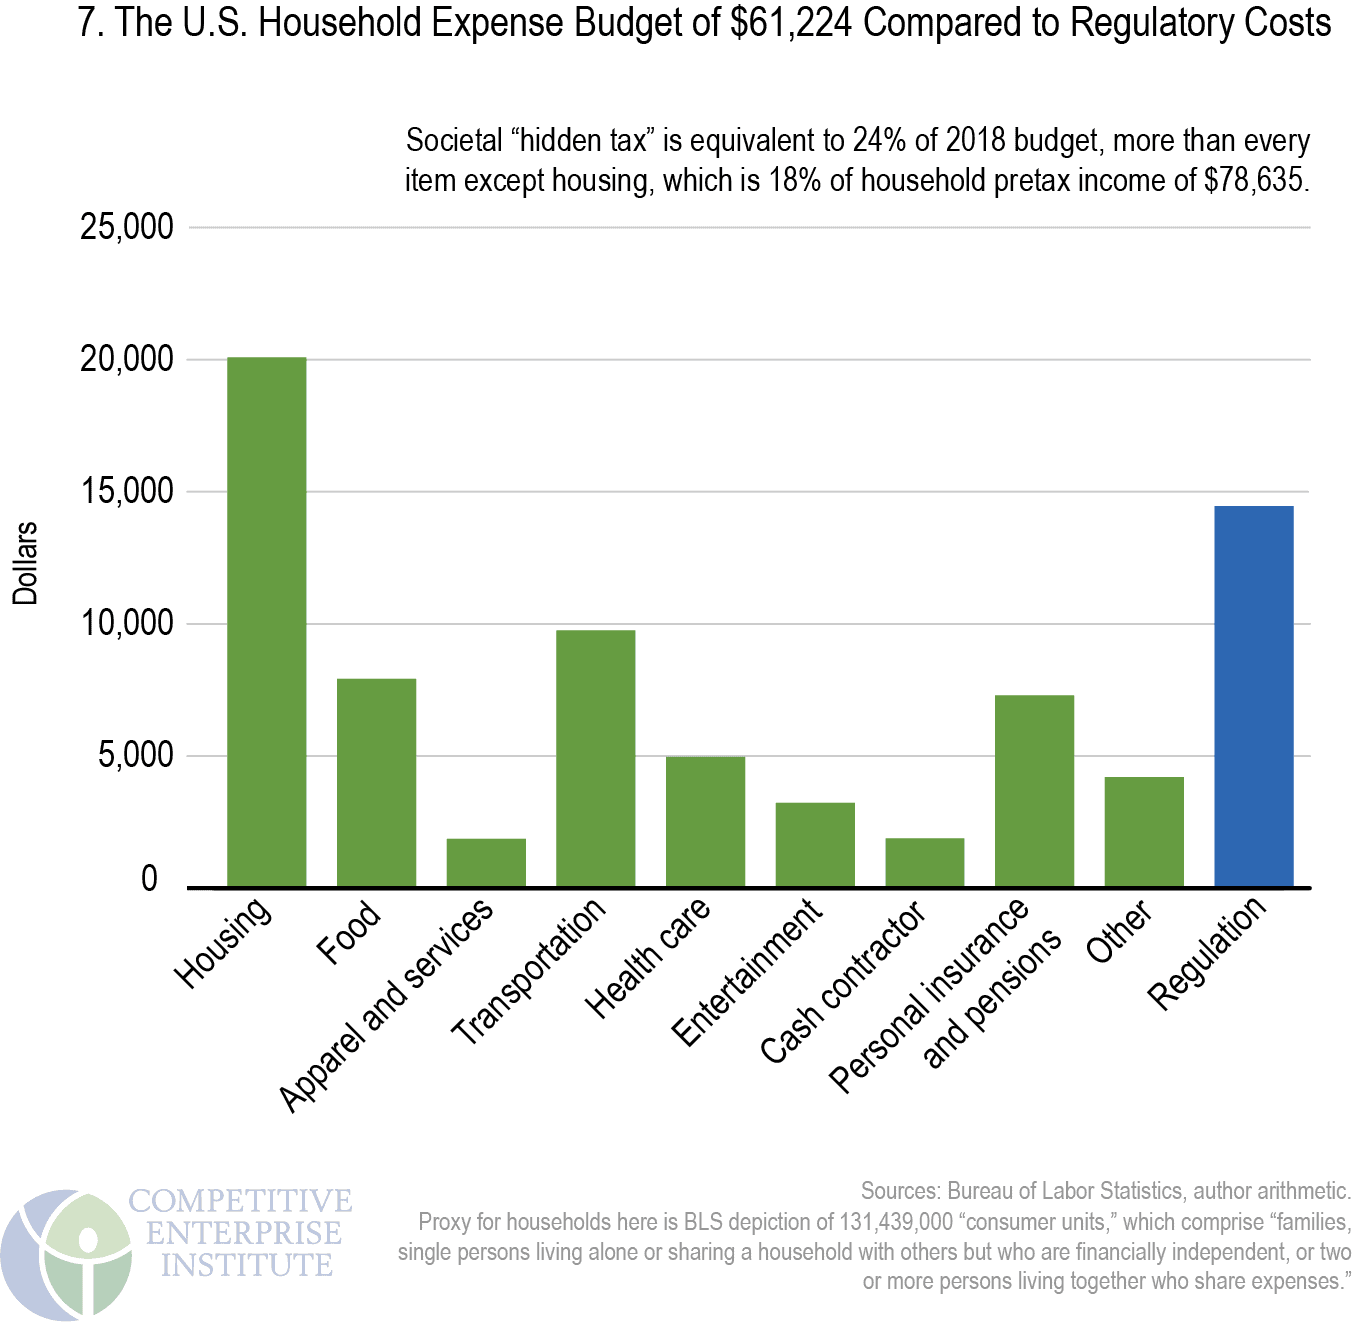
For America’s 131.4 million households, or “consumer units” in BLS parlance, the average 2018 pretax income was $78,635.422 If one were to allocate annual regulatory costs assuming, for simplicity’s sake, a full passthrough of costs to consumers, U.S. households “pay” $14,455 annually in embedded regulatory costs ($1.9 trillion in regulation divided by 131,439,000 “consumer units”), or 18 percent of average income before taxes, and more as a share of after-tax income. This regulatory “hidden tax” is higher than every annual household budgetary expenditure item except housing (see Figure 7). Regulatory costs amount to up to 24 percent of the typical household’s expenditure budget of $61,224. The average U.S. household “spends” more on hidden regulation than on health care, food, transportation, entertainment, apparel, services, and savings. Of course, some costs of regulation are not hidden. Consumers pay for regulatory agencies and administration more directly through taxes.
The Administrative and Enforcement Costs of Regulation
Regulatory estimates attempt to capture costs experienced by the public, but those estimates do not include administrative costs— the on-budget amounts spent by federal agencies to produce and enforce rules. The Weidenbaum Center at Washington University in St. Louis and the George Washington University Regulatory Studies Center regularly examine the president’s annual budget proposal to compile the administrative costs of developing and enforcing rules. These amounts—as funds that taxpayers contribute to support agencies’ administrative operations—are disclosed in the federal budget in the way regulatory compliance and economic costs are not.
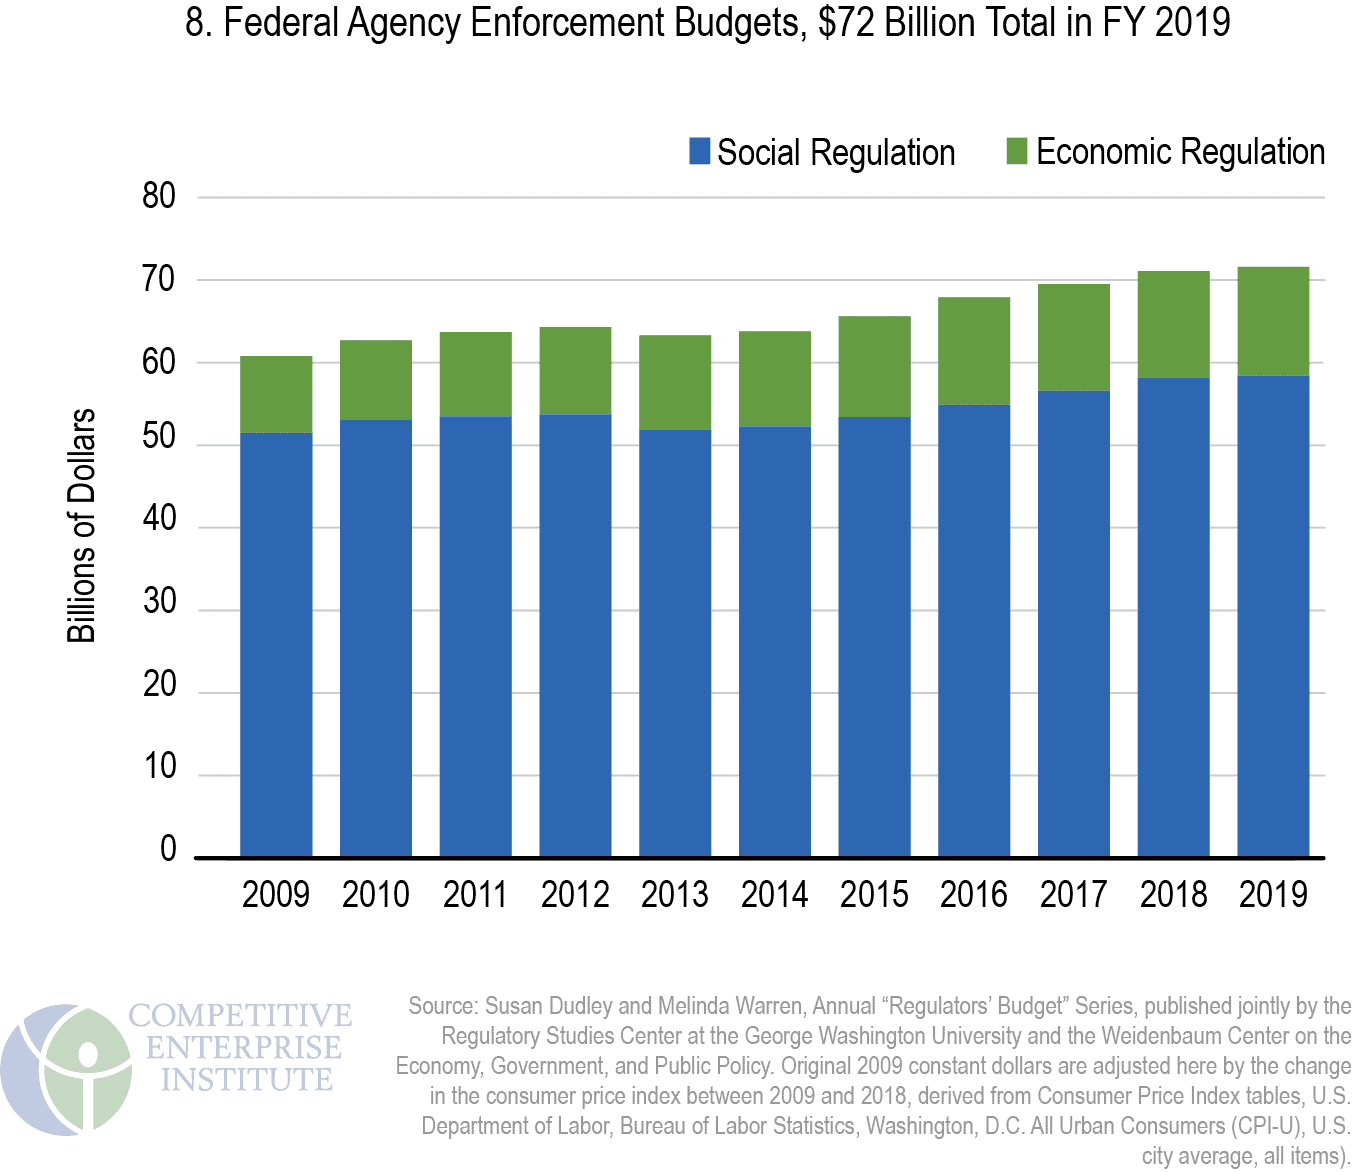
According to the latest compilation, FY 2019 enforcement costs incurred by federal departments and agencies stood at $72 billion (in constant 2019 dollars, adjusted from original 2012 dollars) (Figure 8).423 Of that amount, $13.2 billion was incurred on administering economic regulations. The larger amount, spent on writing and enforcing social and environmental regulations, was $58.4 billion. The $72 billion in regulatory agency enforcement costs helps complete a picture of the federal regulatory apparatus, as these come on top of other estimates of regulatory compliance and economic burdens.
In current dollars, the EPA alone spent an estimated $5.172 billion in this category in 2019, accounting for 7 percent of the total expected to be spent by all regulatory agencies.424 The EPA formerly accounted for the lion’s share of governmental administration and enforcement costs, but the Department of Homeland Security, at an estimated $33.3 billion, now comprises 48 percent.425
The Weidenbaum Center and the Regulatory Studies Center also estimate the number of full-time-equivalent administrative and enforcement staff at 287,063 in FY 2020, up from 281,606 in 2018. The number of federal employees has increased well over 100,000 since the 2001 staffing level of 173,057.426 Much of the post-2001 surge may be attributable to the then newly created Transportation Security Administration’s hiring of thousands of airport screening personnel.
Costs are one way to attempt to capture the size and scope of the federal regulatory enterprise, which is massive. Another is to assess the paper production—the regulatory material that agencies publish each year in sources like the Federal Register.